Série Scientifique
Scientific Series
Montréal Novembre 1996 96s-32
Technological Learning and
Organizational Context:
Fit and Performance in SMEs
Élisabeth Lefebvre, Louis A. Lefebvre,
Ce document est publié dans lintention de rendre accessibles les résultats préliminaires de la recherche effectuée au CIRANO, afin de susciter des échanges et des suggestions. Les idées et les opinions émises sont sous lunique responsabilité des auteurs, et ne représentent pas nécessairement les positions du CIRANO ou de ses partenaires.
This paper presents preliminary research carried out at CIRANO and aims to encourage discussion and comment. The observations and viewpoints expressed are the sole responsibility of the authors. They do not necessarily represent positions of CIRANO or its partners.
CIRANO
Le CIRANO est une corporation privée à but non lucratif constituée en vertu de la Loi des compagnies du Québec. Le financement de son infrastructure et de ses activités de recherche provient des cotisations de ses organisations-membres, dune subvention dinfrastructure du ministère de lIndustrie, du Commerce, de la Science et de la Technologie, de même que des subventions et mandats obtenus par ses équipes de recherche. La Série Scientifique est la réalisation dune des missions que sest données le CIRANO, soit de développer lanalyse scientifique des organisations et des comportements stratégiques.
CIRANO is a private non-profit organization incorporated under the Québec Companies Act. Its infrastructure and research activities are funded through fees paid by member organizations, an infrastructure grant from the Ministère de lIndustrie, du Commerce, de la Science et de la Technologie, and grants and research mandates obtained by its research teams. The Scientific Series fulfils one of the missions of CIRANO: to develop the scientific analysis of organizations and strategic behaviour.
Les organisations-partenaires / The Partner Organizations École des Hautes Études Commerciales.
École Polytechnique. McGill University. Université de Montréal.
Université du Québec à Montréal. Université Laval.
MEQ. MICST. Avenor.
Banque Nationale du Canada. Bell Québec.
Fédération des caisses populaires de Montréal et de lOuest-du-Québec. Hydro-Québec.
La Caisse de dépôt et de placement du Québec. Raymond, Chabot, Martin, Paré.
Société délectrolyse et de chimie Alcan Ltée. Téléglobe Canada.
Ville de Montréal.
Correspondence Address: Élisabeth Lefebvre, CIRANO, 2020 University Street, 25th floor, Montréal, Qc, *
Canada H3A 2A5 Tel: (514) 985-4007 Fax: (514) 985-4039 e-mail: [email protected] École Polytechnique de Montréal and CIRANO
École Polytechnique de Montréal and CIRANO
Université du Québec à Montréal and CIRANO §
Technological Learning and
Organizational Context:
Fit and Performance in SMEs
*
Élisabeth Lefebvre , Louis A. Lefebvre , Lise Préfontaine
§Résumé / Abstract
Cet article étudie les relations entre performance et cohérence organisationnelle. On évalue plus spécifiquement le niveau de cohérence entre les habilités dapprentissage et les attributs du contexte organisationnel pour ensuite établir la relation entre cette cohérence interne et la performance de la firme.
This paper investigates the relationship between organizational fit and performance. More specifically internal coherence within and between differential abilities to learn and attributes of the organizational context and the relationship between the level of internal coherence and firm performance is assessed in the specific context of SMEs. Results derived from a particular form of theoretical approach based on fit as gestalt suggest that fit and performance must be interpreted in light of the organizational evolution and the corresponding change brought upon by influencial actors such as the CEO. It was also possible to show not only that fit as gestalt is an appropriate methodological and analytical approach to the study of such phenomena but also that second order fit mey in fact provide more robust results since it allows to investigate mutual and reciprocal correspondence between configurations of abilities to learn and organizational context.
Mots Clés : Cohérence organisationnelle, apprentissage organisationnel, performance
1. Introduction
Knowledge is considered by most people to be a crucial factor likely to enhance the competitiveness of firms, if not their very survival (Quinn, 1992; Toffler, 1990). Some even claim that it is the most valuable and meaningful organizational asset (Drucker, 1993). Since knowledge cannot be dissociated from learning, a better understanding of what contributes to a learning organization is of the utmost importance for both practitioners and researchers.
A learning organization is defined as an organization skilled at creating, acquiring and transferring knowledge and ultimately at modifying its own behavior accordingly (Garvin, 1993: 80). Its foundations are grounded in a systemic vision which fosters an organizational environment where managers and employees can think and act creatively (Senge, 1990). Reporting on work done at the MIT Center for Organizational Learning, Kofman and Senge (1993) insist that creating a "community of commitment", and not just changing the prevailing culture, constitutes the required new capability of the learning organization. This suggests that a learning organization must be viewed in terms of its practices, its workforce, its commitments and its cultural and contextual attributes.
This paper will focus on technological learning based on the premise that technology deeply affects organizations and the products and services they provide. Two main objectives will be pursued: (i) assessing the degree of internal coherence or fit within and between differential abilities to learn and attributes of the organizational context that support or enhance learning; (ii) investigating the relationship between the level of internal coherence and overall organizational performance. These two questions are examined in the specific context of small manufacturing enterprises (SMEs).
2. Theoretical background
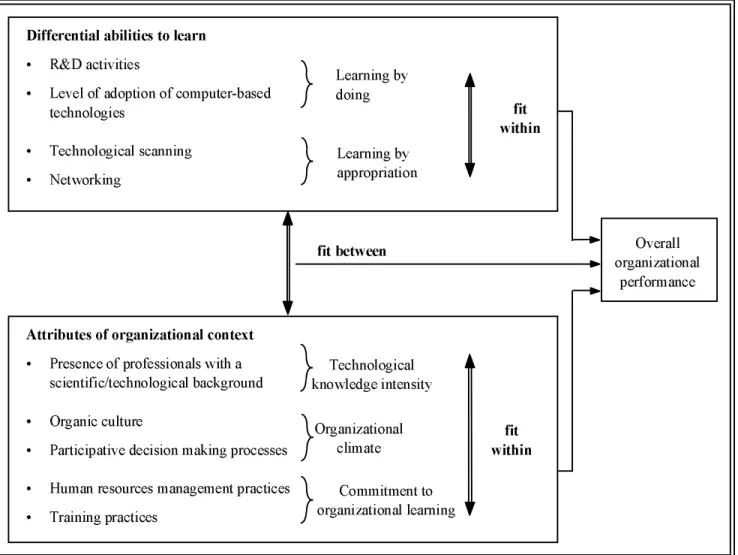
Organizational theorists have investigated the process of managerial and organizational sense-making or cognition as a means of ensuring organizational learning. This line of inquiry, along with the concept of fit, which is central to contingency theory, forms the basis on which the framework presented in figure 1 has been developed. In the next sections, we will briefly discuss the three main concepts and notions implied by this framework: differential abilities to learn, the attributes of the organizational context and the notion of fit (coherence or alignment).
3. Differential abilities to learn
The learning process is complex and implicit and the knowledge it generates can be tacit. During the learning process, however, tacit knowledge is transformed into explicit and observable processes (Nonaka and Takeuchi, 1995), practices or institutionalized routines (March, 1991). We will therefore need indicators which demonstrate that organizational learning has actually occurred. These indicators are referred as "differential abilities to learn" and are all related to technological learning (upper portion of figure 1).
The first two indicators refer to the fact that individuals and organizations learn by doing: they gain and accumulate knowledge and know-how through experience. In an SME context, the adoption, implementation and use of computer-based technologies, including advanced manufacturing technologies, and the performance at R&D activities are the most usual forms of technological learning by doing. The next two indicators relate to observable abilities associated with learning by appropriation: networking, which is shown to be linking an increasingly large number of SMEs in R&D partnerships (Kleinknecht and Reijen, 1991), and environmental scanning, which also provides opportunities for learning from the experience of others through technological transfer, collaboration and information gathering. These activities help develop the understanding and insight required to more quickly adapt to continuous change given that learning can also occur by the appropriation of knowledge developed by others, a process described by Cohen and Levinthal (1990) as "absorptive capacity".
learning in SMEs. Building on the abilities derived from these two forms of learning, an SME develops, cumulatively and over time, its own distinctive technological base.
4. Attributes of the organizational context
Most researchers share the basic assumption that organizational learning is more than the sum of all individual learning activities (Argyris, 1993: 123) and that it is cumulative (Lefebvre et al., 1995). The individual acts as the agent in the learning process, but organizational learning transcends individuals and refers to the process by which the group or organization improves the range of activities it performs to provide goods and/or services. Some of the most decisive organizational actions that foster individual learning are the hiring and retaining of skilled professionals. The technological knowledge intensity, captured by the proportion of professionals with scientific and technological backgrounds, is the basis for technological organizational learning considering that the sum of all individual learnings can be channelled towards the attainment of common organizational goals (Nonaka and Takeuchi, 1995).
In addition to a strong technological knowledge intensity, other attributes of the organizational context (lower part of figure 1) must be present. In order for organizational learning to occur, individuals within an organization must be given the opportunity to make the required changes to correct errors once they have been detected (what Argyris and Schon (1978) identify as double-loop learning). This necessitates an organizational culture which favors participation and openness, what Kanter (1983: 396) labels "organic" in opposition to "mechanistic" culture. Managers in such organizations favor participatory decision-making through formal and informal meetings and the active diffusion of information (Birley and Westhead, 1990). Workers' commitment to learning is encouraged and is reflected in various human resource practices such as performance appraisal (Hornsby and Kuratko, 1990) or through the existence of training practices (Snell and Dean, 1992). By developing an organizational climate conducive to change and creativity and committing to organizational learning, organizations promote employee motivation and skills, without which learning cannot occur.
5. Fit within and between differential abilities to learn and the attributes of the organizational
context
In contingency theory, an appropriate match or fit between two variables (for instance, strategy and environment) is assumed to promote performance. The concept of "fit" (or "coalignment" or "match") is complex (Drazin and Van de Ven, 1985) and can be classified into six different perspectives, each of which corresponds to a distinct conceptual and empirical meaning of fit (Venkatraman, 1989). Testing the existence of configurations of differential abilities to learn and of specific organizational attributes clearly requires the perspective known as "fit as gestalts". This implies that we are dealing with a complex structure and that we need to go beyond the analysis of individual constituent elements. Configurations represent common alignments of elements each configuration showing different multivariate relationships (Miller, 1996, p. 506). This criterion-free perspective allows one to assess the internal congruence of a set of variables and therefore "logically extends the bivariate fit perspective through a multitiered taxonomical approach" (Venkatraman, 1989: 432).
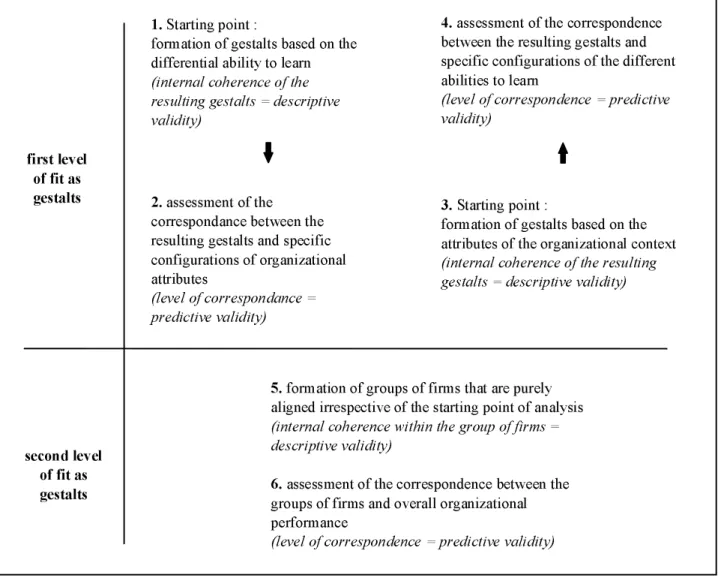
Within the context of this study, two levels of fit are proposed. The first level investigates fit within one set of variables and corresponds to the usual fit as gestalts approach which requires that both descriptive validity and the predictive validity be satisfied. Descriptive validity refers to the level of internal theoretical consistency of the gestalts or configurations derived from a first set of variables. Predictive validity refers to the expected implications of the observed gestalts on a second set of variables. This was represented in figure 1 by the large arrows and is further elaborated in figure 2 (steps 1 through 4). As can be seen, reverse causality is implied in figure 2. This question of bidirectional causal links is omnipresent in studies of most organizational phenomena (Baum and Singh, 1994) and the case of organizational learning is no exception. Mutual or circular causality (Richardson, 1991) is the essence of the coevolutionary approach (Van de Ven and Garud, 1994) where a set of variables influences another set of variables which, in turn, influences the behavior of the first set. Abilities to learn and attributes of the organizational context mutually reinforce each other. Whether different modes of organizational learning imply different organizational contexts or whether specific organizational contexts require different forms of ability to learn
R&D activities correspond here to both formal and informal activities. There is ample evidence that U 1
small firms carry out R&D activities that are not reported in official sources (Kleinknecht and Reijen, 1991).
is therefore a matter for debate. In that respect, the starting point of the analysis can be either set of variables.
The second level of fit is somewhat of a departure from what has been previously suggested for the perspective of fit as gestalts, as it introduces the notion of fit between configurations of variables (figure 1 and steps 4 and 5 of figure 2). This is done from the perspective of distinguishing firms that are aligned, irrespective of the starting point of the analysis, from those that are misaligned. Descriptive validity within this second order of fit will correspond to overall internal congruence between the two sets of variables and predictive validity to differing levels of organizational performance. This second level of fit is the most robust.
6. Methodology
6.1 Data collection
A carefully pre-tested questionnaire was sent to the chief executive officer (CEO) of all SMEs operating in the electrical energy sector in one Canadian province. Out of a population of 277 firms, 110 firms agreed to fully participate in the research. The response rate of 40% was considered quite satisfactory, and no follow-up was done.
6.2 Research variables
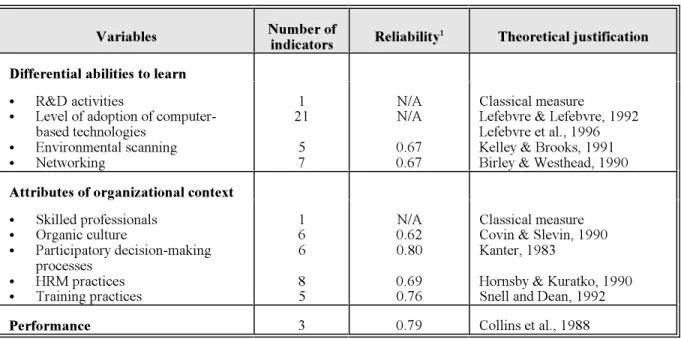
The research variables, with their definitions and theoretical justification are displayed in Table 1. For all perceptual variables, the number of indicators and the Cronbach alphas are provided. The exact wording for these perceptual variables is provided in Appendix 1.
In the first set, the two factual variables are R&D activities , captured by the percentage of annual sales allocated to R&D,U
and the level of adoption of computer-based technologies, which is a composite measure taking into account the technologies implemented in a particular firm and the degree of radicalness of each technology as assessed by a panel of experts (see appendix 2).
The next two variables are perceptual: environmental scanning is a measure proposed by Kelley and Brooks (1991) and networking is derived from the work of Birley and Westhead (1990). These two variables exhibit fairly high reliability among indicators (Cronbach alphas of 0.67 for both variables).
In the second set, all attributes of organizational context range with the exception of technological knowledge intensity are perceptual variables for which operational measures were borrowed from the existing literature. Cronbach alphas from 0.62 to 0.80, which is satisfactory.
Finally, CEOs evaluated their own firm's performance compared to the industry average with respect to (1) annual rate of growth, measured as a percentage of total assets, in the last three years; (2) annual rate of growth of sales in the last three years; (3) average rate of return in the last three years. Subjective measures are preferred to factual measures since CEOs of small firms are often reluctant to disclose hard financial data (Sapienza et al., 1988) and because these measures are also known to be very strongly correlated with the factual measures.
7. Findings and discussion
Firms in our sample are rather small (on average 62 employees with a gross annual revenue of 10.3 million dollars). The statistical analyses performed on the sample of SMEs are carried out in three consecutive steps. First, fit within each set of variables which corresponds to first level fit is investigated (table 2). Second, fit between set of variables which is referred to as second level is assessed (table 3). Finally, the robustness, stability and validity of the results are discussed.
7.1. First level fit
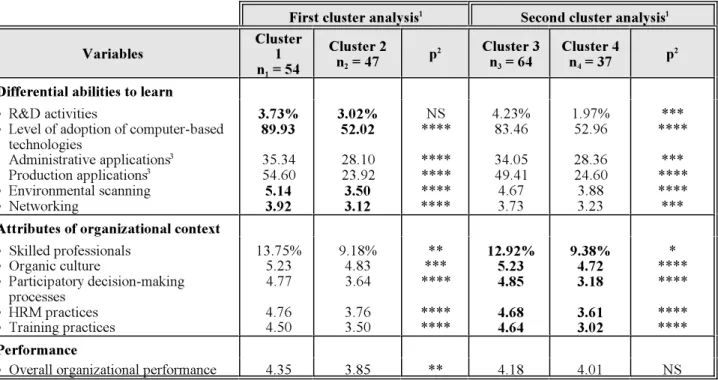
In order to identify "gestalts" or configurations among the characteristics displayed by SMEs with respect to their differential abilities to learn (first three columns of table 2) and the attributes of their organizational context (last three columns of table 2), two cluster analyses were performed. The main objective of these multivariate analyses is to form groups or clusters of firms which exhibit high internal homogeneity (or similar characteristics within groups) and high external heterogeneity (or dissimilar characteristics between groups). As a measure of similarity, the Mahalanobis distance, which is the standardized form of the Euclidian distance, is the most appropriate since it not only removes the bias introduced by the differences in the scales used to operationalize the research variables but it also adjusts for the interdependencies or intercorrelations between the research variables. Our choice of hierarchical cluster procedure is the complete linkage procedure based on the maximum distance between firms and is also referred to as the "furthest neighbour approach".
The statistical results presented in table 2 follow the analytical procedure presented in figure 2. These results allow us to assess the descriptive and predictive validity of the gestalts determined by the two cluster analyses. In the first cluster analysis (first three columns of table 2), two groups of firms (cluster 1, n = 54; cluster 2, n = 47) are distinguished based on their1 2
differential abilities to learn (displayed in bold characters for easier identification). Both groups demonstrate high internal coherence: the first one consistently proves to be more advanced with respect to all indicators of technological learning than the second one. Firms in the first group invest proportionately greater amounts in R&D, have adopted and implemented more computer-based technologies, including advanced manufacturing applications, and devote more efforts to environmental scanning and networking activities. Differences between the two groups are very significant (p = 0.0000) except for R&D.
Does the organizational context correspond to the two distinct profiles of firms as expected? The predictive validity is very satisfactory as both groups of firms reveal an organizational context that is consistently in line with the theoretical expectations: advanced organizational learners have hired more skilled professionals, have a more organic culture, have implemented more participatory decision-making processes and have placed more emphasis on HRM and training practices. Once again, the two groups of firms differ significantly with regard to all attributes of the organizational context. Going one step further, improved organizational performance is observed from the advanced learners, which is in fact the case, and this provides additional support for the predictive validity of the two gestalts.
The second cluster analysis is now performed on the basis of the attributes of the organizational context (again displayed in bold characters for easier identification). The logic of this second cluster is as follows: a more favourable organizational context should lead to a more advanced level of technological learning. The starting point is therefore the attributes of the organizational context. The last two clusters display two very coherent sets of organizational attributes, as firms in cluster 3 (n = 64) display an organizational context which is far more conducive to organizational learning than do firms in cluster3
4 (n = 37). Descriptive validity is therefore high. When turning to predictive validity, firms in the third cluster are4
systematically more advanced with respect to their demonstrated abilities to learn than firms in the fourth cluster, as had been hypothesized: yet although their organizational performance is higher, it is not significantly different.
7.2. Second level fit
Firms that belong to clusters 1 and 3 and to clusters 2 and 4 respectively form two groups which are perfectly aligned (na1
learn and of attributes of organizational context. Other firms are misaligned since there is no perfect match between configurations (n = 12 and n = 22).ma1 ma2
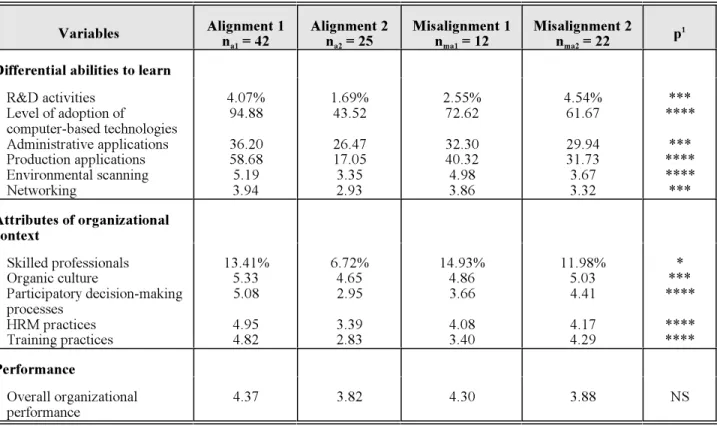
Table 3 shows the means for each research variable for the four groups of firms displayed in figure 3 and the corresponding level of significance of the non-parametric ANOVA.
Several interesting observations stand out from the results of table 3. First, a rather large percentage of firms are perfectly aligned (67 out of 101), indicating that there is a high level of coherence between learning and organizational context in SMEs. This could be explained by the very nature of small firms, which are inherently adaptive and usually streamlined in their decision-making processes and where the CEO is known to carry considerable influence. Second, perfect fit or second level fit is a better predictor of organizational performance than first level fit (4.37 in table 3 vs. 4.35 and 4.18 in table 2; 3.82 in table 3 vs. 3.85 and 4.01 in table 2). It also reveals stronger divergences in the observed profiles of both groups of firms while at the same time providing higher levels of internal coherence among the observed variables. Third, misalignment does not necessarily lead to poor organizational performance, as can be observed from the group entitled "Misalignment 1" (n = 12). This group performs significantly better than the group "Alignment 2" (4.30 vs. 3.82; p = 0.05)ma1
and almost as well as "Alignment 1" (4.30 vs. 4.37).
When examining in more detail the profiles of the firms in the two groups called respectively Misalignment 1 and Misalignment 2, some of the sources of internal incoherences become apparent. Firms in Misalignment 1 demonstrate rather strong abilities to learn, especially with respect to the adoption of computer-based technologies, with the exception of R&D activities. These firms also have the highest percentage of skilled professionals, but they do not display an organizational context very conducive to organizational learning (they rank third out of the four groups). One can speculate that they derive their main competitive advantage from automation and seem to have developed some core rigidities. Firms in Misalignment 2 present a puzzling profile with some internal contradictions: R&D investments are the strongest of all four groups of firms but they are in third place in terms of all other types of abilities to learn and with respect to the percentage of skilled workers. At the same time, though, they present an organizational context favourable to organizational learning. Firms in this group are poor performers. Are these firms in transition? Are their innovations and efforts channelled in the wrong direction? These questions remain to be answered.
7.3. Robustness, stability and validity of results
The results shown in tables 2 and 3 are remarkably robust, as the firm profiles are significantly different for all research variables with one exception. Is this an artifact of the statistical analyses? In order to verify the stability and robustness of the results, several statistical procedures were performed. The selection of the number of clusters is obviously a critical issue: alternative cluster solutions with differing number of clusters were examined (3, 4 and 5 clusters) and only the optimal solution (2 clusters) was retained (Milligan and Cooper, 1985; Punj and Steward, 1990). Once the 2-cluster solution was chosen, the stability of the results was assessed using the "jackknife method", where samples based on the "leave-one-out" principle are repeatedly drawn from the original sample while bivariate tests (t-tests or ANOVA) allowed us to test the significant differences between groups. Discriminant analyses were used to further validate, in a multivariate manner, the cluster solutions in table 2 and the groups of firms in table 3. The three discriminant functions (appendix 3) were highly significant (p = # 0.0001) and generated an extremely high overall classification rate of 92.8% for clusters 1 and 2, 93.7% for clusters 3 and 4 and 100% for Alignment 1 and Alignment 2. This last perfect classification, although quite exceptional, is mainly due to the fact that grey zones were removed (i.e. firms in Misalignment 1 and Misalignment 2). Based on the factors presented above, the results are judged to be stable and robust.
One last concern involves the generalization of the results. This study was conducted in the specific context of small manufacturing firms operating in a particular sector of industrial activity. This provides internal validity but may pose problems related to external validity. There is no doubt that the observed phenomena cannot be generalized to larger firms. However, we do suspect that the results of this study can be extended to other SMEs from other industrial sectors. Therefore, we would claim that the main findings of this study are contingent upon the size of firm but not the sector. This could be
investigated in subsequent studies.
8. Conclusion
Our research which focuses on technological organizational learning in an SME context, shows that differing levels of internal coherence exist within and between differential abilities to learn and the attributes of the organizational context. It also demonstrates that specific configurations or "gestalts" can be linked to overall organizational performance and that, although perfectly aligned firms are the best performers, misalignment in some cases does not equate to poor performance. The specific implications of this research are as follows. First, the general proposition that organizational context and learning form a mutually reinforcing system leads to the investigation of understudied theoretical and analytical issues. As reported by Baum and Singh (1994), the study of even moderately complex phenomena requires a departure from the traditional form of modelling relations between independent and dependent variables. In our case, internal coherence within and between configurations of sets of variables suggested a form of mutual or circular causality in line with the coevolution theory. In this particular case, it has been shown that fit as gestalt may be an appropriate methodological and analytical approach to the study of such phenomena namely because it is a criterion-free approach. Going a step further, we have also demonstrated that second order fit may provide more robust results since it allows one to identify firms that demonstrate the perfect alignment between configurations of two sets of variables.
Second, it was shown that fit does lead to greater organizational performance but, in certain circumstances, misalignment may as well translate into high performance. As organizations evolve through phases of change and stability (Cyert and March, 1963; Tushman and Romanelli, 1985) and as learning also evolves through different stages of reorientation and convergence (Lant and Mezias, 1992), alignment and misalignment can be interpreted as reflections of these patterns of organizational changes. This brings into light an additional interpretation of the relationship between fit and performance. Third, fit and misalignment in SMEs cannot be dissociated from the predominant role of the CEO whose influence on the general orientation of the firm certainly provides the impulse for moving through the different phases of change and stability. Added insight may be gained by thoroughly examining CEOs role and influence on organizational learning in SMEs. Finally, this study has focussed on internal fit while trying to cope with external fit through research design by restricting the sample to firms with similar external environments. Considering that CEO perceptions of the same external environment widely differ and that these perceptions override reality (Lefebvre et al., 1997), the study of internal fit should be extended to the external fit by integrating to the investigation the cognitive schemes of the CEOs.
In SMEs where technology is known to play a significant role, technological organizational learning represents a crucial and yet underinvestigated line of inquiry. Clearly, additional conceptual and empirical work is required to further our understanding of technological learning, organizational context, fit and performance in SMEs.
References
Argyris, C. and D. Schon, Organizational Learning: A Theory of Action Perspective, Reading, Massachusetts, Addison-Wesley, 1978.
Argyris, C., On Organizational Learning, Blackwell Publishers, Cambridge, Massachusetts, 1993.
Baum, A.C. and J.V. Singh, "Organization - Environment Coevolution", in Baum A.C. and J.V. Singh (eds.), Evolutionary Dynamics of Organizations, New York, Oxford University Press, 1994, pp. 379-401.
Birley, S. and P. Westhead, "Growth and Performance Contrasts Between 'Types' of Small Firms", Strategic Management Journal, 1990, vol. 11, no. 7, pp. 535-557.
Cohen, W.M. and D.A. Levinthal, "Absorptive Capacity: A New Perspective on Learning and Innovation." Administrative Science Quarterly, 1993, vol. 35, no. 1, pp. 128-152.
Collins, P.D., J. Hage and F.M. Hull, "Organizational and Technological Predictors of Change in Automaticity", Academy of Management Journal, 1988, vol. 31, pp. 512-543.
Covin, J.G. and D.P. Slevin, "New Venture Strategic Posture, Structure and Performance: An Industry Life Cycle Analysis." Journal of Business Venturing, 1990, vol. 5, no. 2, pp. 123-135.
Cyert, R.M. and J.G. March, A Behavioral Theory of the Firm, Prentice-Hall, Englewood Cliffs, 1963.
Drazin, R. and A.H. Van de Ven, "An Examination of Alternative Forms of Fit in Contingency Theory", Administrative Science Quarterly, 1985, vol. 30, pp. 514-539.
Drucker, P., Post-Capitalist Society, Butterworth Heinemann, Oxford, 1993.
Garvin, D.A., "Building a Learning Organization", Harvard Business Review, July-August 1993, pp. 78-91.
Hornsby, J.S. and D.F. Kuratko, "Human Resource Management in Small Business: Critical Issues for the 1990's." Journal of Small business Management, 1990, vol. 28, no. 3, pp. 9-18.
Kanter, R. M., The Change Masters - Innovation and Entrepreneurship in the American Corporation, New York: Simon & Schuster Inc, 1983.
Kelley, M.R. and H. Brooks, "External Learning Opportunities and the Diffusion of Process Innovations to Small Firms", Technological Forecasting and Social Change, 1991, vol. 39, no.1/2, pp. 103-125.
Kleinknecht, A. and J.O.N. Reijen, "More Evidence on the Undercounting of Small Firm R&D", Research Policy, 1991, pp. 579-587.
Kofman, F. and P.M. Senge, "Communities of Commitment: The Heart of Learning Organizations", Organizational Dynamics, 1993, vol. 22, no. 2, pp. 5-22.
Lant, T.K. and S.J. Mezias, "An Organizational Learning Model of Convergence and Reorientation", Organization Science, 1992, vol. 3, no. 1, pp. 47-71.
Lefebvre, L.A., R. Mason and É. Lefebvre, "The Influence Prism in SMEs: The Power of CEOs' Perceptions on Technology Policy and Its Organizational Impacts", Management Science,1997, (forthcoming).
Lefebvre, L.A., É. Lefebvre and J. Harvey, "Intangible Assets as Determinants of Advanced Manufacturing Technology Adoption in SMEs: Toward an Evolutionary Model", IEEE Transactions on Engineering Management, 1996, vol. 43, no. 3, pp. 307-322..
Lefebvre, É., L.A. Lefebvre and M.J. Roy, Technological Penetration and Organizational Learning in SMEs: The Cumulative Effect, Technovation, 1995, vol. 15, no. 8, pp. 511-522.
Lefebvre, É. and L.A. Lefebvre, "Firm Innovativeness and CEO Characteristics in Small Manufacturing Firms", Journal of Engineering and Technology Management, 1992, vol. 9, no.,3, pp. 243-277.
March, J.G., "Exploration and Exploitation in Organization Learning", Organizational Science, 1991, vol. 2, no. 1, pp. 71-87.
Miller, D., Configurations Revisited, Strategic Management Journal, 1996, vol. 17, no. 7, pp. 505-512.
Milligan, G.W. an M.C. Cooper, "An Examination of Procedures for Determining the Number of Clusters in a Data Set", Psychometrika, 1985, vol. 50, pp. 159-179.
Nonaka, I. and H. Takeuchi, The Knowledge Creating Company, Oxford University Press Inc., New York, 1995. Punj, G. and D. Stewart, "Cluster Analysis in Marketing Research: Review and Suggestions for Applications", Journal of
Marketing Research, 1983, vol. 20, May, pp. 134-148.
Quinn, J.B., Intelligent Enterprise, The Free Press, New York, 1992.
Richardson, G.P., Feedback Thought in Social Science and Systems Theory, Philadelphia, University of Pennsylvania Press, 1991.
Sapienza, H.J., K.G. Smith and M.J. Gannon, "Using Subjective Evaluations of Organizational Performance in Small Business Research", American Journal of Small Business, 1988, vol. 12, 43-53.
Senge, P.M., The Fifth Discipline: The Art and Practice of the Learning Organization, New York, Doubleday Currency, 1990.
Snell, S.A. and J.W. Dean, "Integrated Manufacturing and Human Resource Management: A Human Capital Perspective", Academy of Management Journal, 1992, vol. 35, no. 5, pp. 467-504.
Toffler, A., Powershift: Knowledge, Wealth and Violence at the Edge of the 21 Century, New York: Bantan Books, 1990.st
Tushman, M.L. and E. Romanelli, "Organizational Evolution: A Metamorphic Model of Convergence and Reorientation" in Cummings L.L. and B.M. Staw (Eds.), Research in Organizational Behavior, Greenwich, JAI Press, 1985, pp. 171-222.
Van de Ven, A.H. and R. Garud, "The Coevolution of Technical and Institutional Events in the Development of an Innovation" in Baum A.C. and J.V. Singh (eds), Evolutionary Dynamics of Organizations, New York, Oxford University Press, 1994, pp. 425-443.
Venkatraman, N. (1989), "The Concept of Fill in Strategy Research: Toward Verbal and Statistical Correspondence", Academy of Management Review, 1989, vol. 4, no. 3, pp. 423-444.
Differential abilities to learn R&D activities
Level of adoption of computer-based technologies Technological scanning Networking Learning by doing Learning by appropriation
Attributes of organizational context Presence of professionals with a
scientific/technological background Organic culture
Participative decision making processes Human resources management practices Training practices Technological knowledge intensity Organizational climate Commitment to organizational learning Overall organizational performance fit between fit within fit within
first level of fit as gestalts
1. Starting point :
formation of gestalts based on the differential ability to learn (internal coherence of the resulting gestalts = descriptive validity)
2. assessment of the
correspondance between the resulting gestalts and specific configurations of organizational attributes
(level of correspondance = predictive validity)
4. assessment of the correspondence between the resulting gestalts and specific configurations of the different abilities to learn
(level of correspondence = predictive validity)
3. Starting point :
formation of gestalts based on the attributes of the organizational context (internal coherence of the resulting gestalts = descriptive validity)
second level of fit as gestalts
5. formation of groups of firms that are purely aligned irrespective of the starting point of analysis (internal coherence within the group of firms = descriptive validity)
6. assessment of the correspondence between the groups of firms and overall organizational performance
(level of correspondence = predictive validity) Figure 2. Fit as gestalts : first and second levels of fits
Table 1. Research variables, their operationalization and theoretical justification
Variables Number ofindicators Reliability1 Theoretical justification
Differential abilities to learn
C R&D activities 1 N/A Classical measure
C Level of adoption of computer- 21 N/A Lefebvre & Lefebvre, 1992
based technologies Lefebvre et al., 1996
C Environmental scanning 5 0.67 Kelley & Brooks, 1991
C Networking 7 0.67 Birley & Westhead, 1990
Attributes of organizational context
C Skilled professionals 1 N/A Classical measure
C Organic culture 6 0.62 Covin & Slevin, 1990
C Participatory decision-making 6 0.80 Kanter, 1983
processes
C HRM practices 8 0.69 Hornsby & Kuratko, 1990
C Training practices 5 0.76 Snell and Dean, 1992
Performance 3 0.79 Collins et al., 1988
Measured by Cronbach alpha coefficient.
Table 2. First level of fit or fit within differential abilities to learn and within attributes of organizational context: descriptive and predictive validity
First cluster analysis1 Second cluster analysis1
Variables Cluster1 p p
n = 541
Cluster 2 Cluster 3 Cluster 4
n = 472 n = 64 n = 37
2
3 4
2
Differential abilities to learn
C R&D activities NS 4.23% 1.97% ***
C Level of adoption of computer-based **** 83.46 52.96 ****
technologies Administrative applications3 35.34 28.10 **** 34.05 28.36 *** Production applications3 54.60 23.92 **** 49.41 24.60 **** C Environmental scanning **** 4.67 3.88 **** C Networking **** 3.73 3.23 *** 3.73% 3.02% 89.93 52.02 5.14 3.50 3.92 3.12
Attributes of organizational context
C Skilled professionals 13.75% 9.18% ** * C Organic culture 5.23 4.83 *** **** C Participatory decision-making 4.77 3.64 **** **** processes C HRM practices 4.76 3.76 **** **** C Training practices 4.50 3.50 **** **** 12.92% 9.38% 5.23 4.72 4.85 3.18 4.68 3.61 4.64 3.02 Performance
C Overall organizational performance 4.35 3.85 ** 4.18 4.01 NS
We consider here only firms that have responded to all of the 63 indicators (table 1). No attempt was made to replace missing values. The
1
sample size drops from 110 firms to 101 firms. Level of significance of t-tests (unilateral tests)
2 NS Not significant * < 0.10 ** < 0.05 *** < 0.01 **** < 0.001
Computer-based applications can be subdivided into administrative and production applications (see appendix 1). Although the cluster
3
analysis was performed on the global score, the information on administrative and production applications serves as an additional validity check.
Legend: Results presented in bold characters allow one to assess descriptive validity whereas results in regular characters allow one to assess predictive validity.
Cluster1 Cluster3 Cluster2 Cluster4 Alignment1 Alignment2 alignment 2 alignment 1
(
n
1=
64
)
n2=47n
1=
54
n
a1=
42
n
ma1=
12
n
a2=
25
n
ma2=
22
(
n
2=
37
)
Table 3. Second level of fit or fit between differential abilities to learn and attributes of organizational context: descriptive and predictive validity
Variables Alignment 1n = 42 Alignment 2n = 25 Misalignment 1n = 12 Misalignment 2n = 22 p
a1 a2 ma1 ma2
1
Differential abilities to learn
C R&D activities 4.07% 1.69% 2.55% 4.54% *** C Level of adoption of 94.88 43.52 72.62 61.67 **** computer-based technologies C Administrative applications 36.20 26.47 32.30 29.94 *** C Production applications 58.68 17.05 40.32 31.73 **** C Environmental scanning 5.19 3.35 4.98 3.67 **** C Networking 3.94 2.93 3.86 3.32 *** Attributes of organizational context C Skilled professionals 13.41% 6.72% 14.93% 11.98% * C Organic culture 5.33 4.65 4.86 5.03 *** C Participatory decision-making 5.08 2.95 3.66 4.41 **** processes C HRM practices 4.95 3.39 4.08 4.17 **** C Training practices 4.82 2.83 3.40 4.29 **** Performance C Overall organizational 4.37 3.82 4.30 3.88 NS performance
Level of significance for the non-parametric ANOVA (Kruskal-Wallis test)
1 NS Not significant * < 0.10 ** < 0.05 *** < 0.01 **** < 0.001
APPENDIX 1: Research questionnaire
All perceptual variables are measured on 7-point likert scales Environmental scanning:
To what extent do you rely on the following procedures to gather information about the performance of your firm? (where 1 = very rarely and 7 = very often)
C Routine gathering of opinions from clients
C Explicit tracking of the policies and tactics of competitors C Developing explicit profiles of sales, of customer preferences C Forecasting of new technologies
C Market research studies for new products or markets Networking:
To what extent do you attend meetings with the following persons? (where 1 = very rarely and 7 = very often)
C With bankers C With consultants
C With customers C With suppliers
C With other CEOs C With government representatives
Organic culture:
To what extent do you agree with the following statements? (where 1 = disagree and 7 = agree) C In this firm, we discuss financial or strategic matters quite freely
C Our executive managers are free to use the operating style of their choice C In this firm, we usually adapt quite easily to important changes
C We favor a certain flexibility in getting things done even if this means disregarding formal procedures C We rely on voluntary cooperation for getting work done rather than formal controls
C We have a strong tendency to let the requirements of the situation and the personality of the individuals define proper on-job behavior
Participative decision-making processes:
To what extent do you rely on the following decision-making mecanisms? (where 1 = very rarely and 7 = very often) C An executive committee
C Meetings with department heads C Quality circles
C Information meetings with all personnel C Workshop or department meetings
APPENDIX 1 (cont'd) Research questionnaire Human management resource practices:
C To what extent do you use the following personnel management practices? (where 1 = very rarely and 7 = very often)
C Organization charts and formal job descriptions C Recruiting by posting job requirements C Interviews and tests for personnel selection C Formal pay scales
C Employee productivity evaluation
C Bonuses, commission and/or profit sharing
C Additional social benefits over and above those required by law C Plans for recycling and/or retraining employees
Training practices:
C To what extent do you use the following manpower training practices? (where 1 = very rarely and 7 = very often) C On the job training
C Period of instruction/probation for new employees C Training sessions organized within the firm C Outside training sessions
C Participation in government manpower training programs Performance:
Performance of your firm compared to that of your most direct competitors (where 1 = below average, 4 = avearage and 7 = above average)
C Average annual rate of growth of sales during the last 3 years C Average annual rate of growth of assets during the last 3 years C Average return on investment during the last 3 years
'
21
i'1ij x rj ij
j rj j
APPENDIX 2
Level of adoption of computer-based technologies
Level of adoption of computer-based technologies = where = 0 or 1 depending on the adoption of innovation , and = degree of radicalness of innovation as established by a panel of 8 experts who ranked each innovation on 7 point Likert scales (the interrater reliability is 0.83).
Computer-based technologies:
Administrative applications: i = Accounts payable/accounts receivable; i = Inventory management; i =1 2 3
Sales analysis; i = Payroll; i = Billing; i = Cost accounting; i = Operations management;4 5 6 7
i = Word processing; i = Electronic mail/electronic filing8 9
Advanced manufacturing technologies: Production Technology i = Computer-assisted design (CAD)10
and/or Computer-assisted engineering (CAE); i = CAD output used to control manufacturing machines11
(CAD/CAM); Fabrication and Assembly: i = Flexible manufacturing cells (FMC) or systems (FMS); i =12 13
Numerical control machines (NC); i = Pick and place robots; i = Other robots. Automated Material14 15
Handling: i = Automated storage and retrieval system (AS/RS); i = Automated guided vehicle system16 17
(AGVS). Automated Sensor-Based Inspection and/or Test Equipment: i = Performed on incoming or in-18
process materials; i = Performed on final product. Communications and Control: i = Inter company19 20
computer network linking plant to subcontractors;
APPENDIX 3
Summary of the discriminant analyses 1. Two group discriminant analysis: cluster 1 vs. cluster 2
Predicted group membership
Actual groups Number of firms Cluster 1 Cluster 2
Cluster 1 54 51 3
94.4% 5.6%
Cluster 2 47 5 42
10.6% 89.4%
Overall classification rate (hit ratio) = 92.8%
Level of significance of the discriminant function: p = 0.0001
2. Two group discriminant analysis: cluster 3 vs. cluster 4
Predicted group membership
Actual groups Number of firms Cluster 3 Cluster 4
Cluster 3 64 59 5
92.2% 7.8%
Cluster 4 37 2 35
5.4% 94.6%
Overall classification rate (hit ratio) = 93.7%
APPENDIX 3 (contd)
3. Two group discriminant analysis: Alignment 1 vs. Alignment 2
Predicted membership
Actual groups Number of firms Alignment 1 Alignment 2
Alignment 1 42 42 0
100% 0%
Alignment 2 25 0 25
0% 100%
Overall classification rate (hit ratio) = 100%
Vous pouvez consulter la liste complète des publications du CIRANO et les publications elles-mêmes sur %%
notre site World Wide Web à l'adresse suivante :
http://www.cirano.umontreal.ca/publication/page1.html
Liste des publications au CIRANO%%%%
Cahiers CIRANO / CIRANO Papers (ISSN 1198-8169)
96c-1 Peut-on créer des emplois en réglementant le temps de travail ? / par Robert Lacroix 95c-2 Anomalies de marché et sélection des titres au Canada / par Richard Guay, Jean-François
L'Her et Jean-Marc Suret
95c-1 La réglementation incitative / par Marcel Boyer
94c-3 L'importance relative des gouvernements : causes, conséquences et organisations alternative / par Claude Montmarquette
94c-2 Commercial Bankruptcy and Financial Reorganization in Canada / par Jocelyn Martel 94c-1 Faire ou faire faire : La perspective de l'économie des organisations / par Michel Patry
Série Scientifique / Scientific Series (ISSN 1198-8177)
96s-32 Technological Learning and Organizational Context: Fit and Performance in SMEs / Élisabeth Lefebvre, Louis A. Lefebvre et Lise Préfontaine
96s-31 Piece Rates, Fixed Wages, and Incentive Effects: Statistical Evidence from Payroll Records / Harry J. Paarsch et Bruce Shearer
96s-30 R&D Spillover and Location Choice under Cournot Rivalry / Ngo Van Long et Antoine Soubeyran
96s-29 Efficient Income Redistribution in a Growing Economy / Gerhard Sorger 96s-28 Wage Flexibility and Contract Structure in Germany / Lars Vilhuber
96s-27 Setting Standards for Credible Compliance and Law Enforcement / Marcel Boyer, Tracy R. Lewis et Wei Len Liu
96s-26 American Options with Stochastic Dividends and Volatility: A Nonparametric Investigation / Mark Broadie, Jérôme Detemple, Eric Ghysels et Olivier Torrès
96s-25 How Did Ontario Pulp and Paper Producers Respond to Effluent Regulations, 1985-89? / Paul Lanoie, Mark Thomas et Joan Fearnley
96s-24 Nonparametric Estimation of American Options Exercise Boundaries and Call Prices / Mark Broadie, Jérôme Detemple, Eric Ghysels et Olivier Torrès
96s-23 Asymmetry in Cournot Duopoly / Lars-Hendrik Röller et Bernard Sinclair-Desgagné 96s-22 Should We Abolish Chapter 11? Evidence from Canada / Timothy C.G. Fisher et Jocelyn
Martel
96s-21 Environmental Auditing in Management Systems and Public Policy / Bernard Sinclair-Desgagné et H. Landis Gabel
96s-20 Arbitrage-Based Pricing When Volatility Is Stochastic / Peter Bossaert, Eric Ghysels et Christian Gouriéroux
96s-19 Kernel Autocorrelogram for Time Deformed Processes / Eric Ghysels, Christian Gouriéroux et Joanna Jasiak
96s-18 A Semi-Parametric Factor Model for Interest Rates / Eric Ghysels et Serena Ng
96s-17 Recent Advances in Numerical Methods for Pricing Derivative Securities / Mark Broadie et Jérôme Detemple