HAL Id: hal-01978784
https://hal.inria.fr/hal-01978784
Submitted on 11 Jan 2019
HAL is a multi-disciplinary open access
archive for the deposit and dissemination of
sci-entific research documents, whether they are
pub-lished or not. The documents may come from
teaching and research institutions in France or
abroad, or from public or private research centers.
L’archive ouverte pluridisciplinaire HAL, est
destinée au dépôt et à la diffusion de documents
scientifiques de niveau recherche, publiés ou non,
émanant des établissements d’enseignement et de
recherche français ou étrangers, des laboratoires
publics ou privés.
Incremental structural summarization of RDF graphs
François Goasdoué, Pawel Guzewicz, Ioana Manolescu
To cite this version:
François Goasdoué, Pawel Guzewicz, Ioana Manolescu. Incremental structural summarization of RDF
graphs. EDBT 2019 - 22nd International Conference on Extending Database Technology, Mar 2019,
Lisbon, Portugal. �hal-01978784�
Incremental structural summarization of RDF graphs
François Goasdoué
Univ Rennes, Inria, CNRS, IRISA France
Paweł Guzewicz
École polytechnique and Inria France
Ioana Manolescu
Inria and École polytechnique France
ABSTRACT
Realizing the full potential of Linked Open Data sharing and reuse is currently limited by the difficulty users have when trying to understand the data modeled within an RDF graph, in order to determine whether or not it may be useful for their need.
We demonstrate our RDFQuotient tool, which builds com-pact summaries of heterogeneous RDF graphs for the purpose of first-sight visualizations. An RDFQuotient summary provides an overview of the complete structure of an RDF graph, while being typically many orders of magnitude smaller, thus can be easily grasped by new users. Our summarization algorithms are time linear in the size of the input graph and incremental: they incrementally update a summary upon addition of new data.
For the demo, we plan to show the visualizations of our sum-maries obtained from well-known synthetic and real data sets. Further, attendees will be able to add data to the summarized RDF graphs and visually witness the incurred changes.
1
INTRODUCTION
Semantic Web graphs are nowadays being published and shared at a massive scale, e.g., Linked Open Data (LOD) Cloud (https: //lod-cloud.net) lists 1.200 graphs, while the LOD Atlas portal (http://lodatlas.lri.fr) references more than 20.000 graphs. Some of these graphs are domain-oriented, that is, they reflect a certain application domain, e.g., education, medical etc. On the contrary, a few RDF graphs are encyclopedic, e.g., DBpedia (https://wiki. dbpedia.org) and YAGO [7], covering many different topics; often, these are unions of many domain-specific ones, e.g., DBpedia is available for download as a set of domain-oriented “datasets”. An overwhelming majority of the RDF graphs found in portals such as LOD Cloud or LODAtlas, https://data.gov.uk, https://data.gov etc. are domain-oriented.
Currently, a large obstacle toward exploiting this wealth of data is the difficulty for human users to make sense of a newly encountered RDF graph. The motivation for our work is to help users learn at first sight, without any prior knowledge about the graph and without having to set any parameter, the (ideally com-plete) structure of a domain-specific RDF graph. Given that RDF graphs can be very large, while the human information absorp-tion capacity is relatively limited, RDF graph summaries have been used as intermediaries: from a given graphG a summary is extracted, then the summary is shown to the users in order to convey information about the structure and/or content ofG.
We demonstrate RDFQuotient, a tool for constructing a com-plete summary of the structure of an RDF graph which does not require any user input. The particular advantage of RDFQuotient is its tolerance to heterogeneity, which enables it to build compact, easy-to-visualize summaries even from very large graphs, while preserving many of the important structural features of the graph.
© 2019 Copyright held by the owner/author(s). Published in Proceedings of the 22nd International Conference on Extending Database Technology (EDBT), March 26-29, 2019, ISBN 978-3-89318-081-3 on OpenProceedings.org.
Distribution of this paper is permitted under the terms of the Creative Commons license CC-by-nc-nd 4.0.
RDFQuotient summaries can be built efficiently, in linear time in the size of the graph. Further, they can be incrementally updated: upon addition of a triplet to a graph G, the summary of G ∪ {t } can be efficiently computed out of the current summary ofG and t, without re-traversing the G triples.
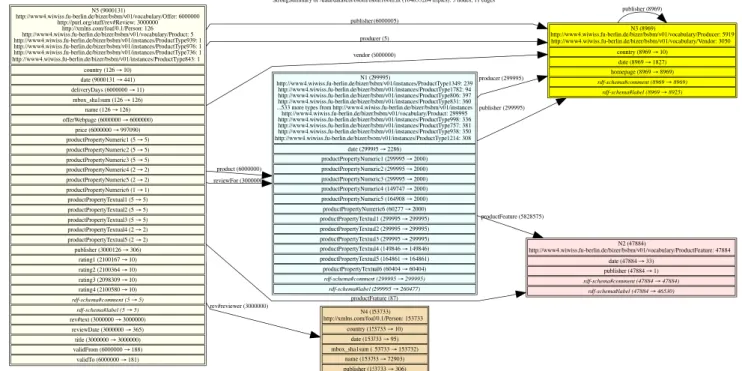
Motivating example Figure 1 illustrates a possible visualization of an RDFQuotient summary of a BSBM [1] benchmark graph of 108triples. This visualization reflects the complete structure of the graph, using only 5 nodes and 11 edges, comparable to a simple small Entity-Relationship diagram. This summary reads as follows: (i) Non-leaf graph nodes belong to one of five disjoint classes, each represented by a summary node (boxes labeledN 1 to N 5 in Figure 1). The number of graph nodes in each class appears in parenthesis after the labelNi of their representative; (ii) Graph nodes from a class may have types. Each such type appears under the summary node label, together with its number of occurrences among graph nodes of that class, e.g., 5919 nodes represented by N 3 are of type Producer, while 3050 are of type Vendor; (iii) Graph nodes from a class may have outgoing properties whose values are leaf nodes in the graph; the set of all such properties appears in the corresponding summary node, one property per line. For each property, e.g. country forN 3, the summary node specifies how many graph nodes represented by this summary node have it (8969 in this case), and how many distinct leaf nodes are target of these edges (10 in this case); (iv) Graph nodes from a class may have outgoing properties whose values are non-leaf nodes in the graph. For each graph edgen1
a
−→n2, wheren1, n2are non-leaf
graph nodes anda is the property (edge label), an a-labeled edge in the summary goes from the representative ofn1to that ofn2.
Next toa, this summary edge is also labeled with the number of graph edges to which it corresponds; (v) Properties from a small, fixed vocabulary are considered metadata (as opposed to data) and therefore they are not used to group nodes in classes, e.g., rdf-schema#-comment and rdf-schema#-label in Figure 1. More such visualizations can be found online1; below, we also work out an example leading from an RDF graph to its summary and then such a visualization.
We propose to demonstrate the incremental construction of four related (but different) summaries, i.e., show how summaries quickly adjust when triples are added to the summarized RDF graphs. Our summaries can be built from graphs where none, some or all nodes have one or more types; this is important because in many synthetic and real-life RDF graphs we studied, a large share of nodes is untyped [3]. Two of our summaries give preeminence to types (when available) to build the summary; nodes are first grouped by types and then by the relationships to other nodes. By contrast, the two other (including the one in Figure 1) give preeminence to node relationships; nodes are first grouped according to their relationships with others, then, each group is typed with the types of the graph nodes it represents within the summary (this is how each type has been attached to a summary node in our figure). In the total absence of types, each
Figure 1: Visualization built from an RDFQuotient summary.
Figure 2: Sample RDF graph.
type-first summary coincides with a type-ignorant one (thus, our four summaries collapse into two).
Below, we define our summaries (Section 2) and summariza-tion algorithms (Secsummariza-tion 3). Then, we present the demonstrasummariza-tion scenario based on summary visualizations (Section 5). Finally, we compare them with related work and we conclude (Section 6).
2
RDFQUOTIENT SUMMARIES
LetU be a set of URIs, L be a set of literals and B be a set of blank nodes as per the RDF specification. An RDF graph G is a set of triples of the form (s,p, o) where s ∈ U ∪ B ∪ L, p ∈ U and o ∈ U ∪ B ∪ L. The special URI type, part of the RDF standard, is used to attach types to nodes. An RDF graph may contain ontology (schema) triples; while there are interesting interactions between summarization and ontologies [3], below we only focus on summarizing the non-schema triples, which make up the vast majority of all RDF graphs we encountered. Thus, we consider G consists exclusively of type triples and/or data triples (all those whose property is not type; we call these data properties).
An RDF equivalence relation denoted ≡ is a binary relation over the nodes of an RDF graph that is reflexive, symmetric and transitive. Given an equivalence relation ≡, an RDF graph quotient is an RDF graph having (i) one node for each equivalence class of nodes; (ii) for each edge n1
a
−→n2, a summary edgen≡1 −→a n≡
2, wheren ≡
i,i ∈ {1, 2}, is the summary node corresponding
to the equivalence class ofni, also called representative ofni.
The literature comprises many quotient graph summaries (see Section 6), which differ by their equivalence relations.
The equivalence relations we use are based on the concept of property cliques, which encodes a transitive relation of edge co-occurrence on graph nodes. Given an RDF graph G, two data propertiesp1, p2are in the same source clique iff: (i) there exists
a G noden which is the source of p1andp2(i.e., (n,p1, x) ∈ G and
(n,p2,y) ∈ G for some x and y), or (ii) there exists a data property p3such thatp3is in the same source clique asp1, andp3is in the
same source clique asp2. Symetrically,p1andp2are in the same
target clique if there exists aG node which is the target of p1
andp2, or a data propertyp3which is in the same target clique
asp1andp2. In Figure 2, the properties advises and teaches are in
the same source clique due top4. The same holds for advises and
wrote due top1; consequently, advises and wrote are also in the
same source clique. Further, the graduate studentp2teaches a
course and takes another, thus teaches, advises, wrote and takes are all part of the same source clique. In this example,p1,p2,p3,p4,
p5have the source cliqueSC1= {advises, takes, teaches, wrote}, c1,
c2,c3have the source cliqueSC2= {coursedescr} and a1,a2have
the empty source cliqueSC3= ∅. Similarly, the target cliques are,
respectively;TC1= {advises} for p2, p5,TC2= {teaches, takes}
forc1,c2,c3,TC3= {coursedescr} for d1, d2,TC4= {wrote} for
a1, a2andTC5= ∅ for p1, p3, p4.
It is easy to see that the set of non-empty source (or target) cliques is a partition over the data properties of an RDF graph G. Further, if a G noden is source of some data properties, they are all in the same source clique; similarly, all the properties of which n is a target are in the same target clique. Based on these cliques, for any nodesn1, n2of G, we define:
•n1 is weakly equivalent ton2, denotedn1 ≡W n2, iff
n1, n2 have the same source clique or the same target
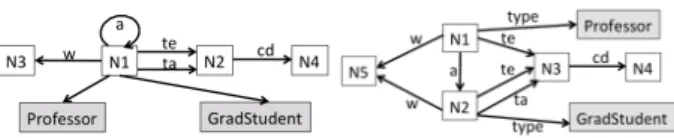
Figure 3: Weak (left) and strong (right) graph summary. •n1is strongly equivalent ton2, denotedn1 ≡S n2, iff
n1, n2have the same source clique and the same target
clique.
Further, we decide that in any RDF equivalence relation, any class node, i.e., a URIc appearing in a triple of the form (n, type, c), is (i) only equivalent to itself and (ii) represented by itself in any RDFQuotient summary. This ensures that RDF types (classes), which (when present) denote an important information that data producers added to help understand their RDF graphs, are pre-served in the summary.
The equivalence relations ≡Wand ≡Slead to the weak,
respec-tively strong summaries, defined as quotients of G through ≡W,
denoted G/≡W, respectively, through ≡S, denoted G/≡S. Figure 3
illustrates these on the sample graph in Figure 2. For brevity, in Figure 3 and from now on, we usea, w, te, ta, cd to denote respectively the properties advises, writes, teaches, takes, and coursedescr.
In G/≡W,N1represents all the people (p1top5),N2represents
the courses,N3the articles andN4the course descriptions. Note
the self-loop fromN1to itself; it denotes that some nodes
repre-sented byN1advise some nodes represented byN1. This summary
has only 4 nodes and 5 edges. It conveys the essential informa-tion that some nodes advise, write, also they teach and take something that has course descriptions. The Professor and Grad-Student types of nodesp1, respectivelyp2, are attached to their
common representativeN1.
G/≡S differs from G/≡W by representing the person nodes in
two separate groups: those represented byN1advise those
rep-resented byN2. This is because the target clique ofp1,p3andp4
is empty, while the target clique ofp2andp5is {advises}. This
example illustrates the fact (visible from the summary defini-tions) that G/≡S summarizes at finer granularity than G/≡W (or,
equivalently, ≡Sentails ≡W, but the opposite does not hold).
Clique-based structural summarization leads to compact summaries even in graphs with heterogeneous structure. This is because of the transitive aspect of the property cliques. For example,p1andp3have the same source clique, even though
their property sets are disjoint: {a, w} for p1, {te} for p3; they are
in the same source clique e.g. due top4, which has botha and te.
In contrast, previously studied quotient summaries, in particular those aimed for indexing and query optimization, would not ac-ceptp1andp3as equivalent; in general, such summaries lead to
more equivalence classes (summary nodes), thus also summary edges, making summaries hard to understand visually.
Type-first summarization The weak and strong summary group nodes according to their incoming/outgoing data triples and then just “carry” their types to the summary. A different choice is to group nodes first by their set of types (if any)2, and use the data triples to group the nodes without types. We define:
•n1is typed-weak equivalent ton2, notedn1≡TWn2, iff
(i) n1, n2have the same non-empty set of types or (ii) both
n1, n2are untyped, andn1≡Wn2;
2We use set of types and not just “type” on purpose, because an RDF node may have more than one type. If we classified a node according to each of its types, as in e.g. [2], a node with many types would have more than one representative, which is incompatible with quotient summarization.
Figure 4: Typed weak graph summary.
•n1is typed-strong equivalent ton2, notedn1≡TSn2, iff
(i) n1, n2have the same non-empty set of types or (ii) both
n1, n2are untyped, andn1≡Sn2.
These relations lead to the typed weak (G/≡TW), respectively,
to the typed strong (G/≡TS) RDFQuotient summaries. Figure 4
illustrates typed weak summarization on our sample graph; on this simple example, G/≡TSis identical (in general, it may differ).
3
BUILDING RDFQUOTIENT SUMMARIES
We have devised algorithms which build G/≡W, G/≡S, G/≡TW and
G/≡TS through a single traversal of an RDF graph G, in two
fla-vors: (i) global: traverse G, compute all the cliques, then traverse it again and represent nodes according to their cliques and/or types; (ii) incremental: in a single traversal of G, gradually build each source and target clique based on the triples traversed up to that point and simultaneously represent G nodes in a summary that is continuously updated; after traversing the last triple of G, each incremental summarization algorithm ends up with the respective summary of the full G. The algorithms are detailed and their correctness is proved in [3]; below, we illustrate their interesting points on minimal examples.
p1 p2 a1 a w p4 c2 te ⇒ a w te p1 p2 a1 a w p4 c2 p5 te a ⇒ a w te
First, let us see on an example how ≡Wcan grow during
in-cremental weak summarization. Suppose the graph G in Figure 2 is traversed and summarized starting with: (p1advises p2), then
(p1wrote a1), then (p4teaches c2) (see the figure above). When we summarize this third triple, we do not know yet thatp1is
equivalent top4, because no common source ofteaches and
advises (e.g., p3orp4) has been seen so far. Thus,p4is so far not
equivalent to any other node, and represented separately from p1. Now, assume the fourth triple traversed is (p4advises p5):
at this point, we know thatadvises, wrote and teaches are in the same source clique, thusp1≡Wp4, and their representatives
(highlighted in yellow) must be fused in the summary. More generally, it can be shown that ≡Wonly grows as more triples
are visited (i.e., is monotonic), in other words: if in a subset G′ of G’s triples, two nodesn1, n2are weakly equivalent, then this
holds in any G′′with G′⊆ G′′⊆ G.
Incremental strong summarization is even more complex be-cause unlike ≡W, ≡S may grow and shrink during
summa-rization (i.e., is non-monotonic). For instance, assume the sum-marization of the graph in Figure 2 starts with (p1wrote a1),
(p2wrote a2), (p2takes c2) (see the figure below). After these, we
knowp1≡Sp2; their source clique is {wrote, takes} and their
tar-get clique is ∅. Assume the next triple traversed is (p3advises p2):
at this point,p1is not ≡Stop2any more, becausep2’s target clique
is now {advises} instead of ∅. Thus, p2splits fromp1, that is,
it needs to be represented by a new summary node (shown in yellow below), distinct from the representative ofp1.
p1 a1 w p2 a2 c2 w ta ⇒ w ta p1 a1 w p2 a2 c2 p3 w ta a ⇒ w w ta a
Further, note that the representative ofp1andp2(at left above)
had onetakes edge (highlighted in red) which was solely due to p2’s outgoingtakes edge. By definition of a quotient summary,
that edge moves from the old to the new representative ofp2(the
yellow node). If, above at left,p1had also had an outgoing edge
labeledtakes, at right, both nodes in the top row would have had an outgoingtakes edge. It can be shown that splits only occur in such cases, i.e., a node whose target clique becomes non-empty (respectively whose source clique becomes non-empty) and the node was previously represented together with other nodes; if it was represented alone, the respective clique of its representative is just updated.
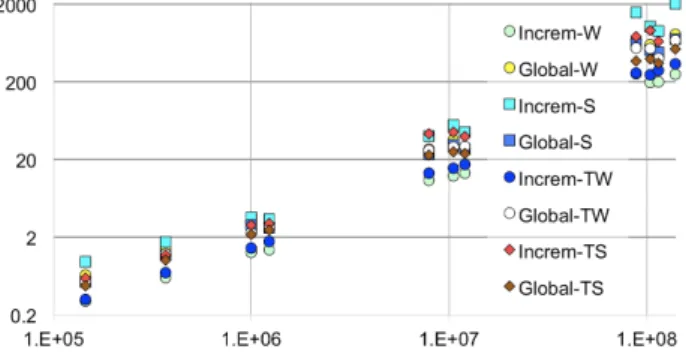
Figure 5: Summarization time (s) vs. graph sizes |G|. The amortized complexity of our summarization algorithms is linear in the number of triples of G. Figure 5 illustrate this empirically on a variety of benchmark (LUBM and BSBM) and real-life (DBLP, Springer conference etc.) datasets ranging from a few hundred thousands to more than 100 million triples; note that both axes are in log-scale. The implementation is made in Java 1.8; RDF graphs are stored in Postgres 9.6 and traversed from there. Increm-W is the fastest overall; it traverses G only once, thus it is faster than global-W which performs one extra pass to compute the cliques. S, TW and TS, in this order, are more expensive, and finally incremental S, which pays an extra performance overhead for growing and shrinking the equivalence relation.
4
FROM SUMMARIES TO VIZUALIZATIONS
The core of our work is on defining and efficiently building sum-maries; here we present one possible way of rendering them through a vizualization like the one illustrated in Figure 1.
On our four summaries we apply leaf and type inlining, as follows. We remove type edges; instead, each type attached to a node in the summary is shown in the box corresponding to the node, after the node ID. Similarly, for each edgen−→a m where m is a leaf, we includea as an “attribute” of n, and do not render m (we say it has been “inlined” within n). A sizable part of an RDF graph’s nodes are leaves; as we will show, inlining them into their parent nodes greatly simplifies the visualization.
Figure 6: Leaf and type inlining on the sample strong sum-mary from Figure 3 (right).
Figure 6 illustrates inlining for the S summary of our sam-ple graph. This summary is extremely compact, yet rich with information; professors, students, and courses are visible at a glance. Articles have been inlined within their authors as they were leaves in G/≡TS(Figure 3). This simplification can also be
seen as a small loss of information: Figure 6 does not immedi-ately suggest that Professors may have written articles together with GradStudents. However, (i) only leaf nodes are folded and (ii) after a first glance, users may pursue exploration by other means (e.g., queries to check for such joint articles).
5
DEMONSTRATION SCENARIO
Demonstration attendees will be able to pick an RDF graph from a list of well-known synthetic and real data sets, visualize their summaries, and compare with other close competitor summaries, such as those mentioned in Section 6; some of these vizualiza-tions can be seen online (https://team.inria.fr/cedar/projects/ rdfquotient/). Attendees will also be able to add new triples to an RDF graph, to figure out through our summary visualization how changes in the original data are rapidly reflected into the summary thanks to incremental summarization. To make it en-tertaining, we plan to use RDF data on the conference attendees, from DBLP, other public sources, and made-up triples to get interesting summary changes.
6
RELATED WORK & CONCLUSION
The literature comprises many RDF summarization techniques, more than a hundred of which we covered in a recent co-authored survey [4]. RDFQuotient summarizes the structure of the data triples, which form a vast majority of RDF graphs; complemen-tary proposals summarize the ontology, the values, find the most frequent property groups etc. Closest to us are quotient sum-maries which group nodes by the set of their outgoing data prop-erties (“characteristic sets” [6]) and possibly also by by the set of their incoming data properties (forward and backward bisimula-tion [5]). Our clique-based summarizabisimula-tion differs from these by the transitive aspect of the cliques which leads to heterogeneity-tolerant summarization. Indeed, as we plan to show during our demonstrations, more strict summaries such as [5, 6] support query optimization and indexing well, but have too many nodes and edges, even after inlining, for a comfortable vizualization. In exchange, our summaries are not generally appropriate for indexing, as they do not give e.g. access to “all the resources having propertiesa and b”: the graph nodes whose source clique is {a,b} may have one or another or both.
REFERENCES
[1] Christian Bizer and Andreas Schultz. 2009. The Berlin SPARQL Benchmark. Int. J. Semantic Web Inf. Syst. 5, 2 (2009).
[2] Stéphane Campinas, Renaud Delbru, and Giovanni Tummarello. 2013. Efficiency and precision trade-offs in graph summary algorithms. In IDEAS.
[3] Šejla Čebirić, François Goasdoué, Paweł Guzewicz, and Ioana Manolescu. 2017. Compact Summaries of Rich Heterogeneous Graphs. Research Report RR-8920. INRIA Saclay ; Université Rennes 1. https://hal.inria.fr/hal-01325900 [4] Sejla Cebiric, François Goasdoué, Haridimos Kondylakis, Dimitris Kotzinos,
Ioana Manolescu, Georgia Troullinou, and Mussab Zneika. 2018. Summarizing Semantic Graphs: A Survey. The VLDB Journal (2018). https://hal.inria.fr/ hal-01925496
[5] Raghav Kaushik, Philip Bohannon, Jeffrey F. Naughton, and Henry F. Korth. 2002. Covering indexes for branching path queries. In SIGMOD.
[6] Thomas Neumann and Guido Moerkotte. 2011. Characteristic sets: Accurate cardinality estimation for RDF queries with multiple joins. In ICDE. [7] Thomas Rebele, Fabian M. Suchanek, Johannes Hoffart, Joanna Biega, Erdal
Kuzey, and Gerhard Weikum. 2016. YAGO: A Multilingual Knowledge Base from Wikipedia, Wordnet, and Geonames. In ISWC.