HAL Id: hal-01637123
https://hal.archives-ouvertes.fr/hal-01637123
Submitted on 23 Mar 2018
HAL is a multi-disciplinary open access
archive for the deposit and dissemination of
sci-entific research documents, whether they are
pub-lished or not. The documents may come from
teaching and research institutions in France or
abroad, or from public or private research centers.
L’archive ouverte pluridisciplinaire HAL, est
destinée au dépôt et à la diffusion de documents
scientifiques de niveau recherche, publiés ou non,
émanant des établissements d’enseignement et de
recherche français ou étrangers, des laboratoires
publics ou privés.
Biomass gasification under high solar heat flux:
Advanced modelling
Victor Pozzobon, Sylvain Salvador, Jean-Jacques Bézian
To cite this version:
Victor Pozzobon, Sylvain Salvador, Jean-Jacques Bézian. Biomass gasification under high solar heat
flux: Advanced modelling. Fuel, Elsevier, 2018, 214, p.300-313. �10.1016/j.fuel.2017.10.011�.
�hal-01637123�
Biomass gasification under high solar heat flux: Advanced modelling
Victor Pozzobon
⁎, Sylvain Salvador, Jean Jacques Bézian
Université de Toulouse, Mines Albi, Centre RAPSODEE, UMR CNRS 5302, Campus Jarlard, route de Teillet, 81013 Albi CT Cedex 09, France
Keywords: Solar power Biomass Pyrolysis Gasification Modelling Moving mesh Radiation penetration
A B S T R A C T
This article presents a new numerical model describing the behaviour of a thermally thick wood sample exposed to high solar heat flux (above 1 MW/m2). A preliminary study based on dimensionless numbers is used to classify
the problem and support model building assumptions. Then, a model based on mass, momentum and energy balance equations is proposed. These equations are coupled with liquid-vapour drying model and pseudo species biomass degradation model. By comparing to a former experimental study, preliminary results have shown that these equations are not enough to accurately predict biomass behaviour under high solar heat flux. Indeed, a char layer acting as radiative shield forms on the sample exposed surface. In addition to this classical set of equations, it is mandatory to take into account radiation penetration into the medium. Furthermore, as biomass contains water, medium deformation consecutively to char steam gasification must also be implemented. Finally, with the addition of these two strategies, the model is able to properly capture the degradation of biomass when exposed to high radiative heat flux over a range of sample initial moisture content. Additional insights of bio-mass behaviour under high solar heat flux were also derived. Drying, pyrolysis and gasification fronts are present at the same time inside of the sample. The coexistence of these three thermochemical fronts leads to char gasification by the steam produced from drying of the sample, which it is the main phenomenon behind medium ablation.
1. Introduction
World primary energy consumption has dramatically grown over the last thirty years, from 7.14 Gtoe (Giga ton of oil equivalent) in 1980 to 13.2 Gtoe in 2012[1]. This increase heavily rested upon fossil fuels (oil, coal and natural gas) and led to the emission of important quan-tities of green house effect gases in the atmosphere[2]. In turn, these gases induced global warming and climate change[3]. To stop them, mankind reliance on fossil fuel has to decrease in favour of renewable energy sources.
Among the candidates, the combination of biomass pyro-gasifica-tion and concentrated solar energy is of interest. Indeed, a synergy of these two energy sources can be envisioned. Biomass pyro-gasification allows to produce carbon neutral syngas (H2 and CO). Yet, it is an
highly endothermic process which is classically powered by burning a fraction of the fed biomass. This technique induces two main draw-backs: the efficiency with respect to the biomass is lowered and the produced syngas is diluted by N2from the combustion air[4,5].
Con-centrated solar energy can be used to supply the required heat. The produced syngas could therefore be considered as a new vector of solar energy. It would also allow to avoid the biomass combustion associated drawbacks. Economical assessments have shown the potential viability
of this approach [6], while technical studies have aimed at under-standing and increasing the efficiency of solar gasification reactors
[7–12,5,13,14,5,15,10,16,17].
Until recently, studies mainly focused on reactor scale experiments and reactor modeling. These studies have yielded valuable insights on the design of the reactors[10,13,18,14,19,15,16,20,17,21]and the po-tentialities of the technology. Yet, they do not permit better under-standing of biomass and solar power interaction. Only few studies have dealt with direct interaction of solar energy and biomass. Furthermore, they were restricted to solar pyrolysis[22–24]. In this context, modelling of the whole solar biomass pyro-gasification process can be of help.
Modelling such a process is challenging because several phenomena are at stake during biomass solar pyro-gasification. Biomass degrada-tion starts around 100 °C with the drying of the feedstock[25]. During this stage, water evaporates from the biomass, leaving dry wood. Then, pyrolysis takes place around 500 °C. This complex process turns dry biomass into three broad categories of products: light gases, tars (a mixture of more than 300 molecules[26]) and char[27]. The last stage is char gasification. At temperatures around 800 °C, steam – and to a lesser extend CO2 – can oxidise char and transform it into syngas.
Furthermore, this level of temperature also enables tar thermal cracking
[28]and tar steam reforming[29].
⁎Corresponding author.
E-mail address:victor.pozzobon@mines-albi.fr(V. Pozzobon).
In a previous work[30], solar pyro-gasification of thermally thick wood samples was conducted experimentally. Beech wood cylinders (10 cm diameter, 5 cm high) were directly exposed to radiative heat flux above 1 MW/m2. The influence of two parameters was questioned: sample initial moisture content and wood fiber orientation with respect to the incident heat flux. The importance of biomass initial moisture content was emphasized while wood fibers orientation was shown to have little impact on biomass behaviour under high solar heat flux. Furthermore, this study has highlighted the potential couplings be-tween different stages of biomass degradation, especially drying and char steam gasification. Finally, this study showed that sample geo-metry dramatically evolved during a run.
In the present work, modelling of the solar pyro-gasification of beech samples under the very same conditions is undertaken. In the first part of this article we show that conventional modelling approach is not
able to capture the experimentally observed behaviour. The aim of this work is to enrich this conventional approach so that it can provide proper results. In order to do so, two advanced modelling strategies have to be implemented: moving mesh and radiation penetration inside of the medium. The model predictions are then validated against the experimental results obtained in[30]. Once the validity of the model has been established, its predictions are used to derive further insights on biomass behaviour under high solar heat flux.
2. Experimental device
The experimental device used to investigate solar pyro-gasification of thermally thick wood samples is extensively described in[30], only the main features are recalled here. It is made of an artificial sun pro-ducing heat flux above 1 MW/m2(1000 suns) and a reaction chamber
Nomenclature Latin symbols
A frequency factor, 1/s
a pyrolysis water production factor, – Bi Biot number, –
b pyrolysis char production correction factor, –
cp specific heat capacity, J/kg/K
D diffusivity, m2/s
d diameter, m
DaIII Damköhler III number, –
Ea activation energy, J/mol g gravity acceleration, m/s2
h convective heat transfer coefficient, W/m2/K kB Boltzmann constant, J/K
k reaction rate coefficient, 1/s L characteristic length, m M molar mass, g/mol P power, W Pe Péclet number, – p pressure, Pa
Q volume heat source, W/m3
q relative permeability, – r radius, m
R ideal gas constant, J/mol/K
Re Reynolds number, –
S pore liquid water saturation, – T temperature, K t time, s u velocity, m/s Y mass fraction, – z height, m Greek symbols α absorptivity, – h ∆ reaction heat, J/kg δ difference symbol, – ∊ emissivity, – ζ porosity, – κ permeability, m2 λ thermal conductivity, W/m/K
µ dynamic viscosity, Pa.s
ν stoechiometric coefficient, –
ξ radiation penetration coefficient, –
ρ density, kg/m3
σ Stefan–Boltzmann constant, W/m2/K4
ϕ incident heat flux, W/m2
Ψ radiative heat loss function, W/m2 ω reaction rate, kg/m3/s Subscripts benzene benzene bulk bulk bw bound water cap capillary char char eff effective fs focal spot g gas phase gasi gasification
I gaseous species index ini initial
is intermediate solid J solid species index K reaction index long longitudinal lw liquid water pen penetration pore pore pyro pyrolysis s solid phase sat saturation sp sample steam steam sur surrounding water water wood wood Superscripts
M total number of solid specie N total number of gaseous specie O total number of reaction Other symbols
. scalar product
A vector and matrix notation
n normal vector, – ∇ nabla operator, 1/m
∏ product
∑ sum
(Fig. 1). During a run, the beech wood sample is placed in the chamber while being exposed to the incident heat flux. The experimental device allow to monitor several quantities: sample mass loss, produced light gas, tar and char masses, sample surface temperature. Experimental heat and mass balance show good closure. Two main parameters were varied during this study: initial moisture content and fiber orientation. These experiments provide both qualitative (sample cut views) and quantitative (species production rates) observations which will be used to validate the model predictions. The main conclusion of the experi-mental investigations are:
•
under high radiative heat flux, sample geometry evolves dramati-cally during a run•
wood sample fiber orientation has only a minor effect on the sample behavior•
sample initial moisture content is a key parameter that controls thermally thick samples solar pyro-gasification3. Dimensionless numbers and assumptions
First, dimensionless numbers were calculated. This approach suc-cessfully used in the literature to assess for the validity of assumptions
[31–33]. They are calculated based on experimentally reported values or on classical values found in literature (Table 1). Biot number is greater than 1 (Eq. (1)). Damköhler III numbers were calculated for pyrolysis and gasification (Eq.(2) and (3)). Both of them are greater than 1. Combined with Biot number value, one can expect the presence of chemical fronts induced by thermal inhomogeneity for both pyrolysis and gasification. = = Bi λϕLspδT 357 wood (1) = = DaIII pyro k ρ ϕ∆h L 75
pyro wood pyro sp ,
(2)
= =
DaIII gasi k ρ ϕ∆h L 170
gasi char gasi sp ,
(3) In addition, pore Reynolds number was calculated (Eq. (4)). Its highest value is around 1, when evaluated in the most unfavourable case. Darcy’s law can therefore be used to derive gas phase velocity with no need for inertial correction[34,35].
= u =
Repore ρg‖ ‖µg dpore 1.2
g (4)
Pore thermal Péclet was also calculated (Eq.(5)). Its value is below 1. This has two main consequences: dispersive regime can be ignored
[36]and local thermal equilibrium can be considered as achieved in the medium[37,38]. Therefore, a single temperature field can be used to describe solid and gas phase temperatures.
= u =
Pepore ζρ cg p‖ ‖λg dpore 0.52
g g
(5) Knudsen number was calculated for different conditions: wood at room temperature and char at 2000 K. The maximum value is far below 0.01 (Eq.(6)). It is therefore possible to use continuum mechanics laws to describe the problem and neglect Knudsen diffusion.
= = −
Kn 2πdk TB pd 4.0 10
benzene2 pore
3
(6) Based on the different dimensionless numbers values, a schematic diagram of the sample during its degradation can be drawn (Fig. 2). Drying, pyrolysis and gasification take place at different depths inside of the sample. The gases they produce escape the porous medium though a high temperature char layer. Now that first insights on the sample behaviour have been gained, assumptions can be drawn in order to build the numerical model. Most of them are classical assumptions used to model transport in porous medium; others are more specific to biomass degradation:
•
wood and char are considered as anisotropic homogeneous porous media•
only end grain samples (fibers parallel to the incident heat fluxFig. 1. Schematic of the reaction chamber. 1: ni-trogen inlet, 2: porous medium, 3: sample, 4: in-cident heat flux, 5: quartz window, 6: tar con-densing device, 7: cotton trap, 8: insulating material[30].
Table 1
Physical properties used for dimensionless numbers calculations.
Symbol Property Value Dimension
cpg Gas phase heat capacity 1004 J/kg/K
dbenzene Benzene molecule diameter[70] 5.27 A˚
dpore Pore diameter 55.3 µm
kB Boltzmann constant 1.380 10−23 J/K
kgasi Gasification reaction rate at 800 °C 2.0 10−4 1/s
kpyro Pyrolysis reaction rate at 400 °C 6.2 10−3 1/s
Lsp Sample characteristic length 0.05 m
p Pressure 101325 Pa
u
‖ ‖g Gas phase Darcy’s velocity magnitude
(Computed as‖ ‖ug =κcharµg Lsp∆p) 0.33 m/s h
∆ gasi Gasification reaction heat 1093.5 kJ/kg
h
∆ pyro Pyrolysis reaction heat 80 kJ/kg
p
∆ Maximal internal overpressure[71] 30000 Pa
δT Characteristic temperature difference 1500 K
ζ porosity 0.61 –
κchar Char permeability[54] 1.0 10−11 m2
λg Gas phase thermal conductivity 0.026 W/m/K
λwood Sample thermal conductivity 0.1 W/m/K
µg Gas phase viscosity 1.8 10−5 Pa.s
ρchar Char density 85 kg/m3
ρg Gas phase density 1.2 kg/m3
ρwood Wood density 579 kg/m3
direction) are considered. They are modelled using a 2D ax-isymmetrical geometry. It is made possible because wood radial and orthoradial physical properties values are close
•
Darcy’s law is used to derive gas phase velocity. This assumption is backed up by pore Reynolds number value•
a single temperature is used to describe solid and gas phase tem-peratures. This simplification is supported by pore thermal Péclet number value•
dispersive regimes are ignored, which is defended by pore thermal Péclet number value•
gases are assumed as ideal•
drying is described using a liquid–vapour equilibrium model•
pyrolysis is described using a pseudo-species model•
nine different species are considered: wood, gas, tar, refractory tar, intermediate solid, char, water, steam and air•
ash, whose content is smaller than 1 %wt, is not considered, neither for their potential catalytic effect nor their reflective properties•
model molecules are used to set the physical properties of the dif-ferent gaseous species: benzene is used as model molecule for tar, carbon monoxide for gas and nitrogen for air•
reaction heats are assumed to be constant even though temperature increases•
wood and char are assumed to be gray and diffuse materials, meaning that their emissivities equals their absorptivities4. Classical numerical model
The model is built around the three main equations: mass, mo-mentum and heat conservations.
4.1. Computational domain
The sample cylinder shape was reduced to wedge under the as-sumption that it can be modelled as 2D axisymmetrical (Fig. 3). It is only possible because a special care was taken experimentally in en-suring that the samples fibers were parallel to the incident heat flux
[30].
The sample is exposed to the incident heat flux on its top boundary. The top boundary also allows the gas phase to escape the medium. Side and bottom boundaries are adiabatic gas outlets.
The mesh is made of regular prismal and tetrahedral cells. A mesh convergence study was led. It demonstrated that 4440 cells is the op-timum.
4.2. Governing equations 4.2.1. Mass balance
Solid species are immobile. They are governed by classical balance equations (Eq.(7)):
∑
∂ ∂ = = ρ tJ K ν ω O J K K 1 , (7)Gaseous species move through convection and diffusion. They are governed by classical convection–diffusion equations (Eq.(8)):
∑
∂ ∂ + ∇ u = −∇ − D q ∇ + = ζρ Y t . (ρ gY) . ( ρ s g Y) ν ω g I g I g I K O I K K 1 , (8)The sample boundaries considered as purely convective outlets (Eq.
(9)).
∇ =YI 0 (9)
Initial wood and water densities are set as measured in[30]. One should note that for convenience reasons,Ysteam ini, is calculated by the
model. Species initial values are summed up inTable 2. = =
ρ r z tJ( , , 0) ρJ ini, (10)
= =
Y r z tI( , , 0) YI ini, (11)
4.2.2. Momentum balance
Gas flow through the sample is described using continuity (Eq.(12)) combined with ideal gas assumption and Darcy’s law.
Fig. 2. Schematic view of the sample during its degradation.
∑
∂ ∂ + ∇ u = = ζρ tg . (ρg g) ω K O K 1 (12)The gas is assumed to behave as an ideal gas, thus its density can be expressed as:
=
ρg pMRTg (13)
Combining Eq.(12) and (13), we obtain Eq.(14):
∑
∂ ∂ + ∇ u = = ζM Tg pt . (ρg g) ω K O K 1 R (14) = − ∇ − ug κ qµg g( p ρg) g g (15)Then, combining Eq.(14) and (15), we obtain Eq.(16):
∑
∂ ∂ −∇ ⎛⎝⎜ ∇ − ⎞⎠⎟ = = κ q g ζM T pt . ρ ζµg g( p ρ ) ω g g g g K O K 1 R (16)The sample boundaries are considered as outlets at atmospheric pressure (Eq.(17)).
=
p 101325 Pa (17)
Initially, the pressure inside of the sample is equal to the atmo-spheric pressure (Eq.(18)).
= =
p r z t( , , 0) 101325 Pa (18)
4.2.3. Heat balance
Temperature inside of the medium is governed by Eq.(19). It takes into account: heat convection, conduction, radiation with a special formulation ofλeff, heat sources and sinks associated with the medium
transformation and heat transported by mass diffusive flux.
∑
∑
+ + + + ∇ + ∇ = − ∇ − ∇ + + + ∂ ∂ = = u u λ D q D c ρ ζc ρ c ρ ρ c ρ T c ρ T T ω h c ρ Y c ρ ( ( )) . ( ) . ( ) . ( ) ∆ ∆ ∆ lw g eff s g bw p s p g p lw bw Tt p lw p g K O K K I N p g I p bw 1 1 s g lw lw g g lw (19) Properly predicting temperature is important because it has an impact on biomass degradation rate and thus on the global behaviour of the model. Therefore, a special care was taken in selecting the medium thermal conductivity model. A wide variety of model exists, ranging from simple classical weighted average estimation [39] to complex consideration on wood pore structure[40]. It was chosen to rely on the most advanced model (Eq.(20) [41]), which is a modified version of Saastamoinen and Richard model, in order to include high temperature char thermal conductivity measurements.= ⎛ ⎝ ⎜ ⎜ ⎜ ⎜ − + − + ⎞ ⎠ ⎟ ⎟ ⎟ ⎟ + + − − λ ζ λ ζ (1 ) 0 0 (1 ) eff s ζ λ ζ 2/3 2/3 1.9 ζ λs ζλg s ζ λs ζλg 2/3 (1 1/3) 2 1/3 2/3 (1 1/3) 21.9 1/3 (20) The temperature top boundary condition accounts for radiative heating, as well as radiative and convective losses (Eq. (21)). The convective heat loss coefficient was chosen as h = 7.0 W/m2/K based
on the experimental conditions reported in[30,42]. The incident heat fluxϕ r z( , ) was set according to experimental measurements[43]. Even though the incident heat flux distribution exhibits a Gaussian shape (peak flux: 1072 kW/m2, diameter: 4 cm), it was chosen not to fit it and
work with actual experimental data.
−n. (−λeff.∇ = −T) α ϕ r z σ α Ts ( , )− ( s sur4 −∊sT4) (−h Tsur−T) (21) Side and bottom boundaries are considered as adiabatic (Eq.(22)).
∇ =T 0 (22)
Initially, the temperature is the ambient temperature throughout the sample (Eq.(23)).
= = °
T r z t( , , 0) 20 C (23)
4.3. Submodels 4.3.1. Drying model
During a run, water vaporises and moves throughout the sample. Some of the produced steam travels to colder area where it could condense. It was thought that thermal models and Arrhenius type models would be too simplistic to accurately describe these phenomena
[44–48]. Drying was therefore modelled using liquid–vapour equili-brium featuring liquid, bound water and steam transport. This model is extensively described in[49]. Only its main features will be described here.
The liquid–vapour equilibrium was described using Eq.(24) [49]:
= + − − + −
psat exp(7.3649 101 7.2582 10 7.3037log( ) 4.1653 10 )T T T
3
6 2
(24) Water motion throughout the sample can be divided into bound water diffusion (according to the diffusion coefficientDbw) and liquid
water convection under liquid pressure gradient (Eq.(25), withδpcapthe
capillary pressure drop). = − ∇ − −
ulw κlw lwµq ( (p δp ) ρ g)
lw cap lw (25)
where q is the relative permeability tensor (Eq.(26) and (27)). It takes into account the fact that when a pore is full of water (S 1), the gas= permeability tends toward 0.
⎜ ⎟ = ⎛ ⎝ + − + − ⎞⎠ q S S S S 1 (4 5) 0 0 1 (2 3) g 4 2 (26) = ⎛ ⎝ ⎞⎠ qlw S0 S0 3 8 (27)
4.3.2. Pyrolysis and gasification model
Pyrolysis takes place from 400 °C to 800 °C. During this transfor-mation, the dry biomass polymers are broken down into a solid carbon residue called char and more than 300 different molecules[26]. These molecules can be sorted into two categories. Light gases (or simply gas) appellation covers the light hydrocarbons that remains gaseous at am-bient temperature, usually from H2 to C3H8. Tar encompass the
re-maining molecules that are gaseous at pyrolysis temperature, but liquid at room temperature. The proportions and compositions of these three
Table 2
Solid, liquid and gaseous phases initial conditions. a: 0%wb, b: 9%wb, c: 55%wb.
Species Initial density (kg/m3) Initial mass fraction
Wood 652a,579b,535c – Water 0a,57b,654c – Intermediate solid 0 – Char 0 – Gas – 0 Tar – 0 Refractory tar – 0
Steam – Model calculated
products can vary depending on the pyrolysis conditions, for instance reported char yields range from 7 to 50%[50,9]. The three main factors influencing pyrolysis products distribution are: the pyrolysis final temperature and heating rate and biomass initial composition
[51,52,27,53–55,26,56].
Three alternatives are available to describe wood degradation: pseudo-species models [52,57], cellulose, hemicellulose and lignin models [58] and Ranzi model [59]. Among them, the last option seemed over qualified for the task at hand. Indeed, given the un-certainty associated with medium physical properties, the quality of their predictions would be hindered by slight misprediction of the temperature field and species transport. Between, the two first options, it was chosen to resort to comparison led in literature[57]which ad-vised a pseudo-species model.
Pyrolysis is described using a pseudo-species model which is the combination of existing models (Fig. 4,Tables 3–5). One should note that even if the degradation model components were chosen with care, it was not possible to find in literature kinetic parameters derived for our conditions, i.e. around 250 K/min heating rate and high final temperature. The closest available kinetic parameters were therefore chosen[60,61,57,62]. These parameters have been validated against 50 to 100 K/min heating rates experiments, with a pyrolysis final tem-perature around 600 °C. Furthermore, this model does not predict gas nor tar compositions.
Reaction rates follow first order kinetics. They are therefore ob-tained by multiplying reaction rate coefficients (Eq.(28)) by reagent density andνI J,coefficients, according to Eq.(29)for gases reagents and
to Eq.(30)for solid reagents.νI J K, , are stoichiometric coefficients taking
the value 0 or 1 according to the degradation scheme (Fig. 4). = ⎛ ⎝ ⎞⎠ kK AK exp EaRTK (28)
∏
= = ωK k ρK g ν Y I N I K I 1 , (29)∏
= = ωK kK ν ρ J M J K J 1 , (30)Gasification reaction rate features both char density and steam mass fraction dependency (Eq.(31)). It was established for the steam gasi-fication of char obtained from beech wood flash pyrolysis[63].
= = ⎛
⎝− ⎞⎠
ωgasi ω9 4.20 10 exp 1507504 RT ρ Ychar steam0.58 (31)
Modifications were applied to the kinetic schemes found in litera-ture. The first one is the introduction of water production in the pyr-olysis scheme. According to[62], 21.9 % of the tar produced by beech wood flash pyrolysis is in fact water. A repartition factor, called a, was therefore applied to derive pyrolysis water production.
In order to get credible results, it was mandatory to modify pyrolysis scheme char production. Indeed, the initially produced amount of char was extremely low and led to a 98% porosity char, which is not credible in our case. One should keep in mind that the used kinetic scheme has not been tested for high pyrolysis final temperature. The char
Fig. 4. Biomass drying model and pyrolysis scheme.
Table 3
Kinetic parameter for beech wood pyrolysis. a = 0.219[62]and b = 2.
Number Reaction A (1/s) Ea (kJ/ mol) ∆ (kJ/kg)h Reference 1 Wood ↦ steam 4.38 109× a 152.7 −80 [57,62] 2 Wood ↦ gas 4.38 109 152.7 −80 [57] 3 Wood ↦ tar 1.08 1010× (1-a) 148.0 −80 [57,62] 4 Wood ↦ intermediate solid 3.75 10 6× b 111.7 −80 [57] 5 Tar ↦ gas 2.15 1011 141.0 42 [60] 6 Tar ↦ char 1.0 105 108.0 42 [60] 7 Tar ↦ refractory tar 1.16 10 11 141.0 42 [60] 8 Intermediate solid ↦ char 1.38 10 10 161 300 [57] Table 4
Chosen physical properties for beech wood. a: 0%wb, b: 9%wb, c: 55%wb.†over the heat
source spectrum
Symbol Property Value Dimension Note
αwood Wood
absorptivity†
0.37 – Measured
∊wood Wood
emissivity† 0.37 – Assumed
cpwood Wood specific
heat capacity 2300-1150 exp(−0.0055 T (°C)) J/kg/K [47] λlong wood, Wood thermal
longitudinal conductivity 0.291 + 2.759 10−4T(°C) W/m/K [72] κwood Wood permeability tensor ⎜ ⎟ ⎛ ⎝ ⎞⎠ − − 367 10 0 0 742 10 18 15 m2 [73]
Dwood Wood mass
diffusivity tensor ⎜⎛ ⎟ ⎝ ⎞⎠ − − 4.8 10 0 0 86 10 10 10 m2/s [73]
ζwood Wood porosity 0.57a,0.61b,0.65c – Measured
Table 5
Chosen physical properties for char.
Symbol Property Value Dimension Note
αchar Char
absorptivity† 0.88 – Measured
∊char Char
emissivity† 0.88 – Assumed
cpchar Char specific
heat capacity 1430 + 0.355 T(K) –
T K
7.3210 107 ( )2
J/kg/K [47]
λlong char, Char longitudinal thermal 2.3584 – 1.4962 10−2T(°C) + 3.8483 10−5T(°C)2 W/m/K [41] conductivity −4.329210−8T(°C)3 + 1.859510−11T(°C)4 κchar Char permeability tensor ⎛ ⎝ ⎞⎠ − − 1 10 11 99.7 100 6 01 m2 Estimated[54]
Dchar Char mass
diffusivity tensor Dwood ζchar ζwood m 2/s Estimated
ζchar Char porosity ρchar bulkρchar
, – Estimated
production kinetic parameter was corrected by a factor called b, taken as 2. Given the intrinsic weakness that is the dependency on these ki-netic schemes, it was chosen to keep the correction factor with only one significant digit. This correction yields char with 95 % porosity, which is in agreement with the literature dealing with high temperature pyrolysis[50].
5. Preliminary results and additional strategies 5.1. Preliminary results
Fig. 5compares the char density field predicted by this model with the experimental observations for 0%wb initial moisture content case. The model does not properly describe the evolution of the sample geometry. The same problem emerges for 9 and 55%wb initial moisture content cases.
For low initial moisture content cases, a char layer forms on the top of the sample. Because of its low thermal conductivity, this char layer behaves like a thermal shield, depriving the sample degradation process from power. For the high initial moisture content case, char on the top of the sample is consumed by water coming from sample drying until its density is infinitely low. Nevertheless, this very specific zone also acts like a thermal shield, with the same consequences as aforementioned. In can be concluded that the set of equations presented before does not properly to capture biomass behaviour under high solar heat flux. From experimental observations, one can guess that incident radiation can penetrate the medium between char rods and therefore supply heat in the depth of the sample, which is not accounted for in the former set of equations. In addition, the geometry of the sample dramatically evolves over a run in high initial moisture content cases, reducing the length heat has to diffuse over to reach the reaction fronts. The evo-lution of the sample shape was not implemented either.
Based on experimental observations, it seems to be mandatory to take into account the radiation penetration into the medium, to prop-erly describe low initial moisture content sample for which char can not be gasified by steam, and the numerical domain deformation, to capture high initial moisture content sample behaviour.
5.2. Radiation penetration
During the experiments, the incident radiation penetrates the medium in between char rods (Fig. 6). Deforming the mesh in order to describe each and every rod was not accessible. Therefore, an homo-geneous approach was chosen. The crater is considered to be char and is described using char physical properties modification. A volume field (Qpen) is built in order to take into account, in the heat balance
equa-tion, the radiative power which penetrates into the sample. This field is constructed considering that a fraction (ξ) of the incident power reaching the top boundary of the sample propagates ballistically through the char crater. The ray direction is determined knowing two key geometrical parameters of the incident heat flux distribution, the focal spot radius (rfs) and the ray crossing point height (zfs) (Fig. 7). The
Fig. 5. Experimental observation and numerical prediction for 0 %wb basis initial moisture content sample, after 5 min exposure. Colormap: char density.
Fig. 6. In depth radiation penetration schematic view.
remaining fraction (1−ξ) of the incident radiative power is distributed on the top boundary. The in depth penetrating power propagates into the medium until it reaches the pyrolysis front, defined as the first cell whereρwood>ρis+ρchar. There, it is considered to be absorbed. Then,
theQpen field is built by dividing, in every cell, the local amount of
penetrating power by the cell volume. Once built, the Qpen field is
treated as a source term in the heat balance equation (Eq.(32)). The fraction of radiation penetrating the medium (ξ) is determined considering usual wood to char shrinkage proportion. It is known that char volume is by 70% lower than initial wood volume[64]. Thus, for a surface, the contraction would be around 50 % (ξ= 0.50). In addition, the incident beam is known to have an aperture angle of about 13°.
Fig. 9shows the numerically predicted char density field when radia-tion in depth penetraradia-tion is taken into account. Regarding the crater shape, the agreement between experimental observations and numer-ical prediction is now very good.
Radiation interaction with the flue gas was also neglected. To assess for the validity of this assumption, an estimation of the incident power absorbed by the atmosphere was computed. Knowing the composition of atmosphere above the sample, including H2O and CO2, its pressure
and its temperature, an absorption spectrum was produced using HITRAN transition database[65]. Using this spectrum, it was possible to calculate that only 1 10−5% of the incident power was absorbed.
5.3. Moving mesh
As experimentally observed in [30], steam gasification consumes the char produced by pyrolysis, leading to a disappearance of the medium. In terms of numerical modelling, this translates into the fact that solid phase density can reach 0 kg/mtextsuperscript3 in the top boundary cells. In order to correctly take this phenomenon into ac-count, a solid medium deformation strategy had to be implemented.
Phase field method has successfully been used in literature for a similar case [66]. This kind of method assigns a field to the solid medium, generally varying between 0 and 1. This field can move on a fixed mesh, describing the solid medium shape evolution. Yet, it did not seem adapted to radiative heat transfer in the way it is described in this model. Indeed, in order to properly take into account the radiative heating contribution, penalized cells with very high thermal con-ductivity would be required in order to transfer radiative heat to the solid medium boundary as fast as possible.
Arbitrary Lagrangian Eulerian technique[67]allows to deform a mesh and can therefore be a solution to properly take into account the radiative boundary condition. With this technique, the velocity is af-fected to mesh cells and solved fields are corrected to prevent the mesh velocity from inducing errors. This approach was successfully used to model space shuttle ablative thermal shield behaviour[68]. Yet, it re-quires an heavy reformulation of the model equations and the de-termination of a mesh velocity properly describing solid phase geo-metry evolution.
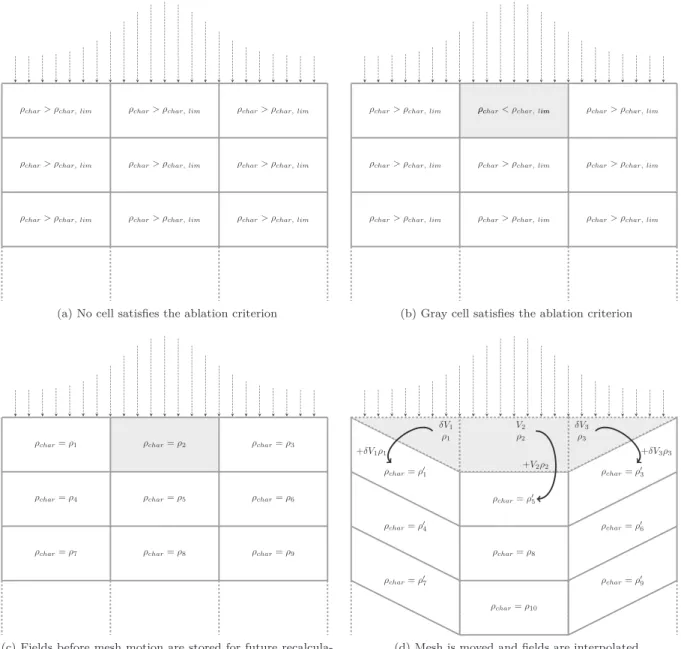
A third way was chosen: mesh interpolation, for it does not require governing equations reformulation nor mesh velocity determination. With this technique an ablation criterion is set, in our case when char porosity exceeds 0.975 (orρchar < 42.5 kg/m textsuperscript3). When a
cell satisfies this criterion, the mesh evolves in such a way that this cell disappears. Then, solved physical fields are interpolated between the old and new mesh so that they simulate solid phase ablation (Fig. 8). One should note that the value of the ablation criterion is chosen ar-bitrary. A sensitivity analysis where char critical porosity ranges from 0.95 to 0.99 was conducted. It showed that this parameters had almost no influence of the numerical results.
This technique is quite easy to understand and allows for great flexibility. Yet, it has one main drawback: it is heavy to implement (or even impossible to implement in closed source solvers). Implementing this technique required to use a numerical solver allowing for a great level of freedom in term of source code modifying. This is why the open
source OpenFOAM CFD framework was chosen to implement the model.
5.4. Equations evolution
In order to take into account radiation penetration into the medium and medium deformation, heat balance equation (Eq.(19)) and the top boundary condition equation (Eq.(21)) have to be modified. Radiation penetration contributes as a source term (Qpen) in a new heat balance
equation (Eq.(32)):
∑
∑
+ + + + ∇ + ∇ = − ∇ − ∇ + + + + ∂ ∂ = = u u λ D q D c ρ ζc ρ c ρ ρ c ρ T c ρ T T ω h c ρ Y c ρ Q ( ( )) . ( ) . ( ) . ( ) ∆ ∆ ∆ lw g eff s g bw p s p g p lw bw Tt p lw p g K O K K I N p g I p bw pen 1 1 s g lw lw g g lw (32) A new top boundary condition equation (Eq.(33)) is associated to this new heat balance. Coefficients multiplying the incident heat flux account for radiation absorption at the surface (αs) and penetration intothe medium (1−ξ). The termΨ( , , ,r z T T4 4sur)accounts for radiative losses. Yet,Ψ is a function taking into account the top surface shape. Indeed, when a the crater forms, the cells inside of the crater to do not have the same view factor toward the surrounding. They also emit and receive energy from the crater inner surface. In order to take this phenomenon into account, the crater internal view factor are computed assuming it has a cone shape[69].
−n. (−λeff.∇ = − −T) (1 )ξ α ϕ r zs ( , ) Ψ( , , , , ,− αs s∊ r z T T4 4sur) (−h Tsur−T) (33) 6. Results
6.1. Comparison with experimental observations
Before analysing model predictions in depth, numerical results are compared to experimental observations in order to assess for their va-lidity.
On a qualitative level, the predicted samples geometries and the char density fields are compared with the experimental observations for the three different initial moisture contents inFig. 10. The predicted crater depths and widths are close to the ones experimentally observed. It is a token of the quality of the solid fields evolution prediction.
On a quantitative level, the predicted time averaged production/ consumption rates can be compared with the experimental ones (Table 6). The numerical time averaged production/consumption rates were calculated using the same method as the experimental ones, in order to allow for a direct comparison.Fig. 11reports the predicted versus observed time averaged production/consumption rates. Wood consumption and char production rates are very well predicted by the model. Gas production rate is underestimated by the model in all cases, while tar production rate is overestimated. Nevertheless, the evolution of these rates with initial moisture content is well captured. Two factors may explain these discrepancies. First, the biomass degradation model may excessively favour tar production over gas production. Second, let us remind that the gas and tar production reported is the experimental work are measured approximatively 10 cm downstream of the wood sample surface. Tar may therefore undergo thermal cracking and steam reforming outside of the sample, therefore increasing gas production. These extra-particular chemical reactions are not taken into account in the model, hindering the possibility of a direct comparison between experimental observations and numerical predictions.
The model underestimates the water production rate in all cases, while its evolution with samples initial moisture content is well cap-tured. The explanation of this discrepancy is challenging. Indeed, nu-merous factors could contribute to a misprediction of the amount of water leaving the sample, e.g. hydrodynamic properties, pyrolysis
water yield, …Identifying the relevant one might be out of reach without experimental observations of the water distribution inside of the sample.
Because it mediates the transformation of wood into char, inter-mediate solid field can be used as a marker of pyrolysis progress throughout the sample. The intermediate solid field exhibits a front shape (Fig. 12). It is therefore used as a flag for pyrolysis front: its position and thickness can be compared with the experimental ob-servations.Table 7reports the model predictions and the experimental values for the surface temperature, the crater depth and the pyrolysis front thickness. The predicted values for the surface temperature and
the pyrolysis front thickness are close to the experimental ones. Re-garding the char crater depth, discrepancies of 15 % exist. Yet, the trends are well captured for wide variations of initial moisture content. 6.2. General behaviour
Given the good agreement between the numerical model predictions and the experimental observations, it is thought to be possible to fur-ther analyse biomass behaviour under high solar heat flux using the model predictions.
As a general comment, the degradation of a thermally thick sample of biomass under high solar heat flux induces drying, pyrolysis and gasification fronts inside of the sample as detailed below. This general
Fig. 9. Numerical prediction, with in depth radiation penetration, for 0 %wb basis initial moisture content sample. Colormap: char density.
Fig. 10. Experimental and numerical crater cut views. Colormap: char density.
Table 6
Observed and predicted time averaged production/consumption rates. Time
averaged rates (g/ min)
0%wb 9%wb 55%wb
Exp. Num. Exp. Num. Exp. Num.
Wood 7.05± 0.48 7.38 5.76± 0.42 5.56 0.99± 0.02 1.46
Water 0.49± 0.49 0.00 1.57± 0.43 0.47 5.89± 0.06 3.78
Char 1.74± 0.002 1.65 1.37± 0.002 1.20 0.09± 0.002 0.26
Gas 4.12± 0.07 2.50 3.65± 0.07 2.15 1.70± 0.55 0.68
behaviour is in good agreement with the dimensionless numbers pre-dictions. The main part (about 90%) of the produced gases are forced toward the top boundary and therefore go through a high temperature char layer before escaping from the medium. This configuration is very likely to lead to physical couplings between the phenomena at stake during biomass degradation under high solar heat flux.
6.2.1. Drying
During a run, a drying front can be observed for the three initial moisture contents. The water density field exhibits the same shape in all cases. The field can be divided into three zones (Fig. 13andFig. 14):
•
a dry zone (in light gray inFig. 13, A inFig. 14), where the tem-perature is far above 100 °C through which the major part of the steam escapes the sample•
a condensation zone (in black inFig. 13, C inFig. 14), in which part of the steam is forced by the pressure gradient created at the drying front (B in Fig. 14). In this zone, steam condenses. Condensation being exothermic, steam condenses until the temperature reaches a value close to 100 °C and moisture content raises to an equilibrium value of 84 kg/m3•
an unmodified zone (in dark gray inFig. 13, D inFig. 14), where themoisture is equal to the initial moisture content, because no steam has condensed in this zone
For 0%wb initial moisture content samples, water originates from wood pyrolysis only. Indeed, pyrolysis produces steam that is forced, for a part, toward cold regions of the sample where it condenses. For 9 and 55%wb initial moisture content samples, water is both initially present in the medium and produced by pyrolysis. Nevertheless, one should keep in mind that, even if it is credible, this described behaviour cannot be validated by direct experimental observation.
6.2.2. Tar production
During a run, the degrading sample releases tar. If temperature is high enough, tar undergo thermal cracking, turning them into gas and refractory tar. The model reports that both tar and refractory tar are produced during a run. The cohabitation of tar and refractory tar could result from:
•
partial thermal cracking, because residence time and temperature would not be sufficient to fully crack the tar before they escape the sample•
the coexistence of a low temperature tar producing zone and a highFig. 11. Experimental and numerical time averaged production/consumption rates for the bout de bout configurations.
Fig. 12. Intermediate solid density field after 5 min, for the reference case (9 %wb, end grain). Colormap: intermediate solid density.
Table 7
Observed and predicted surface temperature, crater depth and pyrolysis front final thickness.
0%wb 9%wb 55%wb
Exp. Num. Exp. Num. Exp. Num.
Surface temperature (°C) 1594± 123 1515 1530± 120 1526 1317± 98 1337
Crater depth (cm) 4.5 3.9 3.2 3.7 2.4 2.2
Pyrolysis front thickness (mm) 4 4 3 4 0.5 0.5
Fig. 13. Water density field after 5 min, for the reference case (9 %wb, end grain). Colormap: water density.
temperature zone cracking tar into refractory tar
Fig. 15reports tar and refractory tar mass fractions in the gas phase, as well as temperature, along the top boundary of the sample after 2 min and 30 s of exposure for the reference case (9%wb, end grain). The surface of the sample can be divided into two zones: an inner zone where only refractory tar are emitted and an outer zone from which uncracked tar are released. The model predicts that uncracked tar es-cape the sample by the low temperature zone at the periphery of the sample, while tar crossing the center of the sample undergo thermal cracking and escape the medium as refractory tar and gas.
Time dependent gas productions, experimentally observed and nu-merically predicted, are reported inFig. 16. As stated before, the model underpredicts sample gas production. Furthermore, the model does not capture the trend of the experimental curve. Indeed, the experimentally reported gas production increases with time while the numerically predicted one flattens. The difference between the two trends can be used to derive indirect insights on tar history. A first explanation for the experimentally reported increase in sample gas production is an
acceleration of pyrolysis. Yet, the model which properly predicts solid fields evolution negates such a possibility. This rise may therefore come from an increase of the tar thermal cracking and/or steam reforming. This increase is made possible by the deepening of the crater which induces a higher tar residence time in a high temperature medium. Yet, the model, which only accounts for intra-particular tar thermal cracking, does not predict this increase. Altogether, this leads to think that extra particular tar cracking and tar steam reforming play a major role in the evolution of the gaseous products distribution. External CFD study would thus be required in order to improve gaseous products distribution prediction.
6.2.3. Char steam gasification
The numerical model confirms that water is forced out of the sample through the high temperature char layer. This configuration could allow char steam gasification to take place inside of the char crater. Two different mechanisms could explain the computational domain deformation: very low char production, i.e. the produced amount of char would not be sufficient to overpass the deformation criterion (ζ 0.975) or steam gasification of the char produced by pyrolysis. In> order to differentiate the importance of the two phenomena, gasifica-tion was deactivated for a set of simulagasifica-tions. In this condigasifica-tion, no de-formation of the computational domain could be observed. It can therefore be concluded that the amount of char produced by pyrolysis is sufficient to prevent the porosity to exceed 0.975.
Fig. 17reports the char steam gasification reaction rate for both 9 and 55%wb initial moisture content cases after 2 min and 30 s of ex-posure. Char steam gasification exclusively consumes char very close to the upper boundary, where temperature is high enough. Gasification is therefore the main phenomenon behind medium ablation.
Char steam gasification is much more intense for high initial moisture content samples, with a maximum rate of 8.5 kg/m3/s, while
it peaks at 2.5 kg/mtextsuperscript3/s for 9 %wb initial moisture con-tent samples. Given char steam gasification endothermicity, this dif-ference of intensity explains the lower top surface temperature both experimentally observed and numerically predicted for high initial moisture content samples as reported inTable 7.
7. Conclusion
This article presents a new numerical model describing biomass solar pyro-gasification. This model is based on three classical balance equations, i.e. mass, momentum and energy. These equations are
º
Fig. 14. Water density and temperature along the vertical axis at r = 2.5 cm after 5 min, for the reference case (9%wb, end grain). Zones: A: dry zone, B: drying front, C: con-densation zone, D: unmodified zone. Black line: water density, gray line: temperature.
Fig. 15. Temperature, tar and refractory tar mass fractions along the top boundary after 2 min and 30 s, for the reference case (9%wb, end grain). Black line: tar, gray line: re-fractory tar, dashed line: temperature.
Fig. 16. Experimental and numerical time dependent gas productions, for the reference case (9%wb, end grain). Black line: experimental result, gray line: numerical prediction.
coupled with liquid-vapour drying model and pseudo species biomass degradation model. The model development has shown that these equations are not enough to accurately predict biomass behaviour under high solar heat flux. Indeed, contrary to the experimentally ob-served behaviour, the model predict the appearance of a char layer acting as radiative shield on the sample exposed surface.
In order to properly capture the degradation of biomass when ex-posed to high radiative heat flux, it was shown to be mandatory to take into account radiation penetration into the medium. Furthermore, for wet samples, medium deformation consecutively to char steam gasifi-cation must also be implemented. Thanks to these two strategies, model predictions are in good agreement with experimental observations.
Based on the model predicted behaviour, further understanding of biomass behaviour under high solar heat flux was derived. Drying, pyrolysis and gasification fronts are present at the same time inside of the sample. The coexistence of these three thermochemical fronts leads to physical couplings. The major coupling being char gasification by the steam produced from drying of the sample. The model confirms that it is the main phenomenon behind medium ablation.
Finally, the numerical tools developed in this work can applied to a wider range of problem than biomass solar pyro-gasifcation modelling. Radiation penetration strategy can be used to properly describe heat radiative heat penetrating a fractured surface. While the moving mesh strategy can be used to take into account sample shrinkage in virtually any single particle pyrolysis model.
Acknowledgement
This work was funded by the French “Investments for the future” program managed by the National Agency for Research under contract ANR-10-LABX-22-01.
References
[1] International Energy Outlook 2013. DOE/EIA-0484(2013), United States Energy Information Administration, Washington, D.C.; 2013.http://www.eia.gov/ forecasts/ieo/.
[2] Key World Energy Statistics. Tech. rep., International Energy Agency; 2015. https:// www.iea.org/publications/freepublications/publication/KeyWorld2014.pdf. [3] Climate change 2014 - Synthesis report, Tech. rep., International Panel on Climate
Change (2014).http://www.ipcc.ch/pdf/assessment-report/ar5/syr/ SYRAR5FINALfull.pdf.
[4] De Filippis P, Borgianni C, Paolucci M, Pochetti F. Prediction of syngas quality for two-stage gasification of selected waste feedstocks. Waste Manage
2004;24(6):633–9.http://dx.doi.org/10.1016/j.wasman.2004.02.014. URL:http:// www.sciencedirect.com/science/article/pii/S0956053X04000510.
[5] Piatkowski N, Steinfeld A. Solar-driven coal gasification in a thermally irradiated packed-bed reactor. Energy Fuels 2008;22(3):2043–52.http://dx.doi.org/10.1021/ ef800027. wOS:000256057600086.
[6] Hertwich EG, Zhang X. Concentrating-solar biomass gasification process for a 3rd generation biofuel. Environ Sci Technol 2009;43(11):4207–12.http://dx.doi.org/ 10.1021/es802853g. wOS:000266546700039.
[7] Nzihou A, Flamant G, Stanmore B. Synthetic fuels from biomass using concentrated solar energy – a review. Energy 2012;42(1):121–31.http://dx.doi.org/10.1016/j. energy.2012.03.077. URL:http://www.sciencedirect.com/science/article/pii/ S0360544212002812.
[8] Puig-Arnavat M, Tora EA, Bruno JC, Coronas A. State of the art on reactor designs for solar gasification of carbonaceous feedstock. Sol Energy 2013;97:67–84.http:// dx.doi.org/10.1016/j.solener.2013.08.001. URL:http://www.sciencedirect.com/ science/article/pii/S0038092X13003113.
[9] Piatkowski N, Steinfeld A. Solar gasification of carbonaceous waste feedstocks in a packed-bed reactor–Dynamic modeling and experimental validation. AIChE J 2011;57(12):3522–33.http://dx.doi.org/10.1002/aic.12545. URL:http:// onlinelibrary.wiley.com/doi/10.1002/aic.12545/abstract.
[10] Piatkowski N, Wieckert C, Steinfeld A. Experimental investigation of a packed-bed solar reactor for the steam-gasification of carbonaceous feedstocks. Fuel Process Technol 2009;90(3):360–6.http://dx.doi.org/10.1016/j.fuproc.2008.10.007. URL:http://www.sciencedirect.com/science/article/pii/S0378382008002671. [11] Wang XQ, Kersten SRA, Prins W, van Swaaij WPM. Biomass pyrolysis in a fluidized
bed reactor. Part 2: Experimental validation of model results. Ind Eng Chem Res 2005;44(23):8786–95.http://dx.doi.org/10.1021/ie050486y.
wOS:000233214000040.
[12] Lédé J. Comparison of contact and radiant ablative pyrolysis of biomass. J Anal Appl Pyrol 2003;70(2):601–18. http://dx.doi.org/10.1016/S0165-2370(03)00043-3. URL:http://www.sciencedirect.com/science/article/pii/S0165237003000433. [13] Gordillo E, Belghit A. A downdraft high temperature steam-only solar gasifier of biomass char: a modelling study. Biomass Bioenergy 2011;35(5):2034–43.http:// dx.doi.org/10.1016/j.biombioe.2011.01.051. URL:http://www.sciencedirect.com/ science/article/pii/S0961953411000663.
[14] Flechsenhar M, Sasse C. Solar gasification of biomass using oil shale and coal as candidate materials. Energy 1995;20(8):803–10. http://dx.doi.org/10.1016/0360-5442(95)00023-A. URL:http://www.sciencedirect.com/science/article/pii/ 036054429500023A.
[15] Li X, Grace J, Lim C, Watkinson A, Chen H, Kim J. Biomass gasification in a cir-culating fluidized bed. Biomass Bioenergy 2004;26(2):171–93.http://dx.doi.org/ 10.1016/S0961-9534(03)00084-9.
[16] Zedtwitz P, Steinfeld A. The solar thermal gasification of coal – energy conversion efficiency and CO2 mitigation potential. Energy 2003;28(5):441–56.http://dx.doi. org/10.1016/S0360-5442(02)00139-1. URL:http://www.sciencedirect.com/ science/article/pii/S0360544202001391.
[17] Z’Graggen A, Steinfeld A. Hydrogen production by steam-gasification of carbo-naceous materials using concentrated solar energy – V. Reactor modeling, optimi-zation, and scale-up. Int J Hydrogen Energy 2008;33(20):5484–92.http://dx.doi. org/10.1016/j.ijhydene.2008.07.047. URL:http://www.sciencedirect.com/ science/article/pii/S036031990800904X.
[18] Belghit A. Etude théorique et expérimentale d’un gazéifieur solaire de matière carbonées en lit poreux mobile [Ph.D. thesis], Université de Perpignan; 1986. [19] Gordillo E, Belghit A. A bubbling fluidized bed solar reactor model of biomass char
high temperature steam-only gasification. Fuel Process Technol
2011;92(3):314–21.http://dx.doi.org/10.1016/j.fuproc.2010.09.021. URL:http:// www.sciencedirect.com/science/article/pii/S0378382010003218.
[20] Di Blasi C, Branca C, Santoro A, Perez Bermudez RA. Weight loss dynamics of wood chips under fast radiative heating. J Anal Appl Pyrol 2001;57(1):77–90.http://dx. doi.org/10.1016/S0165-2370(00)00119-4. URL:http://www.sciencedirect.com/ science/article/pii/S0165237000001194.
[21] Antal MJ, Hofmann L, Moreira J, Brown CT, Steenblik R. Design and operation of a solar fired biomass flash pyrolysis reactor. Sol Energy 1983;30(4):299–312.http:// dx.doi.org/10.1016/0038-092X(83)90185-8.
[22] Hopkins MW, Antal MJ, Kay JG. Radiant flash pyrolysis of biomass using a xenon flashtube. J Appl Polym Sci 1984;29(6):2163–75.http://dx.doi.org/10.1002/app. 1984.070290622.
[23] Hopkins MW, DeJenga C, Antal MJ. The flash pyrolysis of cellulosic materials using concentrated visible light. Sol Energy 1984;32(4):547–51.http://dx.doi.org/10. 1016/0038-092X(84)90269-X.
[24] Zeng K, Minh DP, Gauthier D, Weiss-Hortala E, Nzihou A, Flamant G. The effect of Fig. 17. Gasification reaction rate fields for 9 and 55 %wb initial moisture content cases, after 2 min and 30 s. Colormap: gasification reaction rate.
temperature and heating rate on char properties obtained from solar pyrolysis of beech wood. Bioresour Technol 2015;182:114–9.http://dx.doi.org/10.1016/j. biortech.2015.01.112.
[25] Galgano A, Di Blasi C. Modeling the propagation of drying and decomposition fronts in wood. Combust Flame 2004;139(1–2):16–27.http://dx.doi.org/10.1016/j. combustflame.2004.07.004. URL:http://www.sciencedirect.com/science/article/ pii/S0010218004001488.
[26] Branca C, Giudicianni P, Di Blasi C. GC/MS characterization of liquids generated from low-temperature pyrolysis of wood. Ind Eng Chem Res
2003;42(14):3190–202.http://dx.doi.org/10.1021/ie030066d. wOS:000183991400003.
[27] Di Blasi C. Combustion and gasification rates of lignocellulosic chars. Prog Energy Combust Sci 2009;35(2):121–40.http://dx.doi.org/10.1016/j.pecs.2008.08.001. URL:http://www.sciencedirect.com/science/article/pii/S0360128508000440. [28] Milne TA, Abatzoglou N, Evans RJ. Biomass gasifier tars: Their nature, formation,
and conversion vol. 570. CO: National Renewable Energy Laboratory Golden; 1998. [29] Zhao B, Zhang X, Chen L, Qu R, Meng G, Yi X, Sun L. Steam reforming of toluene as
model compound of biomass pyrolysis tar for hydrogen. Biomass Bioenergy 2010;34(1):140–4.http://dx.doi.org/10.1016/j.biombioe.2009.10.011. URL:http://www.sciencedirect.com/science/article/pii/S0961953409002141. [30] Pozzobon V, Salvador S, Bézian JJ. Biomass gasification under high solar heat flux:
Experiments on thermally thick samples. Fuel 2016;174:257–66.http://dx.doi.org/ 10.1016/j.fuel.2016.02.003. URL:http://www.sciencedirect.com/science/article/ pii/S0016236116001174.
[31] Authier O, Ferrer M, Mauviel G, Khalfi A-E, Lede J. Wood fast pyrolysis: comparison of lagrangian and eulerian modeling approaches with experimental measurements. Ind Eng Chem Res 2009;48(10):4796–809.http://dx.doi.org/10.1021/ie801854c. wOS:000266081300016.
[32] Chern J-S, Hayhurst AN. A model for the devolatilization of a coal particle suffi-ciently large to be controlled by heat transfer. Combust Flame 2006;146(3):553–71.
http://dx.doi.org/10.1016/j.combustflame.2006.04.011. wOS:000239871400012. [33] di Blasi C. Analysis of convection and secondary reaction effects within porous solid fuels undergoing pyrolysis. Combust Sci Technol 1993;90(5–6):315–40.http://dx. doi.org/10.1080/00102209308907620. URL:http://www.tandfonline.com/doi/ abs/10.1080/00102209308907620.
[34] Bejan A. Convection Heat Transfer. Wiley; 1984.
[35] Chauveteau G, Thirriot C. Sur les pertes de charge en écoulement laminaire dans quelques géométries simple et dans le milieu poreux. trieste Edition, Trieste; 1965. [36] Quintard M, Kaviany M, Whitaker S. Two-medium treatment of heat transfer in
porous media: numerical results for effective properties. Adv Water Resour 1997;20(2–3):77–94.http://dx.doi.org/10.1016/S0309-1708(96)00024-3. [37] Puiroux N, Prat M, Quintard M. Non-equilibrium theories for macroscale heat
transfer: ablative composite layer systems. Int J Therm Sci 2004;43(6):541–54.
http://dx.doi.org/10.1016/j.ijthermalsci.2003.11.004. URL:http://www. sciencedirect.com/science/article/pii/S1290072903001819.
[38] Golfier F, Quintard M. Heat and mass transfer in tubes: an analysis using the method of volume averaging. J Porous Media 2002;5(2):169–85.
[39] Kansa E, Perlee H, Chaiken R. Mathematical-model of wood pyrolysis including internal forced-convection. Combust Flame 1977;29(3):311–24.http://dx.doi.org/ 10.1016/0010-2180(77)90121-3. wOS:A1977DU60400010.
[40] Saastamoinen J, Richard J-R. Simultaneous drying and pyrolysis of solid fuel par-ticles. Combust Flame 1996;106(3):288–300. http://dx.doi.org/10.1016/0010-2180(96)00001-6.
[41] Gauthier G. Synthèse de biocarburants de deuxième génération: Etude de la pyr-olyse à haute température de particules de bois centimétriques [Ph.D. thesis]. INPT EMAC; 2013.
[42] Bergman TL, Incropera FP, Lavine AS. Fundamentals of heat and mass transfer. John Wiley & Sons; 2011.
[43] Pozzobon V, Salvador S. High heat flux mapping using infrared images processed by inverse methods: an application to solar concentrating systems. Solar Energy 2015;117C:29–35.http://dx.doi.org/10.1016/j.solener.2015.04.021. [44] Borman GL, Ragland KW. Combustion engineering. McGraw-Hill; 1998. [45] Bates RB, Ghoniem AF. Modeling kinetics-transport interactions during biomass
torrefaction: The effects of temperature, particle size, and moisture content. Fuel 2014;137:216–29.http://dx.doi.org/10.1016/j.fuel.2014.07.047.
wOS:000341303300027.
[46] Salvador S, Quintard M, David C. Combustion of a substitution fuel made of card-board and polyethylene: influence of the mix characteristics-modeling. Fire Mater 2008;32(7):417–44.http://dx.doi.org/10.1002/fam.978. wOS:000261118100003. [47] Blondeau J, Jeanmart H. Biomass pyrolysis at high temperatures: Prediction of
gaseous species yields from an anisotropic particle. Biomass Bioenergy 2012;41:107–21.http://dx.doi.org/10.1016/j.biombioe.2012.02.016. URL:http:// www.sciencedirect.com/science/article/pii/S0961953412001043.
[48] Shen DK, Fang MX, Luo ZY, Cen KF. Modeling pyrolysis of wet wood under external heat flux. Fire Saf J 2007;42(3):210–7.http://dx.doi.org/10.1016/j.firesaf.2006. 09.001. URL:http://www.sciencedirect.com/science/article/pii/
S0379711206001263.
[49] Perré P, Turner IW. A 3-D version of TransPore: a comprehensive heat and mass transfer computational model for simulating the drying of porous media. Int J Heat Mass Transf 1999;42(24):4501–21.http://dx.doi.org/10.1016/S0017-9310(99) 00098-8.
[50] Commandré JM, Lahmidi H, Salvador S, Dupassieux N. Pyrolysis of wood at high temperature: the influence of experimental parameters on gaseous products. Fuel Process Technol 2011;92(5):837–44.http://dx.doi.org/10.1016/j.fuproc.2010.07. 009. URL:http://www.sciencedirect.com/science/article/pii/
S0378382010002419.
[51] Guerrero M, Ruiz M, Alzueta M, Bilbao R, Millera A. Pyrolysis of eucalyptus at different heating rates: studies of char characterization and oxidative reactivity. J Anal Appl Pyrol 2005;74(1–2):307–14.http://dx.doi.org/10.1016/j.jaap.2004.12. 008. http://www.sciencedirect.com/science/article/pii/S0165237005000318. [52] Koufopanos C, Maschio G, Lucchesi A. Kinetic modeling of the pyrolysis of biomass
and biomass components. Can J Chem Eng 1989;67(1):75–84. wOS:A1989T381400010.
[53] Mermoud F. Gazéification de charbon de bois à la vapeur d’eau: de la particule isolée au lit fixe continu [Ph.D. thesis]. Institut National Polytechnique de Toulouse; 2006.
[54] Grnli MG, Melaaen MC. Mathematical model for wood pyrolysiscomparison of ex-perimental measurements with model predictions. Energy Fuels
2000;14(4):791–800.http://dx.doi.org/10.1021/ef990176q.
[55] Mermoud F, Salvador S, Van de Steene L, Golfier F. Influence of the pyrolysis heating rate on the steam gasification rate of large wood char particles. Fuel 2006;85(10–11):1473–82.http://dx.doi.org/10.1016/j.fuel.2005.12.004. URL:http://www.sciencedirect.com/science/article/pii/S0016236105004710. [56] Zanzi R, Sjöström K, Björnbom E. Rapid high-temperature pyrolysis of biomass in a
free-fall reactor. Fuel 1996;75(5):545–50. http://dx.doi.org/10.1016/0016-2361(95)00304-5. URL:http://www.sciencedirect.com/science/article/pii/ 0016236195003045.
[57] Park WC, Atreya A, Baum HR. Experimental and theoretical investigation of heat and mass transfer processes during wood pyrolysis. Combust Flame
2010;157(3):481–94.http://dx.doi.org/10.1016/j.combustflame.2009.10.006. URL:http://www.sciencedirect.com/science/article/pii/S0010218009002843. [58] Mohan D, Pittman CU, Steele PH. Pyrolysis of wood/biomass for bio-oil: a critical
review. Energy Fuels 2006;20(3):848–89.http://dx.doi.org/10.1021/ef0502397. [59] Ranzi E, Cuoci A, Faravelli T, Frassoldati A, Migliavacca G, Pierucci S, Sommariva
S. Chemical kinetics of biomass pyrolysis. Energy Fuels 2008;22(6):4292–300.
http://dx.doi.org/10.1021/ef800551t.
[60] Okekunle PO, Pattanotai T, Watanabe H, Okazaki K. Numerical and experimental investigation of intra-particle heat transfer and tar decomposition during pyrolysis of wood biomass. J Thermal Sci Technol 2011;6(3):360–75.http://dx.doi.org/10. 1299/jtst.6.360. wOS:000295920800004.
[61] Suuberg EM, Milosavljevic I, Oja V. Two-regime global kinetics of cellulose pyr-olysis: The role of tar evaporation. Symp (Int) Combust 1996;26(1):1515–21.
http://dx.doi.org/10.1016/S0082-0784(96)80373-0.
[62]Beaumont O, Schwob Y. Influence of physical and chemical parameters on wood pyrolysis. Ind Eng Chem Process Des Dev 1984;23(4):637–41.
[63]Yoon HC, Pozivil P, Steinfeld A. Thermogravimetric pyrolysis and gasification of lignocellulosic biomass and kinetic summative law for parallel reactions with cel-lulose, xylan, and lignin. Energy Fuels 2011;26(1):357–64.
[64] Pozzobon V, Salvador S, Bézian JJ, El-Hafi M, Le Maoult Y, Flamant G. Radiative pyrolysis of wet wood under intermediate heat flux: experiments and modelling. Fuel Process Technol 2014;128:319–30.http://dx.doi.org/10.1016/j.fuproc.2014. 07.007. URL:http://www.sciencedirect.com/science/article/pii/
S0378382014002896.
[65] HITRAN on the Web.http://hitran.iao.ru/.
[66] Kwiatkowski K, Bajer K, Celińska A, Dudyński M, Korotko J, Sosnowska M. Pyrolysis and gasification of a thermally thick wood particle – effect of fragmen-tation. Fuel 2014;132:125–34.http://dx.doi.org/10.1016/j.fuel.2014.04.057. URL:http://www.sciencedirect.com/science/article/pii/S0016236114003925. [67]Donea J, Huerta A, Ponthot J-P, Rodriguez-Ferran A. Encyclopedia of
Computational Mechanics, Vol. 1: Fundamentals. Chapter 14: Arbitrary Lagrangian-Eulerian Methods. Wiley & Sons; 2004.
[68] Lachaud J, Mansour N. Porous-material Analysis Toolbox based on OpenFOAM-extend and Applications. In: 44th AIAA Thermophysics Conference, Fluid Dynamics and Co-located Conferences, American Institute of Aeronautics and Astronautics; 2013. doi:http://dx.doi.org/10.2514/6.2013-2767.
[69]Buraczewski C, Stasiek J. Application of generalized Pythagoras theorem to calcu-lation of configuration factors between surfaces of channels of revolution. Int J Heat Fluid Flow 1983;4(3):157–60.
[70]Hirschfelder J. Molecular Theory of Gases and Liquids. New York: John Wiley & Sons, Inc.; 1957. (a) p 165 (1957) 562.
[71] Moghtaderi B. The state-of-the-art in pyrolysis modelling of lignocellulosic solid fuels. Fire Mater 2006;30(1):1–34.http://dx.doi.org/10.1002/fam.891. wOS:000235521800001.
[72] Harada T, Hata T, Ishihara S. Thermal constants of wood during the heating process measured with the laser flash method. J Wood Sci 1998;44(6):425–31.http://dx. doi.org/10.1007/BF00833405. URL:http://www.springerlink.com/content/ r839347w63727705/abstract/.
[73] Redman AL, Bailleres H, Turner I, Perré P. Mass transfer properties (permeability and mass diffusivity) of four australian hardwood species. BioResources 2012;7(3):3410–24. URL:http://www.ncsu.edu/bioresources/BioRes07/ BioRes0733410RedmanBTPMassTransPropAustralHWSpp2648.pdf.