HAL Id: hal-01437880
https://hal.inria.fr/hal-01437880
Submitted on 17 Jan 2017
HAL is a multi-disciplinary open access
archive for the deposit and dissemination of
sci-entific research documents, whether they are
pub-lished or not. The documents may come from
teaching and research institutions in France or
abroad, or from public or private research centers.
L’archive ouverte pluridisciplinaire HAL, est
destinée au dépôt et à la diffusion de documents
scientifiques de niveau recherche, publiés ou non,
émanant des établissements d’enseignement et de
recherche français ou étrangers, des laboratoires
publics ou privés.
Distributed under a Creative Commons Attribution| 4.0 International License
Effectiveness in Case of Resources Reduction? A
Covering Set Location Approach
Lionel Dupont, Matthieu Lauras, Claude Yugma
To cite this version:
Lionel Dupont, Matthieu Lauras, Claude Yugma. How to Maintain the Network Resilience and
Effectiveness in Case of Resources Reduction? A Covering Set Location Approach. 16th Working
Conference on Virtual Enterprises (PROVE), Oct 2015, Albi, France. pp.136-145,
�10.1007/978-3-319-24141-8_12�. �hal-01437880�
How to Maintain the Network Resilience and
Effectiveness in Case of Resources Reduction?
A Covering Set Location Approach
Lionel Dupont1, Matthieu Lauras1 and Claude Yugma2
1 Mines Albi – University of Toulouse, Campus Jarlard, Route de Teillet, 81000, Albi,
France
{lionel.dupont, matthieu.lauras}@mines-albi.fr
2 Ecole des Mines de Saint-Etienne, 880 Route de Mimet, 13451, Gardanne, France
yugma@emse.fr
Abstract. The objective of covering set location models consists in designing
or modifying a network (commercial shops, antennas, drugstores, etc.) in order to cover totally or partially the demand related to a given area. When an area is covered by several activities (multi coverage), this can improve the responsiveness of the network (in case of congestion traffic for example) but this can also have negative effects such as customers’ cannibalization. In this paper, we propose an innovative covering set location model able to support decision makers to design networks that have a high resiliency level (i.e. ability to maintain service level despite hazards or failures) in a context of resources reduction (i.e. closing-down of network installations). Basically, the proposal allows studying the benefits and limits of multi coverage on each part of the network. Heuristic and exact methods are suggested to solve this problem.
Keywords: Location model, resiliency, effectiveness, network, resources
reduction, covering location model.
1 Introduction and Research Statement
Many investment projects can be supported through facility location models. The general principle of these models consists in supplying customer demands (goods or services) from one or more facilities spatially distributed on a given area. A facility is defined as a large variety of entities.
Many practical problems can be formulated as covering problems. Here is a non-exhaustive list of real-life problems: police stations, hospitals, radar installations, shop centers, location of retail facilities, etc. For recent surveys on this topic, see Berman (2010) and Farahani (2012). Opening or using a facility is cost expensive (regarding investment and/or use). That is why most of the companies must optimize their networks in order to be competitive. The localization decisions are critical due to the time and expenses that any further change would induce. One particular issue of
modern networks consists in avoiding network overcosts by limiting the number of facilities that are necessary to work. Another particular issue is the fact that networks are more and more subjected to hazards. Thus, in a general context of means’ reduction, networks should maintain a capability regarding uncertainties. In other words, the challenge is to maximize the efficiency of a network while maintaining the resiliency of this network.
One particular illustration of this problem statement is the rationalization of a banking network on a given territory. Actually, bank companies are currently trying to limit the number of their agencies in order to reduce their costs. But at a same time, they want to propose a high service level to high-potential customers and to improve their resiliency in particular zones that are considered strategic or sensitive (for instance a business district or a shopping area). To do that, the decision-makers have to design a network that is characterized by (i) a limited number of facilities, (ii) a minimum service-level in nominal situation in the whole concerned territory and (iii) a redundancy capability in high-potential areas in order to manage uncertainties. This is the purpose of the current research work.
Classically, the paper is split up into 4 sections. The first one proposes a brief background on the multi-covering facility location problem. The second one formulates the studied problem. The third section develops the proposed model and gives some information regarding the solving step. Finally, the fourth section discusses the results obtained on a numerical application.
2 Background
One of the most popular models in the research area of facility location is the covering problem. In this problem, the customer can receive service from each facility, of which the distance to the customer is equal or less than a predefined number. This predefined distance is called service distance, coverage distance, or coverage radius R - Fallah (2009). The customer demand is then defined as a discrete set of demand nodes. Demands at a node i are "covered" by a candidate facility site j if the distance between i and j is less than R. On one hand, the Location Set Covering Problem (LSCP) minimizes the number of facilities that are required to cover, at least once, each node. On the other hand, considering a fixed number of facilities available, the Maximal Covering Location Problems (MCLP) maximizes the number of customers reached. Since seventies, many authors have discussed these covering problems such as Toregas (1971), Berlin (1974), Church (1974), Church (1983) or ReVelle (2008).
The problem that we studied in this paper is related to multiple-coverage problems. By multiple-coverage is meant the presence of more than one facility within the coverage distance. Hogan (1986) introduced the multiple-coverage concept. Kolen (1990) worked on multiple coverage problems. In this paper, the author considers that each existing demand node has to be delivered by a set of new facilities and this set depends on the type of new facilities. He introduces also an upper bound for the number of facilities that have to be located at a given place. From his side, Kim (2008) considered a problem in which the number of facilities on a continuous space
How to Maintain the Network Resilience and Effectiveness 139
is predetermined. He proposed a model, based on two objective functions, able to maximize primary and secondary coverage in such a context. Erdemir (2010) developed a set-covering problem through a MCLP in order to optimize aero medical and ground ambulance services. The originality of this approach is the fact that the allocated budget is not sufficient to satisfy all the demand with the good level of service. To solve this issue, the author proposed to maximize the amount of demand covered within the acceptable service distance by locating a given fixed number of new facilities. Erdemir (2010) developed a covering model that is a combination of response and total service times. Three complementary service coverage have been considered: (i) the field emergency medical one, (ii) the air emergency medical one and (iii) the joint coverage ground air emergency medical thorough transfer point one. Based on those, the model assesses if a node can be fulfilled by an emergency medical service in the frame of the response and service time limits. Then, the proposed model covers both crash nodes and paths (i.e. nodes and links of network).
Multiple-coverage can be suitable or prejudicial. When an area is covered by several activities (multi coverage), this improves the responsiveness and resilience of the system (in case of congestion traffic for example) but some also have negative effects (cannibalization customer for example). In the case of service or emergency facility, multi-coverage is suitable: with high levels of multiple coverage a congested system may more often be able to respond to demand even if the most desirable facility is busy. In the case of antenna placement, on the contrary, it is prejudicial: it creates electromagnetic interference due to multiple uses of frequencies at the node.
3 Problem Formulation
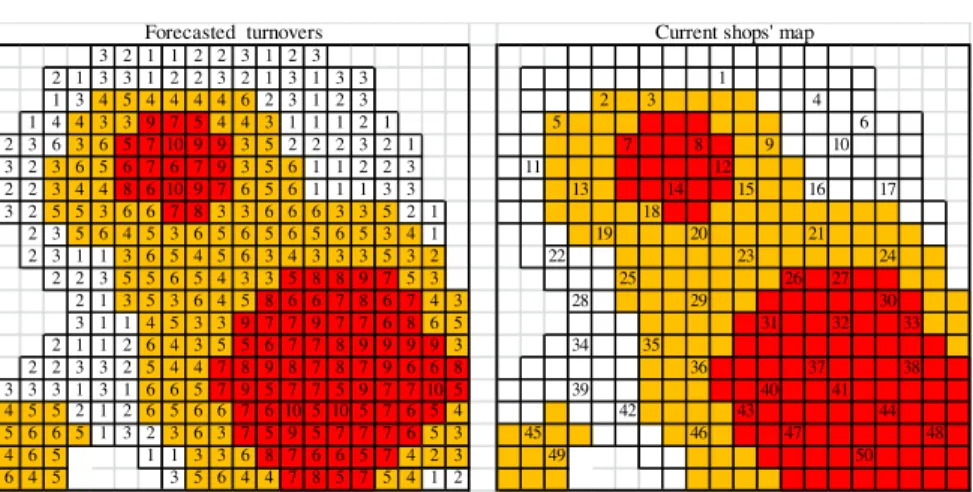
In this research work, a new extension of the multi-covering facility location problem is proposed. Here, the decision-maker wants to develop a multi-covering solution in particular areas and to avoid it in other ones. Let’s consider the following example to underline the interests of such an objective. A company has opened during the years 50 stores in a urban area. Considering the population and competitors’ evolutions, the network is not adapted anymore. The company wants to keep only 20 of its 50 shops. The urban area has been split up into a 20 x 20 square. We make the assumption that a shop covers a square of 5 x 5 (25 spots). The figure 1 hereafter gives the forecasted turnover for each spot and the position of the 50 current shops..
Fig. 1. Forecasted turnovers and the current shops’ map
Following a study, the urban area has been shared into three zones:
1. A zone characterized by a strong demand (in red). This is the most profitable one, where the competition is very intense. The objective is to have an important presence in any circumstance. The decision-maker wants to favor multi-covering solution able to offer a high-service level even when a hazard occurs.
2. A zone characterized by a medium demand (in orange). In this zone, there are few competitors and the decision-maker wants to be present.
3. A zone characterized by a low demand (in white). The decision-maker wants to keep a minimal presence on this area.
Each shop has a rental cost which varies depending on the location. In this example, we have considered proportional costs to turnovers (resp 4, 9, 14). Considering this network, the problem will consist in reducing the number of facilities from 50 to 20 while maintaining a high level of resiliency (evaluated through a multi-covering rate) and a high level of service (evaluated through a unsatisfied demand rate).
4 Scientific Proposition
If a demand node i is not covered by any facility, there is a gain of gi. Conversely, if a demand node i is covered by q facilities, it is an additional (or redundancy) value that is proportional to the number of extra facilities. This value is equal to (q-1).pi where
pi is the unit additional value. This value will be positive value (a gain) if multiple-coverage is suitable. Otherwise, it is a negative value (cost)
The capacity of a facility is assumed to be unlimited. Establishing a facility on a site j has a fixed cost fj.
3 2 1 1 2 2 3 1 2 3 2 1 3 3 1 2 2 3 2 1 3 1 3 3 1 1 3 4 5 4 4 4 4 6 2 3 1 2 3 2 3 4 1 4 4 3 3 9 7 5 4 4 3 1 1 1 2 1 5 6 2 3 6 3 6 5 7 10 9 9 3 5 2 2 2 3 2 1 7 8 9 10 3 2 3 6 5 6 7 6 7 9 3 5 6 1 1 2 2 3 11 12 2 2 3 4 4 8 6 10 9 7 6 5 6 1 1 1 3 3 13 14 15 16 17 3 2 5 5 3 6 6 7 8 3 3 6 6 6 3 3 5 2 1 18 2 3 5 6 4 5 3 6 5 6 5 6 5 6 5 3 4 1 19 20 21 2 3 1 1 3 6 5 4 5 6 3 4 3 3 3 5 3 2 22 23 24 2 2 3 5 5 6 5 4 3 3 5 8 8 9 7 5 3 25 26 27 2 1 3 5 3 6 4 5 8 6 6 7 8 6 7 4 3 28 29 30 3 1 1 4 5 3 3 9 7 7 9 7 7 6 8 6 5 31 32 33 2 1 1 2 6 4 3 5 5 6 7 7 8 9 9 9 9 3 34 35 2 2 3 3 2 5 4 4 7 8 9 8 7 8 7 9 6 6 8 36 37 38 3 3 3 1 3 1 6 6 5 7 9 5 7 7 5 9 7 7 10 5 39 40 41 4 5 5 2 1 2 6 5 6 6 7 6 10 5 10 5 7 6 5 4 42 43 44 5 6 6 5 1 3 2 3 6 3 7 5 9 5 7 7 7 6 5 3 45 46 47 48 4 6 5 1 1 3 3 6 8 7 6 6 5 7 4 2 3 49 50 6 4 5 3 5 6 4 4 7 8 5 7 5 4 1 2
How to Maintain the Network Resilience and Effectiveness 141
The problem can be formulated through a Mixed Integer Linear Programming (MILP) with binaries variables and the mathematical integer programming written as follows.
Let:
i: index of demand nodes
j: index of potential sites
S(i): set of sites that can cover the demand at node i
N(j): set of nodes that can be covered by site j Let us now define the set of decision variables:
• Binary allocation variables Xij are equal to 1 if node i is covered by site j and 0 otherwise.
• Binary location variables Yj are equal to 1 if a facility is located at site j and 0 otherwise.
• Binary coverage variables Zi are equal to 1 if node i is covered by at least a site and 0 otherwise.
• Integer variables Wi are equal to the number of established sites which cover node i
∑
∑
∑
+
−
−
i j igi
.
Zi
pi
(
Ni
Zi
)
fj
.
Yj
max
)
1
(
subject to:∑
∈ ≤ ∀ ) ( . ) ( ) 2 ( j N i Yj j N Xij jWi
Zi
i
≤
∀
,
)
4
(
Zi
i
S
Wi
i
,
(
)
.
)
5
(
∀
≤
Max
P
Yj
j∑
≤
)
6
(
Constraint (2) expresses the location and allocation variables and indicates that site
j is established if it covers at least one node of N(j). Constraints (3) determine the number of sites that cover node i. Constraints (4) and (5) state that Zi is equal to 0 if
Wi is equal to 0, and Zi is equal to 1 if Wi is greater than or equal to 1. Constraint (6) limits the number of located facilities at PMax.
∑
∈=
∀
) (,
)
3
(
i S jWi
Xij
i
This formulation uses 4 kinds of integer and binary variables. This formulation does not allow building a concise enumeration tree useable by a branch and bound technique. The integer variables Wi can easily be replaced by their expression (see equation 3). To limit the number of binary variables, we start by re-formulating this problem. Then, we call “main” facility of node i one and only one of the facility covering i. The other facilities covering i are “extra” facilities. They induce the multiple-coverage cost. The issue is then to select the main facilities. Let us introduce the binary allocation variables XMij. XMij are equal to 1 if site j is established (Yj=1) and site j is the main facility for node i, and 0 otherwise (site j is established and is extra facility of i or site j is not establish).
Within these variables XMij, the objective function can be written as following:
∑
∑ ∑
∑ ∑
+
−
−
j j S j j S(j)gi
.
XMij
( )pi
.(
Yj
XMij
)
fj
.
Yj
(
∑
)
∑
∑ ∑
− − − = ) ( . ). . ( j S j i j gi pi XMij Yj fj pi Let:.
. pi
gi
ai
=
−
∑
− = ) ( j S pi fj bjThe problem can be formulated:
.
.
.
max
)
7
(
∑ ∑
−
∑
j i jai
XMij
bj
Yj
The constraints become:
∑
∈≤
∀
) (.
)
(
)
8
(
j N iYj
j
N
XMij
j
∑
∈≤
∀
) (1
,
)
9
(
i S jXij
i
Max
P
Yj
j∑
≤
)
10
(
The objective function (7) maximizes the gain. Constraints (8) assure that Yj=1 if and only if a demand node has j as a main facility. Equation (9) ensures that at most one facility is the main facility of node i. Constraint (10) limits the number of located facilities.
5. Solving Issue
This kind of MILP problem can be solved by current software only if the problem has a limited size. That’s why we propose to use here a branch and bound method:
How to Maintain the Network Resilience and Effectiveness 143
Usually, the branch and bound algorithm performance is based on: 1. The search tree enumeration,
2. The lower bound determination,
3. A heuristic or polynomial method that makes it possible to construct a good feasible solution.
5.1 Search tree enumeration: the enumeration tree is constructed by adding a
new facility j at each step k. This facility becomes the main facility of the nodes
M(j,k) of N(j) not yet covered and a extra facility for the others. Let’s consider now the objective function. On one hand, we pay bj to position j. On the other hand, we gain = ∑ ( , ) .
The profit is so pjk=bj- vjk. If pjk<0, site j can be rejected from the solution. The ratio rjk= bj/ajk measures the profitability of the facility selection j in step k. The sites’ selection is based on a prioritization list. This list can be static (when it is once and for all fixed at the beginning of the enumeration) or dynamic (when it is reconstructed each time a decision is taken). Here the enumeration tree is built dynamically by considering the facilities with a decreasing profitability rjk.
5.2 Heuristics:
Two greedy heuristics have been retained here.
The first one consists in choosing in every step the site j given that the maximum profitability rjk and in taking it as the main facility of all nodes that are not yet covered.
The second heuristic is built on the same principle by retaining the site j with the maximum profit pjk.
5.3 Upper bound:
Here again we have retained two greedy heuristics: • The first is based on the demand nodes, • The second is based on the facilities.
To obtain the first upper bound, we retain as main facility of any node i not covered the site j not selected of maximum profitability
To obtain the second upper bound, we retain at step k, the PMax-k facilities not selected with maximum gain.
We do not detail here the branch and bound and its performances. Nevertheless, up to 60 facilities, the optimal solutions have been obtained in less than 15 minutes (fixed time deadline).
6 Numerical Application and Discussion
Let’s consider the problem described in section 3 and the model proposed to solve it. If we are looking to maximize the profit (turnover minus rental costs), then we obtain the following solution (Fig. 2). The left side of the figure indicates the opened facilities while the right side gives the number of facilities that cover a spot.
Fig. 2. First solution for 20 facilities: Solution 1 in Table 1.
Within this solution, 18 demands on 1544 are not satisfied (1.17 %) and the multi-coverage is more or less similar in the 3 zones. This result is presented in Tab. 1.
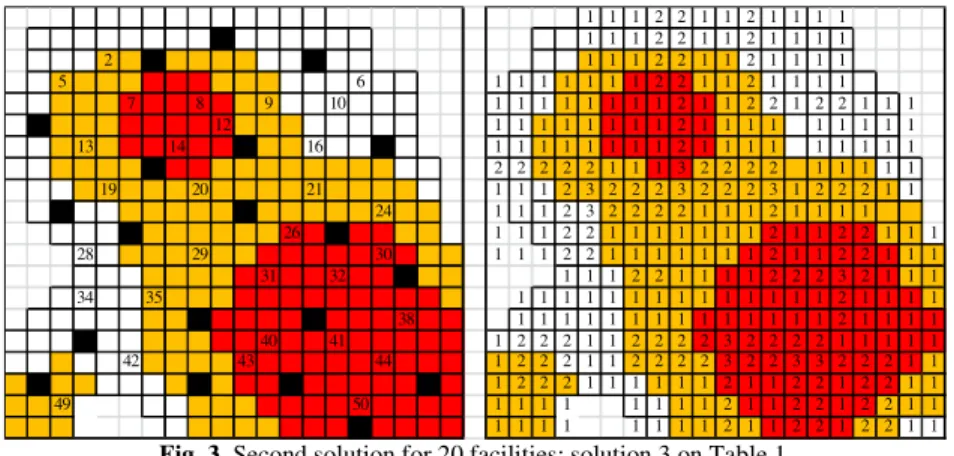
The Fig. 3 proposes an alternative solution, also for 20 facilities (black spots). Regarding this second solution, a light increase of the unsatisfied demand appears (21 instead of 18, or 1.36%). The zone 3 is now favored comparing to zone 1 (see table 1). Moreover, if we consider the uncertainty that exists on the demand associated to each part of the network, the decision-maker should retain this second solution. Our objective consists in supporting decision by proposing to the decision-maker several alternatives and their associated impacts in terms of effectiveness and resiliency.
Fig. 3. Second solution for 20 facilities: solution 3 on Table 1.
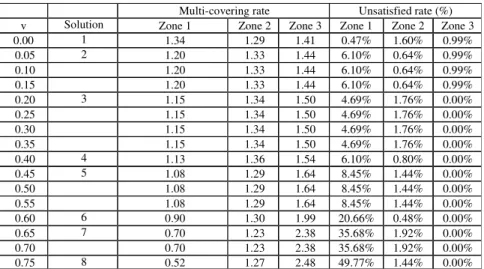
The Table 1 shows an experiment plan on which we have applied a value p1=-v to zone 1, p2=0 to zone 2 and p3=+v to zone 3. The objective is to find a solution that allows maximizing the resiliency (multi-covering) of the strategic zone (zone 3 in this case) and limiting the unsatisfied demand of low-potential zone (zone 1 in this case), despite of resources reduction (from 50 to 20 facilities).
1 1 1 1 1 1 1 1 1 2 1 1 1 1 1 1 1 1 1 1 1 1 1 1 2 1 1 1 1 2 3 4 1 1 1 1 2 2 2 2 2 2 1 1 1 1 5 6 1 1 2 2 1 1 2 2 2 2 2 2 1 1 1 1 7 8 9 10 1 2 3 3 2 2 2 1 1 1 1 2 2 2 3 3 1 1 1 11 12 1 2 2 2 1 1 1 1 1 1 1 1 1 1 2 2 1 1 1 13 14 15 16 17 1 2 2 2 1 1 2 2 2 2 2 1 1 1 2 2 1 1 1 18 1 2 2 2 1 1 1 1 1 1 1 1 1 1 2 2 1 1 1 19 20 21 1 1 1 1 1 1 1 1 1 1 1 1 1 2 2 1 1 1 22 23 24 1 1 1 1 1 1 1 1 1 1 1 1 1 1 1 25 26 27 1 1 1 1 1 1 1 1 2 2 1 1 1 1 2 2 2 2 1 28 29 30 1 1 1 2 2 1 1 1 1 1 1 1 1 1 2 2 2 2 1 31 32 33 1 1 1 2 2 1 1 1 1 1 1 1 1 1 2 2 2 2 1 34 35 2 2 2 3 3 1 1 1 1 1 1 1 1 1 2 2 2 2 1 36 37 38 1 1 1 2 2 1 1 1 1 1 1 1 1 1 2 2 2 2 1 39 40 41 1 2 2 2 2 2 2 2 2 1 2 1 1 1 2 1 2 2 2 1 42 43 44 1 2 2 2 1 1 1 1 1 1 2 1 1 1 2 1 2 2 2 1 45 46 47 48 1 2 2 2 1 1 1 1 1 1 2 1 1 1 2 1 2 2 2 1 49 50 1 1 1 1 1 1 1 1 2 1 1 1 2 1 2 2 2 1 1 1 1 1 1 1 1 1 2 1 1 1 1 1 1 1 1 1 1 1 2 2 1 1 2 1 1 1 1 1 1 1 1 2 2 1 1 2 1 1 1 1 2 3 4 1 1 1 2 2 1 1 2 1 1 1 1 5 6 1 1 1 1 1 1 1 2 2 1 1 2 1 1 1 1 7 8 9 10 1 1 1 1 1 1 1 1 2 1 1 2 2 1 2 2 1 1 1 11 12 1 1 1 1 1 1 1 1 2 1 1 1 1 1 1 1 1 1 13 14 15 16 17 1 1 1 1 1 1 1 1 2 1 1 1 1 1 1 1 1 1 18 2 2 2 2 2 1 1 1 3 2 2 2 2 1 1 1 1 1 19 20 21 1 1 1 2 3 2 2 2 3 2 2 2 3 1 2 2 2 1 1 22 23 24 1 1 1 2 3 2 2 2 2 1 1 1 2 1 1 1 1 25 26 27 1 1 1 2 2 1 1 1 1 1 1 1 2 1 1 2 2 1 1 1 28 29 30 1 1 1 2 2 1 1 1 1 1 1 1 2 1 1 2 2 1 1 1 31 32 33 1 1 1 2 2 1 1 1 1 2 2 2 3 2 1 1 1 34 35 1 1 1 1 1 1 1 1 1 1 1 1 1 1 2 1 1 1 1 36 37 38 1 1 1 1 1 1 1 1 1 1 1 1 1 1 2 1 1 1 1 39 40 41 1 2 2 2 1 1 2 2 2 2 3 2 2 2 2 1 1 1 1 1 42 43 44 1 2 2 2 1 1 2 2 2 2 3 2 2 3 3 2 2 2 1 1 45 46 47 48 1 2 2 2 1 1 1 1 1 1 2 1 1 2 2 1 2 2 1 1 49 50 1 1 1 1 1 1 1 1 2 1 1 2 2 1 2 2 1 1 1 1 1 1 1 1 1 1 2 1 1 2 2 1 2 2 1 1
How to Maintain the Network Resilience and Effectiveness 145
The first part of the Table 3 (multi-covering ratio) gives the average number of facilities that cover a slot of each zone 1, 2 or 3. The second part (unsatisfied demand ratio) indicates the percentage of turnover that has been lost in each zone.
Table 1. Numerical results.
If v=0, then we are just looking for to maximize the profit (turnover minus rental costs of the shops). Without favoring a zone regarding another one, there is very few difference between the multi-covering ratio of each slot. This rate evolves from 1.29 for zone 2 to 1.41 to zone 3. The unsatisfied demand ratio is low and varies from 0.47% in zone 1 to 1.60 % in zone 2.
When v increases, we observe that the solutions evolve step by step. In this table, we show 8 different solutions corresponding to v={0; 0.05; 0.20; 0.40; 0.45; 0.60; 0.65; 0.75}. We can remark that the multi-covering ratio – that is representative of the resiliency capability of the network - decreases continuously from a solution to another one (from 1.34 to 0.52). At a same time, this ratio increases for zone 3 from 1.41 to 2.48. At the opposite, the unsatisfied demand ratio increases, particularly when v is upper than 0.60. Based on our objective, the decision-maker should retain solution 3 or 4.
This paper presents a simplified case, treating each facility equally in terms of operating costs, benefits and homogeneous coverage. In further works, we will propose a new model able to avoid this limitation and to get closer to reality. Another perspective consists in considering randomly distributed demand points.
Multi-covering rate Unsatisfied rate (%)
v Solution Zone 1 Zone 2 Zone 3 Zone 1 Zone 2 Zone 3
0.00 1 1.34 1.29 1.41 0.47% 1.60% 0.99% 0.05 2 1.20 1.33 1.44 6.10% 0.64% 0.99% 0.10 1.20 1.33 1.44 6.10% 0.64% 0.99% 0.15 1.20 1.33 1.44 6.10% 0.64% 0.99% 0.20 3 1.15 1.34 1.50 4.69% 1.76% 0.00% 0.25 1.15 1.34 1.50 4.69% 1.76% 0.00% 0.30 1.15 1.34 1.50 4.69% 1.76% 0.00% 0.35 1.15 1.34 1.50 4.69% 1.76% 0.00% 0.40 4 1.13 1.36 1.54 6.10% 0.80% 0.00% 0.45 5 1.08 1.29 1.64 8.45% 1.44% 0.00% 0.50 1.08 1.29 1.64 8.45% 1.44% 0.00% 0.55 1.08 1.29 1.64 8.45% 1.44% 0.00% 0.60 6 0.90 1.30 1.99 20.66% 0.48% 0.00% 0.65 7 0.70 1.23 2.38 35.68% 1.92% 0.00% 0.70 0.70 1.23 2.38 35.68% 1.92% 0.00% 0.75 8 0.52 1.27 2.48 49.77% 1.44% 0.00%
References
1. Berlin. G.M. and Liebman J.C. (1974). Mathematical analysis of emergency ambulance location. Socio-Economic Planning Sciences. Volume (8). pp. 323–8. 2. Berman O. Drezner Z. Krass D.(2010) - Generalized coverage: New developments in
covering location models. Computers & Operations Research. volume (37) Issue: 10 pp. 1675-1687
3. Church R.L. and ReVelle C.S. (1974). The maximal covering location problem. Papers of the Regional Science Association. Volume (32). pp.101–118.
4. Church R and Roberts K. (1983). Generalized coverage models and public facility location. Papers of the Regional Science Association. Volume (53). pp.117-135. 5. Erdemir. E. T.. Batta. R.. Spielman. S.. Rogerson. P. A.. Blatt. A.. Flanigan. M..
(2010). Joint ground and air emergency medical services coverage models: A greedy heuristic solution approach. European Journal of Operational Research 207 (4). pp. 736-749.
6. Fallah. H.. NaimiSadigh. A.. Aslanzadeh. M.. (2009). Covering problem. In Facility location: Concepts, models, algorithms and case studies. Heidelberg. Germany: Physica Verlag.
7. Farahani R. Asgari N. Heidari N. (2012). Covering problems in facility location: A review - Computers& Industrial Engineering Vol 62 Issue: 1. pp. 368-407
8. K. Hogan and C. ReVelle (1986). Concepts and applications of backup coverage. Management Science. 32. pp. 1434–1444
9. Kim. K.. Murray. A. T.. (2008.) Enhancing spatial representation in primary and secondary coverage location modeling. Journal of Regional Science 48 (4). 745{768. 10. Kolen. A.. Tamir. A.. (1990). Covering problems. In P. B. Mirchandani and R. L.
Francis (Eds.). Discrete location theory (pp. 263-304). New York. US: Wiley-Inderscience.
11. Toregas. C.. Swain. R.. ReVelle C. S. and Bergman L. (1971). The location of emergency service facilities. Operations Research. Volume (19). 1363–1373. 12. ReVelle. C.S.. Eiselt H.A. (2008). Daskin M.S. A bibliography for some fundamental
problem categories in discrete location science. European Journal of Operational Research. Volume (184). 817-848.