HAL Id: hal-01729364
https://hal.archives-ouvertes.fr/hal-01729364
Submitted on 12 Mar 2018
HAL is a multi-disciplinary open access
archive for the deposit and dissemination of
sci-entific research documents, whether they are
pub-lished or not. The documents may come from
teaching and research institutions in France or
abroad, or from public or private research centers.
L’archive ouverte pluridisciplinaire HAL, est
destinée au dépôt et à la diffusion de documents
scientifiques de niveau recherche, publiés ou non,
émanant des établissements d’enseignement et de
recherche français ou étrangers, des laboratoires
publics ou privés.
Gustavo Daniel Gonzalez Granadillo, Jose Rubio-Hernan, Joaquin
Garcia-Alfaro
To cite this version:
Gustavo Daniel Gonzalez Granadillo, Jose Rubio-Hernan, Joaquin Garcia-Alfaro. Using an event data
taxonomy to represent the impact of cyber events as geometrical instances. IEEE Access, IEEE, 2018,
6, pp.8810 - 8828. �10.1109/ACCESS.2017.2740402�. �hal-01729364�
Using an Event Data Taxonomy to Represent the
Impact of Cyber Events as Geometrical Instances
Gustavo Gonzalez-Granadillo, Member, IEEE, Jose Rubio-Hernan, Member, IEEE,
and Joaquin Garcia-Alfaro, Senior Member, IEEE
Abstract—Visualization and simulation models used for the evaluation and selection of security countermeasures need ac-curate data to compute the impact of cyber events (e.g., ma-licious and benign actions). The information required to build appropriate impact models depends directly on the nature of the system. The information dealt by water supply systems, for instance, is particularly different from the information obtained by energy, telecommunication, transportation, or finance systems. It is therefore important to properly classify the data of security events according to the nature of the system. This paper pro-poses an event data taxonomy based on the system’s criticality, the geographical location of the target, the time at which the information is obtained by the attacker, and the nature of the data. A use case on the impact assessment of events originated in a critical infrastructure is presented to show the applicability of the proposed taxonomy.
Index Terms—Security, Detection Algorithms, Data visualiza-tion, Event Detecvisualiza-tion, Security Events, Event Data Taxonomies, Geometrical Models, Impact Assessment, Critical Infrastruc-tures.
I. INTRODUCTION
Information is a valuable asset that needs a particular pro-tection. Its value changes from organization to organization. For some kinds of information, e.g., in the medical sector, where a single event results into a life or death, the value of information cannot only be measured in terms of monetary values [1]. Several other parameters must be considered to assess such events.
Furthermore, information comes from different sources in different formats. Current information systems deal with huge amount of data coming from multiple sources. Security Infor-mation and Event Management Systems (SIEMs) are proposed as an excellent option to process such volumes of information within reasonable periods of time. The SIEM proposes a wider and complete view of the malicious entities, as well as the target system, making it possible to analyze and select the actions to be taken in order to mitigate the effects of the detected intrusions or attacks.
One question that security operators are frequently con-fronted to, is how to make sure that the deployed security action is the most suitable for the detected malicious event.
G. Gonzalez-Granadillo is with ATOS Spain, Atos Research & Innovation, Cybersecurity Laboratory, C/ Pere IV, 291-307, 08020 Barcelona, Spain. E-mail: gdgg@ieee.org
J. Rubio-Hernan and J. Garcia-Alfaro are with the Department of Networks and Telecommunication Services (RST), of T´el´ecom SudParis, Paris-Saclay University, CNRS SAMOVAR, France. E-mail: josemrubiohernan@ieee.org, jgalfaro@ieee.org
Manuscript received July 13, 2017; revised xxxx.
Visualization models have been widely proposed to help opera-tors in the evaluation and selection of security countermeasures against cyber attacks [2]–[7]. Most of the approaches rely on statistical data and expert knowledge to fill the parameters composing the model. A great level of accuracy and detail is required to compute the impact of malicious actions detected on the target system and therefore, to determine the most suitable solution.
Geometrical models [6]–[10] have been previously proposed to represent graphically the impact of cyber security events (e.g., attacks, countermeasures), as geometrical instances (e.g., polygons, polytopes, prisms). The approaches consider in-formation of many kinds (e.g., logical, physical, internal, external, etc.) to fill up the model and compute the shape and size of the cyber event. All geometrical models have been widely used and implemented in real case scenarios [11]– [13]. However, one issue that confronts the impact assessment of cyber security events is the identification of the type of information required to feed the model. Each system provides information according to the nature of the event (e.g., energy system provides data about power consumption, blackouts, voltage, etc; Dam systems provide data related to the level of water, turbidity, volume, etc). It is therefore important to properly classify the data of security events according to the nature of the system.
In this paper we propose to classify the information of events based on the criticality of the system (critical vs. non-critical), the time at which the information is obtained (a priory vs. a posteriori), the geographical location of the target system (internal vs. external), and the nature of the data itself (logical vs. physical). This taxonomy is not intended to be exhaustive, but it can be considered as a guide to help organizations in the assessment of their assets and events. The ultimate goal of this paper is to provide a security event data matrix that classifies the information of each type of system and provides the guidelines that operators and practitioners need in the appropriate assessment of cyber events and the use of simulation and visualization tools to evaluate and select security countermeasures.
The contributions on this article are summarized as follows: (i) An analysis on the required and optional information to feed risk assessment models; (ii) A taxonomy of security event data based on the criticality of the system, the time at which the data is obtained, the geographical location of the target elements, and the nature of the data; (iii) The deployment of the approach over a critical infrastructure with multiple events; and (iv) A security event data matrix that
provides the guidelines for the appropriate assessment of cyber events in the process of evaluation and selection of security countermeasures.
The remaining of the paper is structured as follows: Section II introduces the state of the art in visualization models for countermeasure selection III defines the proposed security event data classification and gives examples of the required and optional information to be used in the impact analysis process. Section V discusses about the impact assessment process for the evaluation and selection of security countermeasures. Section VI illustrates the applicability of the model by im-plementing a use case example from a critical infrastructure scenario. Related work are presented in Section VII. Finally, conclusions and perspective for future work are presented in Section VIII.
II. VISUALIZATIONMODELS FORCOUNTERMEASURE
SELECTION
The current state of the art in visualization tools propose a wide range of models (e.g., geometrical models [6]–[13] and graphical models [14]–[16]) to estimate the impact of cyber security events and to select countermeasures accordingly. This section presents the different visualization models that use geometry as a tool to compute the impact of cyber attacks and security countermeasures within an information system.
A. Polygonal Models
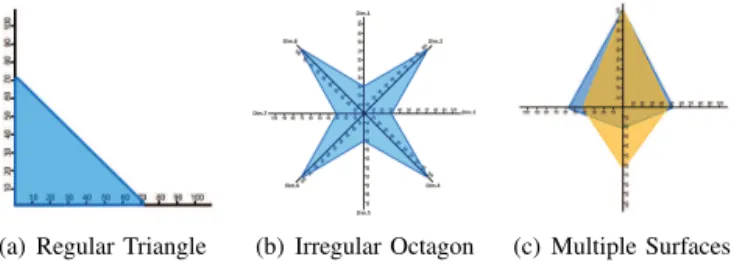
Polygonal models have been proposed to calculate the im-pact of cyber events in a 2-dimensional system. The approach considers information about all entities composing an informa-tion system (e.g., users, IP addresses, communicainforma-tion proto-cols, physical and logical resources, etc.), as well as contextual information (e.g., temporal, spacial, historical conditions) to plot cyber attacks and countermeasures as polygons of n sides. A variety of geometrical instances (e.g., regular and irregular polygons such as: line segments, triangles, squares, pentagons, etc.) results from the analysis of the entities’ information included in a system, attack and/or countermeasure [9].
(a) Regular Triangle (b) Irregular Octagon (c) Multiple Surfaces
Figure 1: Visualization of Events as Polygons Each side of the polygon is computed as the contribution of the entity in the execution of an event. The contribution for the user account dimension, for instance, can be evaluated as the number of users affected by a given attack over the total number of active users from the system. Examples of visualization of attacks and countermeasures in the polygonal system are shown in Figure 1.
B. 3D Models
We identified three main dimensions that contribute directly to the execution of a given attack: User account (subject), Resource (object), and Channel (the way to execute actions, e.g., connect, read, write, etc). This latter is represented as the transitions between subjects and objects. For instance, in order to access a web-server (object) of a given organization, a user (subject) connects to the system by providing his/her log-in and password (action) [8].
(a) Single Volume (b) Partially Joint Vol-umes
(c) Totally Joint Vol-umes
Figure 2: Visualization of Events as Parallelepipeds The projection of the three axis in our coordinate system generates a parallelepiped in three dimensions. The volume of this parallelepiped is equal to the absolute value of the scalar triple product of all three vectors. The volume calculation requires the computation of the contribution of each axis represented in the coordinate system. This contribution is determined as the sum of each set of axis entities (e.g., user account type, port class, resource type) times its associated weighting factor. Examples of visualization of attacks and countermeasures in a 3D system are shown in Figure 2.
C. Polytopic Models
An extension of the 3D model into an n-dimensional model is proposed to represent attacks and countermeasures as poly-tope instances [12]. The model considers information about user accounts (subjects), resource (objects), and channels (the way subjects have access to objects), as well as, temporal con-texts (e.g., granted privileges only during working hours), spa-tial contexts (e.g., granted privileges when connected within the company premises), and historical contexts (e.g., granted privileges only if previous instances of the same equivalent events were already conducted).
(a) Events Represented as Lines (1-orthotope) (b) Events Represented as Surfaces (2-orthotope) (c) Events represented as Cubes (3-orthotope)
Figure 3: Visualization of Events as Polytopic Instances Using the polytope-based model, it is possible to represent the impact of cyber events in one dimension (i.e., lines), in two dimensions (i.e., surfaces), in three dimensions (i.e., volumes), and in n-dimensions (i.e., n-orthotopes). It is important to
note, however, that the orthographic projection of instances in more than three dimensions results into complex figures that only provides a general overview of the size and density of the represented event. Unions and intersections are therefore difficult to be plotted from the projected events. Examples of visualization of events as Polytopic instances are shown in Figure 3.
D. Prismatic Models
A prism-based model is proposed to represent cyber security events (e.g., attacks, countermeasures) as prismatic instances of n-sides. The base of the prism integrates the information from the target’s side (internal entities), whereas the height of the prism integrates the information from the attacker’s side (external entities).
(a) Attack represented as a regular prism
(b) Attack represented as an irregular prism
(c) Multiple Events rep-resented as Prisms
Figure 4: Visualization of Events as Prismatic Instances The approach considers information about all entities posing an information system (e.g., users, IP addresses, com-munication protocols, physical and logical resources, etc.), as well as contextual information (e.g., temporal, spacial, historical conditions), and the attacker’s information (e.g., knowledge, motivation, skills, etc.), to plot cyber attacks and countermeasures in a geometrical system. The ultimate goal of our model is to help organizations make the most cost-effective decisions in minimizing the risk of the studied cyber events [7].
A variety of geometrical instances (e.g., regular and ir-regular prisms) results from the analysis of the internal and external information related to a given cyber security event. Examples of visualization of attacks and countermeasures in an N-Prismatic system are shown in Figure 4.
E. Other Visualization Models
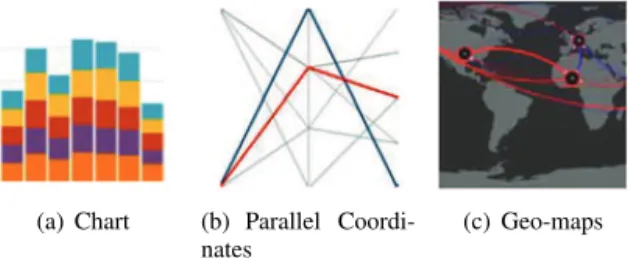
Graph-based visualization models are widely used and proposed in the literature. They are based on elements of Visual Grammar e.g., objects (dot, line, plane), abstract struc-tures (gradation, concentric radial, centrifugal), specific objects (shape, size, color), acts (repeat, mirror reflection, rotation) and relationships (symmetry, balance, cluster). The combinations of these elements create different graphical models that are used in the representation of security actions.
Examples of graph models are charts, parallel coordinates, trilinear coordinates, tree maps, geo-maps, as seen in Figure 5. More details about graph-based models can be found in [17].
(a) Chart (b) Parallel Coordi-nates
(c) Geo-maps
Figure 5: Visualization of Events as Graph Instances
III. SECURITYEVENTDATATAXONOMY
Security Event Data is defined as all relevant information considered to have potential security implications to the system or network that may require further action (e.g., analysis, trace-back, reaction). For the scope of this article, we use the terms events, actions, and incidents indistinctly. A set of individual actions performed either by the attacker (i.e., malicious actions executed in order to exploit a system’s vulnerability) or by the target system (i.e., benign actions executed as a response to an adversary) is considered as a cyber security event. In addition, faults, errors, and failures, whether intentionally or not, are equally considered as cyber security events. These latter generate a wide range of information that, if treated properly, can be useful to analyze the source and consequences of such events.
This article aims at organizing the information of security events based on their nature and usefulness. We consider any information that can potentially impact organizational opera-tions (e.g., mission, funcopera-tions, image, reputation), assets (phys-ical or log(phys-ical resources), or individuals (personnel, providers, customers) through an information system via unauthorized access, destruction, disclosure, modification of information, and/or denial of service.
Security event data are useful to identify threats, define risks, and determine the impact of malicious actions (e.g., attacks) and benign actions (e.g., countermeasures) in an information system. Our proposed taxonomy is depicted in Figure 6, in which we identify relevant information for critical and non-critical systems.
!"#$%$%&'%' ()*%*+', -./%#0/ 12$3()*%*+', -./%#0/ 4$%#)$', !5%#)$', !$#)6. 7'%#) 8)'$/92)% (.:#);-./%#0/ <=./*+',;-./%#0/ >26*+', <=./*+', ? 9)*2)* ?;92/%#)*2)* 8#,#+20 @*$'$+# A#',%=
Figure 6: Security Event Data Taxonomy
Information about critical systems is divided according to the system’s nature (e.g., energy, water, telecommunications, finance, health, transportation), and further classified as cyber
systems(based on ICT solutions); and physical systems (com-posed of physical processes managed by, e.g., control-theoretic
solutions). It is worth noting that the interaction between the cyber systems and the physical systems is more and more common moving them to the cyber-physical systems (tradi-tional control systems upgraded by novel ICT solutions, and combining cross-layer data). Information about non-critical systems is divided into internal information, further classified as logical and physical data; and external information, further classified as a priori and a posteriori data. The remaining of the paper details each type of data from our proposed classification.
A. Information about Critical Infrastructures
Critical Infrastructures rely on the Supervisory Control And Data Acquisition (SCADA) technology to monitor industrial and complex infrastructures based on Networked Control Sys-tems (NCSs). They include sectors that account for substantial portions of national income and employment such as energy, ICT, finance, health, food, water, transport, and government. Most of these sectors use Industrial Control Systems (ICS), in instance to provide control of remote equipment (using typically one communication channel per remote station) [18]. Recently a coined cyber-physical system (CPS) term in-tegrates a physical infrastructure and a cyber framework of these critical systems [19] . The technology evolution brings the traditional systems towards a combination of two systems [20]: (i) The physical systems which encompasses the physical framework (composed of sensors, actuators, and other devices that interact with the physical processes); and (ii) The cyber systems, encompasses the communication and computation framework, which host the SCADA technology. These two types of systems form the two layers of the cyber-physical systems. These latter combine the control strategies, traditionally used to manage the physical layer, with the cyber strategies, in order to monitor the physical layer.
1) Energy Distribution:: this category includes the produc-tion, storage, transportaproduc-tion, and refining of electrical power, gas and oil. The information used in the energy distribution process includes classification of losses as technical and non-technical. The former originates due to physical reasons and depend on the energy flowing through the network, the nature of transmission lines, and transformers. The latter includes measurement errors, recording errors, theft, and timing differ-ences [21], i.e., information generated from external action or conditions that are not taken into account in the computation of the control of the physical systems. Examples of technical losses are underground cables and overhead lines. The infor-mation on this category includes the type of conductor (e.g., copper, aluminum); conductor temperature (e.g., 0 Celsius, losses due to heating); energy demand (e.g., 100 MWh/year); energy consumption (e.g., kWh, kVAh); load (e.g., heating load, peak load); peak load times (e.g., winter afternoons). In addition, technical losses can be originated due to the fact that electricity is transported over long distances and the quality of records can be low. Examples of data retrieved in this category include transformer distance (e.g., Kms); transformer material (e.g., iron); power voltage (e.g., high voltage, 132,000 volts); transformer temperature (e.g., heating level, mean temperatures).
Examples of non technical losses include errors (e.g., read-ing errors, timeswitch errors); timread-ing differences (e.g., meter reading period, absolute differences); profiling (e.g., profile coefficient, street lighting profiles); data collection frequency (e.g., monthly, annually); reconciliation (e.g., settlement rec-onciliation, post-final reconciliation run); service status (e.g., active, idle, energisation).
Other types of data found in energy distribution systems include meter identification (meter point administration ser-vice, meter point administration number); meter type (e.g., passive, dynamic); Calculation Factor (Group Correction Fac-tor, Loss FacFac-tor, Power Factor); agents (e.g., distributors, suppliers, collectors); wiring system for supplying electricity (e.g., three phase, single phase); sources (source of technical losses, potential source of error); electrical equipment (e.g., transformers, electrical switches); media type (e.g., fiber op-tics, leased line, Public Switch Telephone Network, Global System for Mobile communications, General Packet Radio Service, Terrestrial Trunked Radio); communication proto-cols (e.g., Long-Term Evolution, High Performance Radio LAN); Human Machine Interface (e.g., video wall, client console); switch brand (e.g., Cisco, HP, DIGI); Distribution Management System (e.g., high, medium, or low voltage), security device (e.g., firewall, load balancer, IDS, IPS, anti-virus, SIEM).
2) Water Supply:: this category includes services that maintain, store, pump, and process water used primarily for drinking.
Several parameters are monitored to assess the safety of a water supply infrastructure (i.e., dam) and foresee possible failures or anomalies [22], [23]. Each parameter is measured using different sensors (e.g., Wireless Sensor Networks). The most common sensors used in monitoring applications are: inclinometers and tiltmeters, used for the measurement of lateral earth movements and wall tilt/rotation; crackmeters, used to monitor movement of cracks and joints on the dam surface and are installed on opposite sides of wall cracks to foresee cracks enlargements; jointmeters, deployed to monitor expansion and contraction of a joint, e.g., between adjacent blocks of a concrete dam; earth pressure cells, used to measure the total pressure for embankment dams; piezometers, used to measure fluids pressure in the embankments or in the boreholes, as well as to monitor the seepage, measure uplift pressure and evaluate the shear strength; turbidimeters, used to measure the water turbidity and to identify signs of internal erosion and piping that can lead to the failure of the dam’s walls; thermometers, used to measure water temperature and for environmental thermal monitoring to prevent damages to the water life habitat.
In addition to sensors, other components take part of a water supply infrastructure. Examples of such components are: Programmable Logic Controllers - PLCs (e.g., integrated, compact, large); data collectors (e.g., data storing units, com-mand and data gateways, signal buses); control devices (e.g., workstation, database, Human Machine Interface); monitoring device (e.g., Master Control Unit, Remote Master Unit). These components use standard protocols (e.g., TCP/IP, Collection Tree Protocol, USB serial communication port, Modbus,
Dis-tributed Network Protocol, Inter-Control Center Communi-cations Protocol); they are connected to a public network for exchanging information and data with remote sites a connecting links (e.g., satellite and radio links, telephone lines, Internet). They are protected using security mechanisms (e.g., Firewalls, VPNs, Intrusion Detection Systems); such mecha-nisms allow for software controls (e.g., patching, automatic updates, component changes).
3) Transportation:: this category includes all the trans-portation system services [25] divided into four main sub-categories: (i) Aviation Service, which includes e.g., air traffic control systems, commercial and recreational aircraft, heli-port, aircraft repair stations, navigation aids, military airports; (ii) Highway and Motor Carrier, which include the roadways, bridges, tunnels, vehicles (e.g., school buses, motorcoaches, commercial and personal vehicles, trucks of dangerous ma-terial, police vehicles, emergency vehicles, etc.), traffic agement system, driver licensing systems, operational man-agement systems; (iii] Maritime Transport System, including waterway, ports, freight and passenger ships, cruise ship, fishing ships; (iv) Passenger and Freight Rail, including light rail, passenger rail, subway, high speed trains, tramways. Each of these subsectors have specific plans to manage and coordinate passengers and freight within the subsector and with the rest of subsectors. Some authors add also Pipeline Systems to carry e.g., natural gas as another subsector.
The transportation sector includes also general parame-ters (e.g., from compuparame-ters, communication or management point of views); communication technologies e.g., WiMAX, Wi-Fi, Bluetooth, ZigBee, Wireless Access for Vehicular Environment (WAVE), cellular, satellite, fiber optic, copper file; exchange information protocols (e.g. Vehicle-to-Vehicle (V2V), or Vehicle-to-Roadside (V2R)) [24]; network archi-tecture (e.g., public cloud, private cloud, collaborative cloud using clusters); important network parameters for safety trans-portation (e.g. bandwidth loss, latency, delay, fast access communication technology, channels, protocols, transmission range), and for security transportation (e.g., resilient security techniques, privacy techniques); storage (e.g., centralized or distributed database, public and private data); network man-agement (e.g., security planning, communication and coor-dination with industry stakeholder, government and private industry collaboration planning) [25]. In addition, we identify the following physical components: vehicles, ships, trains, infrastructures, human drivers, sensors, motors, surveillance cameras, traffic lights, railways, locals, devices materials, cables, remote workstation (nodes).
4) Financial Services:: this category includes services that manage monetary assets e.g., banks, stock exchanges, ATMs. The sources of financial data include: transactions, log data, events, emails, social media, sensors, external feeds, RFID scans or POS data, Free-form text, Geo-spatial, Audio, Still images/video [26]. Examples of financial data are: assets (e.g., current, non-current); liabilities (e.g., current, non-current); Equity; Financial facts (e.g., income, currency, budget); and cash flows (e.g., from operating activities, from investment activities, from financing activities).
Current Assets (e.g., cash, cash equivalents, trade, other
receivables, inventories, short-term financial assets, income taxes, other current assets); Non-current assets (e.g., prop-erty, plant, equipment, goodwill, intangible assets, investments accounted for using the equity method, long term financial assets, asset for retirement benefits, other non-current assets, deferred tax assets). Current Liabilities (e.g., trade and other payable, other short-term financial liabilities, income taxes payable, provisions, advances received, accrued expenses, ac-crued bonuses, other current liabilities); Non-current liabilities (e.g., long-term financial liabilities, liability for retirement benefits, provisions, other non-current liabilities, deferred tax liabilities); Equity (e.g., equity attributable to owners of the parent, capital stock, capital surplus, retained earnings, treasury stock, other components of equity, non-controlling interests).
Income (e.g., net income, cost of sales, gross profit, general selling and administrative expenses, research and development expenses, other operating income, other operating expenses, operating profit, financial income, financial expenses, share of profit of associates accounted for using the equity method, for-eign exchange gain, profit before tax, income taxes expenses, profit attributable to owners of the parent, profit attributable to non-controlling interests, basic earnings per share, diluted earnings per share); currency (e.g., USD, EUR, CNY); net sales (e.g., by product type, by country, by department, by period of time); budget (e.g., per account, per unit, per year). Cash flows from operating activities (e.g., profit before tax, depreciation and amortization, decrease/increase in trade receivable, in inventories, in trade payable, in consumption taxes receivable and payable, in a trade payable other, in advances received, in accrued bonuses, interest and dividend received, interest paid, income taxes paid); cash flows from investing activities (e.g., purchases of property, plant and equipment, purchases of intangible assets, purchases of in-vestments in equity instruments, acquisitions of subsidiaries or other businesses, net decrease/increase in short-term loans receivable); cash flow from financing activities (e.g., dividends paid, other, net cash provided by financing activities); General Cash flows (e.g., effects on exchange rate changes on cash and cash equivalents, net increase/decrease in cash and cash equivalents, cash and cash equivalents at the beginning of the term, cash and cash equivalents at the end of the term).
Additional information in this category include : organiza-tion (e.g., business unit, district, corporaorganiza-tion, parent company), Customer (e.g., ID, name, address, parent company, status), vendor (e.g., ID, description, type); invoice (invoice date, invoice item, due date, payment date); calendar time (e.g., date, month, quarter, year); company’s account category (e.g., cash, benefit allocation, business insurance, payroll tax); Ac-count classification (e.g., cost, revenue, liability, asset, equity); account type (e.g., salaries, commission, rent, insurance); sub-account type (e.g., asset insurance, travel insurance, laptop insurance); transaction code (e.g., revenue, income, tax, amor-tization); Employee (ID, name, description, active flag, title, rank).
Financial services also include technical equipment (e.g., ATM, database, servers, personal computers, hard drives, printers); physical storage (e.g., drawers, organizers, raks,
cabinets); physical documents (e.g., paper work, accounting books, financial statement printed documents); physical secu-rity devices (e.g., video surveillance, smoke detectors, access control devices, biometric devices); banking infrastructure (e.g., building, furniture, security rooms, counselor cabins, teller desks).
5) Health Services:: this category includes medical care providers and the health care data at the individual patient level or on a particular population. Examples of health-care
data used by a health organization1 include: Health Services
(e.g., percentage of staff employed in medical/dental, nursing, health and social care professions, management/administra-tion, consultant doctors employed in public services, non-consultant hospital doctors, health expenditure in millions of Euro, percentage gross non-capital voted expenditure by pro-gram, current health care expenditure); Primary Care Services (e.g., reimbursement service scheme, percentage of population with medical cards by age group, prescription items dispensed under general medical service, claims, payments, community schemes); Private Health Insurance (e.g., percentage of pop-ulation covered by private health insurance, by gender, by age group, by county); Disability (e.g., number of people with physical and sensory disability, number of people with intellectual disability, degree of disability).
Hospital care provides demographic, administrative and clinical data on all inpatient and day case discharges from publicly funded hospitals. Examples of these data are: Hospital activity (e.g., discharges, bed days, length of stay by county, by gender, by age; number of discharges by principal diagnoses, by principal procedure; emergency department, outpatient attendances, average length of stay for inpatients in public hospitals by age group, number of hospital discharges for selected conditions, rate of discharges); weighting list (e.g., adult inpatient waiting list by hospital, monthly child inpatient waiting list, outpatient waiting list by specialty); Psychiatric data (e.g., psychiatric hospitals, psychiatric units, admission rate per population by age group, number of inpatient admis-sions per year by gender, admission change percentage).
For comparative studies, enhancing forecasts, devising strategies to reduce medical expenses or evaluating attempts to change patient or provider behavior, additional data are re-quired. Examples of these data are: hospital inpatient (e.g., dis-charge, diagnose, procedure, length of stay, age, sex, charges), hospitalized patients (e.g., pediatric inpatient discharges, am-bulatory surgery patients, emergency patients); claims (e.g., in-patient claim, outin-patient claim, medical eligibility, utilization, payment); medicare service (e.g., medical equipment, home health, hospice, inpatient, outpatient, physician, skilled nursing facility); pharmaceutical dispenses (e.g., Drug dispense event information dispense date, pick-up date, cancellation date, Patient, prescriber, dispenser, and facility information); Drug information details (e.g., Drug Identification Number (DIN), Anatomic Therapeutic Classification (ATC) code, quantity, compound components).
Information about the population of a city, a region, or 1An Roinn Slainte, Ireland Department of Health, available at
http://health.gov.ie/
a country is useful in developing statistics and health care strategies. Examples of these data are: Demographics (e.g., population estimates for regional authority areas by age group, cumulative percentage increase in population, actual popu-lation by age group, regional popupopu-lation projection); Life expectancy (e.g., life expectancy by location, by age, by gender, life expectancy at birth, healthy life years); Birth (e.g., numbers, crude rates, total fertility rates, percent outside mar-riage, annual number of births, birth rates by mother’s age, by marital status, by sex of infant, perinatal data); Mortality (e.g., principal causes of death numbers, aged standardized death per population, percentage distribution, mortality by county, by age, by gender, single year age standardized mortality, potential years of life lost, infant mortality.
Optional information include data about productivity (e.g., productivity of physicians in group practices, number of visits in group practices by specialist); hospital statistics (e.g., name, address, phone number, teaching programs, financial status, services offered, number of admissions and outpatient visits); codes (e.g., international classification of diseases, codes of diseases used by hospitals for inpatient and outpatient care, codes for procedures performed by physicians); provider in-formation (e.g., identifier, specialty, role, location, referring provider identifier and discipline); service additional informa-tion (e.g., health service code, date of service, amount paid, role, trays, time surcharges, total), service units paid and calls claimed (e.g., facility, diagnostic codes, shadow billed claims). In addition, health services include infrastructure (e.g., building, furniture, location, physical areas, room dimensions); essential medical devices (e.g., Protective breathing masks, head covers, protective goggles, gloves, coats / gowns, shoe covers), respiration medical devices (e.g., laryngoscope blade, endobronchial and endotracheal intubation tube, tracheo-bronchial aspiration tube, respirator circuit, high-concentration oxygen masks, Oxygen goggles); blood circulation devices (short peripheral catheter, infusion, long central catheter); di-gestive devices (e.g., aspiration tubing, enteral feeding tubing, lavage and bladder irrigation tubing); ; emergency devices (e.g., drones); robot-assisted surgical machines; personal real-time devices (e.g. real-real-time EKG device) [27].
6) Telecommunications:: this category includes services that facilitate the electronic transfer of information, e.g., telephone companies, Internet service providers, and their hardware infrastructure. This sector, managed by Information and Communication Technology (ICT) companies, is classified as critical because it provides the facilities necessaries to manage and enable the communications among the different devices in other critical infrastructure sectors. We can separate five different areas [28]: (i) Broadcast medium frequency (e.g., radio), very high frequency -VHF (e.g. radio and TV), and ultra-high frequency -UHF (e.g., TV); (ii) Cables, e.g., copper, fiber, coaxial cables and physical networks (e.g., hy-brid fiber/coaxial (HFC) network); (iii) Satellites and antennas in terrestrial stations (e.g., navigation, bidirectional transmis-sion of data, voice and video); (iv) Wireless, e.g., WiFi, unlicensed wireless, high-frequency radio, WIMAX, GSM, GPRS, EDGE, UMTS, LTE; (v) Wireline, e.g., via coaxial, copper, fiber transmission media, circuit and packet-switched
networks (e.g., private companies data, telephone networks, public switched telephone network -PSTN, the Internet) .
The telecommunication sector involves both physical and cyber infrastructures. Physical telecommunication infrastruc-tures are composed of buildings, antennas, satellites, switch, towers, stations, cables (e.g., fiber, copper, coaxial), user terminals (e.g., PC, tablet, smartphone), among others. Cyber telecommunication infrastructures are composed of network protocols (e.g., protocol layering and software layering); network security devices (e.g., firewall, antivirus); network technologies and software e.g., Ethernet, Token ring, Asyn-chronous Transfer Mode (ATM), Fiber Distributed Data Inter-face (FDDI), Frame Relay, Synchronous Optical Networking (SONET), Multiprotocol Label Switching (MPLS), Software Defined Networking (SDN); user applications (e.g., mobile and computer applications).
This sector has few significant dependencies on other critical infrastructures, however, most of the critical infrastructures have a high dependency on telecommunications. For this reason, we can conclude that physical devices as sensors or actuators used in other critical infrastructures may be included in this category as terminals of the infrastructure. In addition, new technologies and facilities are developed daily in this sector, for example, related to The Internet of Things (IoT) as smart home technologies or smart cities.
B. Information about Non-Critical Infrastructures
The primary data needed for a risk assessment should include the organization’s mission statement, a list of programs they have developed in support of that mission, a list of assets by classification that support the programs, the organization’s functional organization chart, the relationship between the business functions and the physical property, existing coun-termeasures used to protect those assets, and any historical data relating to past security events [29].
The identification of methods in the system are proposed by Howard et al. [30] and further detailed by Manadhata and Wing [31]. An information system communicates with its environment through methods. These latter are entry/exit points that receive/send data directly or indirectly from/to the environment. Examples of a web server’s direct entry points are the methods in the web server’s API and the web server’s methods that read configuration files. An example of exit points are methods that write to a log file.
For events originating in Mobile Ad hoc Networks (MANETs), data can be defined based on the legitimacy of attacking node (e.g., internal, external node); based on the number of nodes involved (e.g., single, multiple), based on the exploited vulnerability (e.g., lack of security boundaries, lack of central management, scalability, cooperativeness); based on the targeted victim (e.g., host, network); based on the security violation (e.g., availability, confidentiality, integrity). More details on each type of data can be found in the work of Noureldien [32].
Other types of data in non-critical systems include penetrat-ing methods (e.g., password crackpenetrat-ing, social engineerpenetrat-ing, mas-querading); biometrics and physical tokens (e.g., fingerprint,
iris, voice recognition, signatures); defeating mechanisms and policies (e.g., challenges related to authentication, authoriza-tion, access controls and policies); and malicious code (e.g., virus, bugs, coding problems) [33]. Information about non-critical systems is further classified as internal and external data.
1) Internal Data: : Considering the characteristics of ac-cess control models [34], [35], we identify three types of information associated to a particular event: User account -a unique identifier for users in the system th-at -allows them to connect and interact with the system’s environment (e.g., super admin, system admin, standard user, guest, internal user, nobody); Resource - either a physical component, (e.g., host, server, printer), or a logical component, (e.g., files, records, database), of limited availability within a computer system; and Channel - the way to execute actions, (e.g. connect, read, write, etc). Channels can also regroup IP addresses, port numbers, protocols and all other kind of TCP/IP connections. More information about these data-types are found in the research of Gonzalez-Granadillo et al. [6], [8], [12].
In addition, we consider the notion of contexts proposed in the Organization based Access Control (OrBAC) model [36], [37], such as temporal conditions - granted privileges only during specific periods of time (working time, day time, night time, weekdays, weekends) or considering actions performed at a given time slot (e.g., connection time, detection time, time to react, time to completely mitigate the attack, recovery time, etc.); spatial conditions - granted privileges when connected within specific areas (e.g., user’s location, security areas, specific buildings, a country, a network or sub-network); and historical conditions - granted privileges only if previous instances of the same equivalent events were already conducted. For instance, in order to access a web-server (resource) of a given organization, an external user (user account) connects remotely (spatial condition) to the system by providing his/her login and password (channel) at nights (temporal condition).
Information security properties (e.g., confidentiality, in-tegrity, availability) are also a key aspect in the analysis of a cyber security event. An event can be associated to a particular issue compromising the system’s confidentiality (e.g., unauthorized access to sensitive information, disclosure resources, etc), integrity (e.g., unauthorized change of the data contents or properties, etc), or availability (e.g., unavailable resources, denial of service, etc). Internal information is further classified as Logical and Physical.
a) Logical Data: : Logical information corresponds to all intangible data associated to the target system that can be used by an adversary to execute an attack. Examples of logical data are proposed by Howard et al. [30] as business records, application’s information, and security issues. In terms of business records, we consider the organization’s proprietary In-formation (e.g., proprietary business processes, strategic plans, customer lists, vital records, accounting records). Application’s information considers resource consumption (e.g., CPU cycles, memory capacity, storage capacity, and I/O bandwidth); com-munication channels (e.g., sockets, RPC connections, named pipes, files, directories, and registries); and process targets
(e.g., browsers, mailers, and database servers).
Security issues consider alerts or alarm signals, access control violations, photo-ID alteration, noise in voice and video records. Examples of this category include the use of
security mechanismssuch as Transport Layer Security (TLS), expressing that the application uses HTTPS, or server side input validation; the use of cookies (considering the maximum number of cookies and the number of foreign cookies from other sites that the application sets during a session); the access
control method required (e.g., unauthenticated, authenticated, or root); and the access right required (e.g., read, write, execute, root).
In addition, Howard et al. [30] have identified several attack vectors to determine a relative attack surface of different Windows applications. Examples of such vectors include open sockets (e.g., TCP or UDP sockets on which at least one service is listening), active web handlers (e.g., http, nntp), dynamic web pages (e.g., .exe files, Active Server Pages files, and Perl script files), VBScript enabled (whether applications, such as Internet Explorer and Outlook Express, are enabled to execute Visual Basic Script).
For event notification messages using the Syslog protocol [38], useful information is associated to the facility responsible of the message (e.g., kernel, user, mail system, clock daemon, log alert); to the severity associated to the message (e.g., emer-gency, alert, critical, error, warning, debug), to the identified machine that originally sent the message (e.g., Fully Qualified Domain Name, IP address, hostname), and to the time at which the message was originated (i.e., timestamp).
The Intrusion Detection Message Exchange Format (ID-MEF) [39] identifies other fields of interest in the event data classification. The alert has been fired by an analyzer, from which we can derive the source, the target, the time at which the alert was created, the time at which the event was detected, the impact assessment, and information about the node or user that appears to be causing the event. In addition, we can also consider the information about the completion of the event (e.g., failed, succeeded); the confidence on the evaluation of the event (e.g., low, medium, high); and the algorithm used for the computation of the checksum (e.g., MD4, MD5, SHA1, SHA2-256, Gost).
b) Physical Data:: Physical information corresponds to all tangible elemets that interact directly or indirectly with the target system and whose intrinsec vulnerabilities can be used by an adversary to execute an attack. Examples of physical data are proposed by Norman [29] as people, technical and non-technical devices.
People, represents all internal user accounts (e.g., Key Se-nior Management, Management and Employees, Contractors, Vendors, Visitors, Customers).
Hi-tech devices correspond to information technology sys-tems (e.g., PCs, servers, laptops, tablettes, pads, mobile phones); office equipment (e.g., copiers, printers, furniture, cash registers); and security devices (e.g., sensors, intrusion detection systems, security information and event manage-ment systems, biometrical systems, physical access control systems).
Non-technical devices represent documents or equipment with low or no technical attributes. Examples of such de-vices are: lo-tech dede-vices (e.g., Access-controlled and non-access-controlled gates, doors, and barriers, lighting, signage, property-marking system, key-control system); no-tech devices (e.g., Policies and procedures, guard patrols and posts, inves-tigation programs, law enforcement liaison program, security awareness program, emergency preparedness program, disaster recovery program).
In addition, it is useful to identify the physical location of people (e.g., network administrator’s room, employees offices, guests rooms), physical location of high-tech devices (e.g., server’s room, control operation center’s location), physical location of network elements (e.g., router location, sensor’s physical location), information about the network topology (e.g., interconnection of network elements), location of lo-tech devices (e.g., printer’s location, lighting control room), location of no-tech devices (e.g., drawer that stores disaster recovery programs, policies and procedures).
2) External Data: : All information systems interact with people: internals, when they belong to the organization; and externals, otherwise. External people can have direct contact to the organization (e.g., vendors, visitors, customers) or indirect contact with the organization (e.g., competitors, intruders, attackers). For people with direct contact with the organization, we need to identify their occupancies (where they work and interact), the hours of occupancy, tasks, uses of hazardous materials or equipment, their needs for access, and their frequency of access [29]. It is also important to note any classic or specific threats against these people. People with indirect contact to the organization are seen as adversaries.
According to Krautsevich et al. [40], [41], adversaries can be either (i) omniscient, when they know all vulnerabilities and all possible patches of the system; (ii) deterministic, when they have a belief knowledge of the system and they choose the best possible action to break into the system; or (iii) adaptive, when they adapt the strategy to complete the attack, using updated knowledge about the system . In reality, attackers do not have the knowledge of all the system’s vulnerabilities. We concentrate, therefore, in deterministic and adaptive attackers. Data coming from these type of entities are considered in the remaining of this section as a priori and a posteriori data.
a) A Priori Data: : This classification considers the set of information about the system, possessed by an attacker before exploiting a given vulnerability. If the attacker has a priori knowledge about the operation of the entire system, he/she would be able to inflict a much severe attack. We dis-tinguish two types of a priori knowledge: the knowledge about the information system, and the knowledge about the attack. The former considers the understandings that the attacker has about the system, whereas the latter considers the skills and experience of the attacker in executing a given attack.
About the Information System: : Following the common vulnerability system scoring method (CVSS) [42], [43], we consider in this category, the known vulnerabilities of the in-formation system that can be exploited by an attacker to access the system (e.g., access vector, complexity, authentication type,
required privilege, exploitability, report confidence, potential collateral damage, user interaction).
The access vector category considers the way a vulnerability can be exploited by an attacker in the system (e.g., physical, local access, adjacent network access, network access). The
access complexity includes the complexity level required for an attacker to exploit a vulnerability once he/she has gained access to the target system (e.g., high, medium, low). The
authentication type category considers the number of times an entity must authenticate to a target in order to exploit a vulnerability (e.g., multiple, single, none). The required
privilege category describes the level of privileges needed for an attacker to successfully exploit a vulnerability in the system (e.g., none, low, high).
The exploitability category considers level of difficulty at which a vulnerability can be exploited (e.g., unproven, proof of concept, functional, high, not defined). The report confidence category identifies the degree of confidence in the existence of the vulnerability and the credibility of the known technical details (e.g., unconfirmed, uncorroborated, confirmed, not de-fined). The potential collateral damage category considers the potential for loss of life or physical assets through damage or theft of property or equipment (e.g., low, low-medium, medium, medium-high, high, not defined). The user
interac-tion category considers the requirement for a user, other than
the attacker, to participate in the successful exploitation of a vulnerability (e.g., none, required).
About the Attack: : Based on the taxonomy of cy-ber events proposed in [48], and the research proposed by Cayirci and Ghergherehchi [3], we consider in this category information about the attacker (e.g., type, location, quantity, motivation, technique, mobility), and the attack (e.g., cause, affected service, objective, impact).
The attacker type classification includes all threat agents that are primarily responsible for the cyber event (e.g., malicious agents, organizations, foreign governments, natural disasters, or human errors). In terms of location, attackers can be located within the network (i.e., insider), or outside the netzork (i.e., outsider). The quantity category defines three types of attackers: single, multiple, or coordinating multiple. These latter defines the case when multiple attackers collaborate with each other.
The attacker’s motivation as proposed by Bielecki and Quirchmayr [2], and Shinder [44] considers the different goals (motives) that can encourage an attacker to exploit a vulner-ability on the system such as low (e.g., no motivation, just for fun), medium (e.g., political motives), and high (e.g., for monetary profit; anger, revenge and other emotional drivers; sexual impulses; psychiatric illness). The technique includes all types of actions used to achieve the attacker’s objec-tive (e.g., system compromise, protocol compromise, resource exhaustion, hardware failure, software crash). In terms of
mobility, attackers can be fixed or mobile.
The attack cause classification differentiates between effects directly or indirectly caused by an event (e.g., disruption within service, cascade disruption from a service). The
af-fected services classification considers the priority of service nodes (e.g., primary service node, intermediate service node,
secondary service node). The objective of the attack considers how the malicious entity attempt to achieve its goal (e.g., data corruption, data fabrication, data destruction, data disclosure, data discovering, no objective). The attack impact considers the effects in terms of confidentiality, integrity and availability (e.g., none, low, medium, high, extreme).
b) A Posteriori Data: : A set of information gained by the attacker after a successful exploitation of a system’s vulnerability [40]. The system can release information that improves the attacker’s knowledge to exploit vulnerabilities or to overcome the security controls set by the system, however, the adversary knowledge is generally incomplete [41]. In this section we study the attacker’s knowledge with respect to the system evolution (e.g., deployment of countermeasures).
About the Countermeasures: : From the adversary point of view, the ability to penetrate a system does not necessarily implies the ability to break into a system. Breaking a system means making the system to fail and keep on failing. It is more hostile, and more difficult than penetrating into the system, since it requires an understanding of what makes the system fail [45]. However, penetrating the system is the first step for an attacker to improve his/her knowledge about the system.
According to Krautsevich et al. [40], an attacker observes a system and can influence its behavior by making actions at a given moment. The system responds to an action probabilisti-cally. Attackers do not make decisions about actions blindly. Instead, they take into account past, current, and possible future states of the system, as well as possible rewards that are connected with the actions. The goal of the attacker is to maximize the expected total reward according to a sole criterion.
We define the attacker’s a posteriori knowledge based on the actions the defender performs to protect the system against a given attack (e.g., implementing security countermeasures). Security measures can be performed automatically by the system and can be soft (e.g., reducing credit limits, restarting the system, requesting password change), moderate (additional authentication method, temporal access denial, temporary fix, alarms) or aggressive (e.g., vulnerability patching, blocking user account, admin rights request). Depending on the deci-sions available to the attacker, he/she will be able to change its behavior and adapt to the system or quit his/her initial goal. The Incident Object Description Exchange Format (IODEF) [46] classifies the actions taken a system as a defense mecha-nism. Examples of such actions are: nothing (i.e., no action is required); contact-source-site (i.e., contact the site identified as the source of the activity); investigate (i.e., investigate the systems listed in the event); block-host/network/port (i.e., block the host/network/port listed as sources in the event); status-triage (i.e., conveys receipts and the triaging of an incident).
In addition, physical countermeasures consider all security actions taken to prevent, protect, or react against a mali-cious physical event that originates in the system. Examples of physical countermeasures include blocking/opening doors, disabling/enabling hardware, disconnecting/connecting equip-ment, reparing/replacing hardware, turning on/off devices, posting banners and/or security messages within the
orga-nization’s infrastructure, installing video surveillance and/or biometric systems.
IV. SECURITYEVENTDATAMATRIX
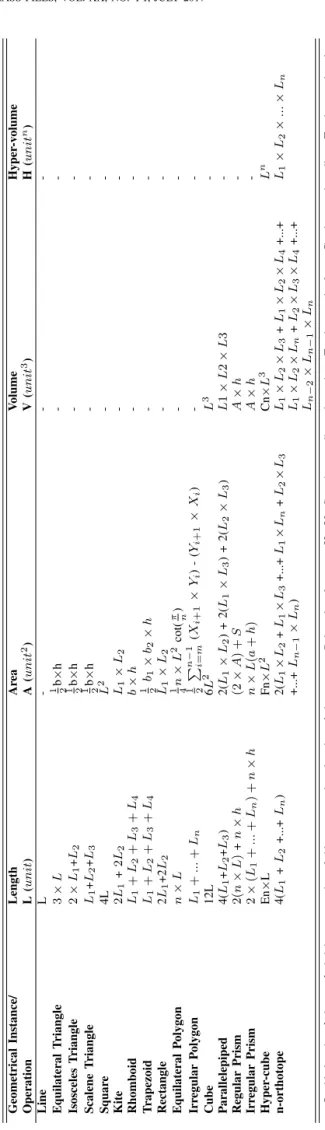
Based on the information presented in previous sections, we propose a matrix that organizes the event data based on the required and optional information of critical and non-critical infrastructures. Table I organizes the information of critical infrastructures (e.g., energy distribution, water supply, telecommunications, health, finance, transportation) and pro-vides examples of the data to be used in particular systems (cyber, physical, and cyber-physical). Information labeled as
Required is proposed for the identification of important axes of the geometrical instances, whereas information labeled as
Optional provides additional information about the target and the security events that could be useful in the construction of the geometrical instances. Optional information is not always easy to obtain but it can be useful to develop other axes of impact for the studied events.
In Table I, it is worth noting that cables, equipment, and other physical devices belong to the physical system but the definition of physical systems also involves physical processes and the data obtained from the industrial system or environments, for example, a voltage peak, because it has repercussions in the physical systems and in the industrial processes (energy distribution, water supply, etc.). These data are normally analogical data then transformed into digital data for communicating them through the network.
Table II organizes the information of non-critical infras-tructures based on three main aspects: (i) asset location (i.e., internal, external), (ii) event time (i.e., a priori, a posteriori), and (iii) event nature (i.e., physical, logical).
V. IMPACTASSESSMENT USINGGEOMETRICALMODELS
This section details the process for the impact assessment of cyber security events using geometrical tools.
A. Data Collection
It refers to obtaining information that can be useful during the evaluation process of cyber security events. This includes information about subjects (e.g., users, customers, potential clients, competitors, providers), objects (e.g., files, devices, servers, audio, video), and the actions that subjects perform on objects (e.g., read, write, execute). Depending on the target system, the information can be obtained from multiple sources. Examples of such sources are databases (e.g., data ware-house, cloud database, knowledge database), logs (e.g., ac-cess log, error log, warning log), acac-cess control lists (e.g., permissions, prohibitions), directories (e.g., home directory, parent directory, LDAP), repositories (e.g., local repository, SVN), traffic flow (e.g., processing delay, queuing). The type of target system is crucial in the identification of the data to be collected. For instance, if the target is a critical system for energy distribution, data must focus on technical and non-technical losses, as presented in Table I. If the target is a non-critical system, from which only internal information is available, data will focus on the logical and physical elements integrating the system, as detailed in Table II.
B. Data Normalization
The information is obtained in different formats and requires to be normalized for further treatment. The second step is therefore related to the data normalization process. This latter includes data organization, data cleaning, and data-type con-struction. The organization of data corresponds to the process of grouping elements with similarities in a data slot (e.g., all users with admin privileges are grouped in a slot called administrator). Duplicated data assigned to the same slot are deleted in the data cleaning process. Then, similar slots are merged to create data-types (e.g., internal users, system admin, super admin, guess, and external users can be all merged into a single data-type called USER).
C. Axes Identification and Population
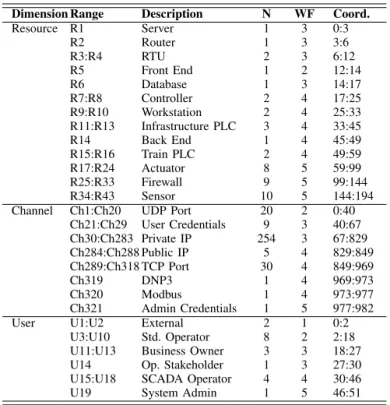
Each data-type defined in the previous steps represents one side/axis of the geometrical instance. Examples of axes are given in Tables I to II which include, users (e.g., all user accounts having interaction with the information system), resources (e.g., logical and physical resources from the target system), channels (e.g., all actions performed by users to have access to resources). The more data-types we obtain from step 2, the more number of axes in the geometrical instance, and thus, the more detailed information about the impact of the security event.
Once the axes are identified, we need to populate them. This process requires to assign a weigh to every data slot composing the axis, based on its contribution to the realization of a particular event. Contributions are either absolute or relative. The former considers every single element of the information system that is affected to a security event, whereas the latter considers the percentage of all affected elements. Absolute contributions are computed as proposed in Definition 1 whereas relative contributions are computed as proposed in Definition 2.
Definition 1. Absolute Contribution. Let X = x1, x2, ..., xibe
a finite set of size i composed by the total number of elements of entity T ; and let Y = y1, y2,..., yj be a finite set of size j,
composed by the affected elements of entity T . Knowing that the set Y is a subset of X, thus Y ∈ X, then, the absolute contribution CoA of entity T in the execution of event E is
computed using Equation 1.
CoA(T, E) =
i=1
X
n
Yj×W F(Yj)∀j ∈ Y (1)
Note that W F corresponds to the weighting factor asso-ciated to each data-type. W F is a value between 1 and 10 that is assigned based on the CARVER methodology (i.e., criticality, accessibility, recuperability, vulnerability, effect, and recognizability) [29], [47].
Definition 2. Relative Contribution. Let X = x1, x2, ..., xibe
a finite set of size i composed by the total number of elements integrating the entity T ; and let Y = y1, y2,..., yj be a finite
set of size j composed by the affected elements of the entity T . Knowing that the set Y is a subset of X, thus Y ∈ X, then,
Table I: Critical Infrastructure Systems Taxonomy
Cyber Systems Physical Systems
Required Additional Required Additional
Ener
gy
Distrib
ution
Technical losses (e.g., overhead line); non-technical losses (e.g., error); type of conductor (e.g., copper); data collection frequency (e.g., annually); reconciliation (e.g., settlement reconciliation); protocols (e.g., DNP3); service status (e.g., active).
Transformer material (e.g., iron); timing differences (e.g., absolute differences); profiling (e.g., profile coefficient); meter characteristics (e.g., identification);
communication protocols (e.g., LTE); HMI (e.g., client console); switch brand (e.g., Cisco); security software (firewall).
Load (e.g., heating load); peak load times (e.g., winter); conductor temperature (e.g., Celsius); energy demand and consumption (e.g., MWh/year, KW/h); Calculation Factor (e.g., Loss Factor); power voltage (e.g., high voltage); errors; transformer characteristics (e.g., temperature, distance). Electrical equipment (e.g., transformers); Distribution Management
System (e.g., medium
voltage); wiring system for supplying electricity (e.g., three phase): agents (e.g., collectors); PMU
(phasor measurement
unit); media type (e.g.,
fiber optics); security
device.
W
ater
Supply
Security logs (e.g., logs provided by firewall);
communication protocols (e.g., Modbus); resources (e.g., available bandwidth); virtual distribution map (e.g., virtual district metering area).
PLC type (e.g., integrated PLC); data collectors (e.g., data storing units); connecting elements (e.g., satellite links); security mechanisms (e.g., Firewall); software controls (e.g., patching).
Inclinometer (e.g., lateral earth movements); tiltmeter (e.g., wall tilt); crackmeter (e.g., movement of cracks) jointmeter (e.g., expansion of a joint); earth pressure cell (e.g., pressure of the dams); piezometer (e.g., fluids pressure);
turbidimeter; thermometer.
Sensors (e.g., WSN);
Monitoring device (e.g., MCU); automated meter reading (ARM); acoustic
measures (based on
hydrophone sensors or on accelerometers, e.g., to determine leak positions
); biosensors measures
(e.g., behavior of living organisms in the water).
Financial
Ser
vices
Current assets (e.g., cash); Non-current assets (e.g., property); current and non-current liabilities (e.g., income taxes payable); equity (e.g., capital stock); income (e.g., cost of sales); currency (e.g., USD); net sales (e.g., by product type); budget (e.g., per account); cash flows (e.g., from operating activities); general cash flows (e.g., net in-crease /decrease in cash).
Organization (e.g., business unit); customer (e.g., address): vendor (e.g., type); invoice (e.g., payment date); calendar time (e.g., date); company’s account category (e.g., cash); account classification (e.g., cost); account or sub-account type (e.g., salaries); transaction code (e.g., revenue); employee (e.g., name).
Technical equipment (e.g., ATM, database); physical storage (e.g., cabinets); physical documents (e.g., paper work); banking infrastructure (e.g., buildings); video surveillance (e.g., cameras).
Physical security devices (e.g., biometric devices).
Health
Ser
vices
Health Services (e.g., nursing); hospital inpatient (e.g., age); primary care services (e.g., community schemes); private health insurance (e.g., people by country); disability (e.g., number of people with disability); hospital activity (e.g., emergency service); weighting list (e.g., waiting list by hospital); psychiatric data (e.g., psychiatric hospitals); hospitalized patients (e.g., emergency patients); life expectancy (e.g., healthy life years);
pharmaceutical dispenses (e.g., drug dispense date);
demographics (e.g., number of births).
Claims (e.g., payments); productivity (e.g.,
productivity of physicians in group practices); hospital statistics (e.g., name, address); codes (e.g., international classification of diseases); provider information (e.g., identifier); service additional
information (e.g., date of service); service units paid and calls claimed (e.g., diagnostic); medical wireless network development.
Medicare service (e.g., medical equipment, home health); essential medical devices (e.g., Protective breathing masks); respiration medical devices (e.g., laryngoscope blade, endobronchial and endotracheal intubation tube); blood circulation devices (e.g., short peripheral catheter); digestive devices (e.g., aspiration tubing); infrastructure (e.g., emergency number infrastructure). Robot-assisted surgical machines; personal
real-time devices (e.g.,
real-time EKG device); emergency devices.
Table 1 (Cont). Critical Infrastructure Systems Taxonomy
Cyber Systems Physical Systems
Required Additional Required Additional
T
ransportation
Communication technologies (e.g., WiMAX); network architecture (e.g., public cloud) ; safety communication (e.g., protocols); security software (e.g., antivirus); storage (e.g., private data); network management (e.g. security
planning).
Collaborative network (eg. between public and private network, or among railway, roadway and emergency transport networks); exchange information protocols (e.g., V2V).
Vehicles; ships; trains; infrastructures (e.g., roads) ; human drivers; sensors; motors; surveillance cameras; traffic lights; railways; security devices; safety devices (e.g., speed control).
Locals (e.g., garages);
cables; devices materials:
remote workstation
(nodes); automatic
transports (e.g., smart
car); intelligent traffic
control devices (e.g.,
traffic lights in smart
cities).
T
elecommunications
Communication system model (e.g., OSI model); transmission
technologies (e.g., modulation); network protocols (e.g., protocol layering and software layering); routing and switching software (e.g., public switched telephone network -PSTN); telephone companies; Internet service providers ; network security (e.g., IDSs).
User applications, Over the Top (OTT) companies (e.g., used technologies, type of market, business).
Buildings; antennas; satellites; switch; towers; stations; hardware infrastructure (e.g., radio receiver); cables (e.g., optical fiber, copper, coaxial); user terminals (e.g., smart-phone), wireless systems (e.g., radio transmitters, radio waves, acoustic signals).
IoT (Internet of Thing) devices (e.g., smart home, smart city (multiple sen-sors, video cameras), con-nected watches).
Table II: Non-Critical Infrastructure Systems Taxonomy
Logical Physical
Required Additional Required Additional
Inter
nal
user account (e.g., admin); resource (e.g., file); Channel (e.g., IP address);
confidentiality (e.g.,
unauthorized access); integrity (e.g., unauthorized change of data content); availability (e.g., denial of service); security mechanisms (e.g., TLS); access control method (e.g., authenticated); access right (e.g., read); event severity (e.g., alert).
temporal conditions (e.g., detection time); spatial conditions (e.g., user’s location); proprietary Information (e.g., account-ing records); resource consumption (e.g., memory capacity); process targets (e.g., browsers); cookies (e.g., number of for-eign cookies); open sockets (e.g., TCP), active web handlers (e.g., http); dynamic web pages (e.g., .exe files); facility (e.g., kernel); sender (e.g., Fully Qualified Do-main Name); analyzer (e.g. source); event completion (e.g., failed); confidence (e.g., high); algorithm used (e.g., SHA1).
Vehicles; ships; trains; infrastructures (e.g., roads) ; human drivers; sensors; motors; surveillance cameras; traffic lights; railways; security devices; safety devices (e.g., speed control).
Locals (e.g., garages); cables; devices materials: remote workstation (nodes); automatic transports (e.g., smart car); intelligent traffic control devices
(e.g., traffic lights in smart cities).
Exter
nal A
Priori
access complexity (e.g., high); authentication type (e.g., multiple); required privilege (e.g., high); user interaction (e.g., required); attacker type (e.g., malicious agents); attacker’s location (e.g., insider); quantity (e.g., multiple); technique (e.g., resource exhaustion); affected services (e.g., primary); objective (e.g., data corruption); attack impact (e.g., extreme).
exploitability (e.g., proof of concept); re-port confidence (e.g., unconfirmed); po-tential collateral damage (e.g., high); at-tacker’s motivation (e.g., monetary profit); mobility (e.g., fixed); attack cause (e.g., disruption within service).
access vector (e.g.,
local access), physical
location of people (e.g., network administrator’s room), physical location of high-tech devices (server’s room), physical location of
network elements (e.g., router location). network topology (e.g., interconnection of network elements), location of lo-tech devices (lighting control room), location of no-tech devices
(e.g., drawer that stores the disaster recovery program).
A
P
osteriori
defense mechanism (e.g., block-host/ network/ port), confirmation about the access complexity, authentication type, required privilege and the user interaction required by the system.
soft countermeasures (e.g., restarting the system), moderate countermeasures (tem-poral access denial); aggressive counter-measures (e.g., blocking user account), confirmation about the exploitability of the system’s vulnerabilities.
countermeasures
in place (e.g.,
replace hardware),
confirmation about
access vectors, location of people, location of
hi-tech devices, and
location of network
elements.
confirmation about the network
topology, the
physical location
of lo-tech and