HAL Id: hal-01630211
https://hal.archives-ouvertes.fr/hal-01630211
Submitted on 7 Nov 2019
HAL is a multi-disciplinary open access
archive for the deposit and dissemination of
sci-entific research documents, whether they are
pub-lished or not. The documents may come from
teaching and research institutions in France or
abroad, or from public or private research centers.
L’archive ouverte pluridisciplinaire HAL, est
destinée au dépôt et à la diffusion de documents
scientifiques de niveau recherche, publiés ou non,
émanant des établissements d’enseignement et de
recherche français ou étrangers, des laboratoires
publics ou privés.
Intensification of vibration mixing of particulate solids
by means of multi-layer loading of components
Vadim Mizonov, Ivan Balagurov, Henri Berthiaux, Cendrine Gatumel
To cite this version:
Vadim Mizonov, Ivan Balagurov, Henri Berthiaux, Cendrine Gatumel. Intensification of vibration
mixing of particulate solids by means of multi-layer loading of components. Advanced Powder
Tech-nology, Elsevier, 2017, 28 (11), p.3049-3055. �10.1016/j.apt.2017.09.016�. �hal-01630211�
Intensification of vibration mixing of particulate solids by means of
multi-layer loading of components
Vadim Mizonov
a,⇑, Ivan Balagurov
a, Henri Berthiaux
b, Cendrine Gatumel
baDepartment of Applied Mathematics, Ivanovo State Power Engineering University, Rabfakovskaya 34,153003 Ivanovo, Russia bCentre RAPSODEE, UMR CNRS 5302, Ecole des Mines d’Albi-Carmaux, Campus Jarlard, route de Teillet, 81000 Albi, France
Keywords: Mixing of solids Segregation Multi-layer loading Mixing kinetics Markov chain Optimum mixing time
a b s t r a c t
The objective of the study is to show how initial distribution of dissimilar particulate components influ-ences the mixing time and mixture quality. The dissimilar components have a tendency to segregate in one another, and it is impossible to achieve the perfect mixture of them in industrial settings. Nevertheless, the situation can be improved if the components are loaded as a sequence of several sand-wiches, each of these sandwiches containing layers of components that are proportional to their share in the mixture. In this case, a sort of pre-mixing occurs while still at the loading stage – which allows reduc-ing the optimum mixreduc-ing time and increasreduc-ing the homogeneity of the mixture. The theory of Markov chains was used to simulate the mixing kinetics. It is shown that the number of loaded sandwiches has a very strong influence on the process efficiency. A loading device that can effectively realize multi-layer loading is proposed. The mixing kinetics for ternary mixture of glass beads was investigated experimentally at a lab scale vibration mixer. A one-time loading and a two-sandwich loading were com-pared. It was shown that the optimum mixing time and non-homogeneity of the mixture were reduced by half in the latter case.
1. Introduction
One of the key problems of mixing dissimilar granular materials is their segregation into one another. The segregation occurs because of differences in the physical properties of the compo-nents, such as particle size, density, and shape. Among other things, segregation makes mixing process very difficult for predic-tive modeling and calculation. Bridgwater[3,4] emphasized the difficulty of designing and operating the mixing process, which is largely based on judgment rather than science. If it were not for this segregation process, achieving a homogeneous mixture would only be a matter of finding the adequate mixing time. Very often, it is virtually impossible to achieve a homogeneous mixture if segre-gation occurs. First, the homogeneity of a mixture increases, reaches its maximum, and then decreases again. There have been a number of studies, mostly experimental, of the influence of the segregation effect on mixture quality (e.g., Tang and Puri [13]; Jha et al.[9]; Jha and Puri[8]; Iddir et al.[7]). However, the influ-ence of segregation on the mixing kinetics has received less atten-tion. In particular, it is important to estimate this effect for the
mixing of multi-component dissimilar materials, when segregation becomes very complex.
From the authors’ viewpoint, one of the tools that are capable of solving these problems is the theory of Markov chains, which is related to the process of mixing as it describes the evolution of the state of a stochastic system. The basic idea of the Markov chain approach consists in dividing the operating volume of the mixer into small but finite zones (cells) and then observing the evolution of the key component concentration in these zones at discrete moments in time, with a small but finite time step between them. This approach was used by Wang and Fan[14]to describe the state of a mixture after passing through a static mixer. However, their work neglected the evolution of the process parameters, and did not describe the physical features of the mixing zone. In later stud-ies by these researchers (Wang and Fan[15]; Fan et al.[6]), a model was developed in which transitions were only permitted to the neighboring cells. Doucet et al. [5] attempted to combine the DEM method with Markov chain theory. They computed the tran-sition probability matrix directly by using the results obtained from a discrete element model. This is a promising technique to reduce the computational time for modeling the process of mixing. The general strategy of applying the theory of Markov chains to modeling different processes in powder technology was described ⇑ Corresponding author.
by Berthiaux et al.[2]. It was demonstrated by Mizonov et al.[10]
that the theory can be successfully used to model heat and mass transfer between stochastically moving particulate and gas flows. The approach was also successfully applied by Ammarcha et al. to describe the dynamics of the transitory powder flow that occurs during the emptying of a continuous mixer[1]. The basic operator of a Markov chain model is the matrix of transition probabilities that controls the transitions of particles from one cell to others. This matrix transforms the initial state vector (i.e., initial distribu-tion of a component over a mixing zone) into the current state vec-tor in equal increments. However, in order to make a Markov chain model predictive, its matrix of transition probabilities must take into account all important physical features of the process to be described. Very often this matrix appears to be state-dependent, and the model becomes non-linear. The non-linear models were used in our paper Mizonov et al.[11]to search for solutions to min-imize the negative influence of segregation in mixing of particulate solids. Later on, in Mizonov et al.[12], the Markov chain model of mixing kinetics for ternary mixture of dissimilar particulate solids was developed, examined and verified experimentally. However, in these and others papers, the main objective of the study was the matrix of transition probabilities and its adequacy to the process under study. The influence of the initial state vector on the process efficiency was not studied. This vector describes the distribution of the components over a mixing zone that takes place after these components have been loaded into a mixing chamber. A typical case of loading is a one-time loading when the components are placed on top of one another in accordance with the growth of their segregation rate. However, the components can be loaded as several sandwiches, each of them containing layers of these components proportional to their ratio in the mixture. In this case, a sort of pre-mixing occurs while still at the loading stage – which allows reducing the optimum mixing time and increasing the homogeneity of the mixture. The detailed theoretical and experi-mental study of this approach is the objective of the present paper. 2. Theory
It is appropriate that we begin our theoretical study of mixing by analyzing the binary mixture formation in order to remind of the basic physical assumption it is based on. Suppose that we have to mix two dissimilar components of particulate solids in a vibra-tion vessel. According to the strategy of Markov chain modeling, the total height of the mixture inside the vessel H is divided into mperfectly mixed cells of heightDx ¼ H=m that can exchange their components in an agitated state. The transition of a component
from a cell can occur due to pure stochastic (symmetrical) migra-tion of particles characterized by the transimigra-tion probability d, and due to segregation characterized by the transition probability
v
. For the sake of determinacy, let us suppose that the only difference between the components is the size of their particles, and assign index numbers of 1 and 2 to the fine and coarse fractions, respec-tively. The small particles can only segregate downwards, while the large particles can only segregate upwards. The process is observed at discrete moments of time tk¼ ðk # 1ÞDt, whereDtis the time step, or transition duration, and k is the transition num-ber, which can be interpreted as the discrete analogue of time. The transition probabilities can then be calculated as follows: d ¼ DDt=Dx2,v
¼ VDt=Dx where D is the dispersion coefficient and V is the dimensional velocity of segregation.At any moment of time tk, the distribution of the fractions’ vol-ume content over the chain cells is presented by the state column vectors Sk
1 and Sk2 of size m % 1 containing elements Sk1j and Sk2j, where j ¼ 1; . . . ; m is counted from the top of the mixture.
Let us now assume that the total volume of the fractions inside each cell Smaxremains constant with time, regardless of the com-position of each fraction inside the cell. This is a really working assumption that is not as strict as the continuity equation for liq-uids. The total volume of the components can change depending on the particle size ratio and the components content. It depends on the density of random packing of particles of different size and content. However, it is supposed that this assumption is not yet oversimplified enough to make the model unacceptable for engineering purposes.
Thus, if a cell loses some of its matter during a time transition, this loss must be immediately compensated by inflows from neigh-boring cells. Let us assume that the value of Smaxis equal to the conditional unit. This condition gives the following constraint
Sk
1jþ Sk2j¼ 1; j ¼ 1; . . . ; m ð1Þ It is clear that for a binary mixture it is enough to describe the evolution of one state vector of two, for instance, the state vector Sk
1, which varies with time, i.e., from one transition to another. Its evolution can be described by the recurrent matrix equation:
Skþ1
1 ¼ Pk1ðSk1ÞSk1 ð2Þ
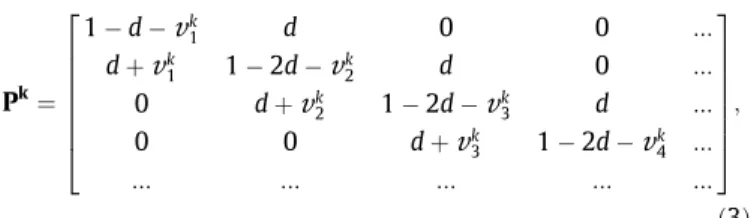
where P1is the matrix of transition probabilities that control the process. It is emphasized that the matrix itself varies from one time transition to another and depends on the current state of the mix-ture. This matrix is a tridiagonal matrix of size m % m. In the general case, it has the following form:
Nomenclature
D dispersion coefficient, m2/s
d probability of pure stochastic (diffusion) transition j cell number counted from the top of the mixture H total height of a mixture, m
k transition number
m total number of cells in the chain
P, Pij matrix of transition probabilities and its entries S, Sj state vector and its entries
Smax maximum content of mixture that a cell can contain
t time, s
V velocity of segregation, m/s
v probability (rate) of segregation transition
z number of sandwiches in the load
Greek symbols
a
proportional coefficientr
standard deviation Dt transition duration, s Dx height of a cell, m Indices0 related to segregation of a fraction into a pure coarser fraction
1, 2 fraction number
k related to the k-th transition
l related to loading
mc related to loading-mixing cycle
Pk ¼ 1 # d #
v
k 1 d 0 0 ::: d þv
k 1 1 # 2d #v
k2 d 0 ::: 0 d þv
k 2 1 # 2d #v
k3 d ::: 0 0 d þv
k 3 1 # 2d #v
k4 ::: ::: ::: ::: ::: ::: 2 6 6 6 6 6 6 4 3 7 7 7 7 7 7 5 ; ð3Þwhere
v
jis the actual probability of a downward segregation tran-sition duringDt(i.e., those particles that leave cell j and transit to cell j + 1 due to the downward segregation).The difficulty is that the fine fraction almost never segregates into the pure coarse fraction – it is only found in its very small con-centrations, or at the very beginning of the mixing process, when the fractions are completely separated. In all other cases, the fine fraction segregates downward into a mixture of fine and coarse fractions, the composition of this mixture varying with time. In order to take this factor into account, the following assumptions are made (seeFig. 1).
It is supposed that the fractions’ migration that occurs during a one-time transition consists of two virtual stages (which, in fact, go simultaneously). The first stage consists in the downward segrega-tion of the fine fracsegrega-tion. In view of the fact that a fracsegrega-tion cannot segregate into itself, the segregation transition can only be directed into the volume that is occupied by the coarser fraction. It allows calculating the segregation transition probability as
v
k j ¼v
0 1 # Sk jþ1 Smax ! ¼v
0ð1 # Skjþ1Þ ð4Þ wherev
0is the segregation rate of the fine fraction into the pure coarse fraction.After the first virtual stage is complete, a void appears in the current cell j. It is assumed that during the second stage the void is filled by the coarse fraction. Thus, the segregation-induced exchange between the two fractions occurs during the total time transition, and Eq.(1)appears to be met.
It can be seen fromEq. (2)that the mixing kinetics depends on the matrix of transition probabilities that is already specified, and on the initial state vector S0
1that describes the components distri-bution just after loading. Let us examine how this vector influences the mixing kinetics. The results of numerical experiments with this vector are shown inFig. 2.
The total number of cells was taken equal to 48, the composi-tion of the mixture being 1:5. This means that the key component could fully occupy 8 cells. The calculations were done for v0 = 0.2 and d = 0.3. The initial distributions of the key component are shown at the top of the graph, the mixing kinetics – in the middle, and the distributions of the key component after mixing during the optimal mixing time are shown at the bottom. The mixture quality was estimated by the standard deviation of the key component dis-tribution
r
. Case 1 corresponds to a one-time loading of the com-ponents as one big sandwich. The subsequent cases are related to 2, 4, and 8 smaller sandwiches. However, each sandwich has the same 1:5 composition of components. In all the cases the mixing kinetics is similar. First the mixture non-homogeneity decreases, reaches its minimum, and then increases again. It is obvious that the mixing process must be stopped at the optimum number of time transitions, i.e., at the optimum mixing time. It can be also seen that increasing the number of sandwiches leads to a smaller optimum mixing time and to a smaller minimum achievable non-homogeneity of the mixture. For instance, transition from Case 1 (one-time loading) to Case 4 (loading as 8 sandwiches) allows decreasing the optimum mixing time by about 10 times and decreasing the minimum non-homogeneity by about 8 times. However, such multi-layer loading begets some technical and technological problems. First, it is necessary to have a device for effective multi-layer loading, such a device to be discussed below. Second, it is necessary to take into account the fact that multi-layer loading takes more time than one-time loading. Indeed, the total time of mixing cycle ‘‘loading + mixing” kmcconsists of the mixing time proper kmand the loading time kl(we do not take into account the discharge time, which does not depend on the loading mode). The mixing time proper decreases and the loading time increases as the number of sandwiches grows. As first approximation, it can be assumed that the loading time is directly proportional to the number of sandwiches z. In this case we get:kmc¼ kmþ kl¼ kmþ
a
z ð5Þ wherea
is the proportional coefficient.In order to compare the different cases of loading shown in
Fig. 1, let us also suppose that the mixing homogeneity
r
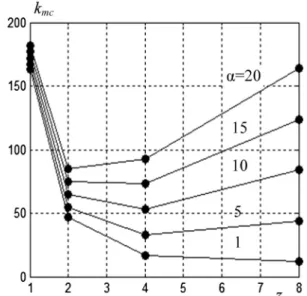
min= 0.0824, which can be achieved at one-time loading, meets the technological standards, and the sole purpose of multilayer loading is to increase the unit’s mixing capacity. The requiredmixing times for different multilayer loadings can be easily found for each case from the kinetic curves inFig. 3.
It can be seen from the graphs that at a very fast loading rate (
a
= 1) it is better to have 8 sandwiches (the more the better), while at a very slow loading rate (a
= 20) 2 sandwiches are prefer-able. Thus, the optimum number of sandwiches exists depending ona
.If we deal with a ternary mixture, the task of constructing the matrix of transition probabilities becomes more complex. The point is that the intermediate fraction can experience both down-ward and updown-ward segregation, and the fine fraction has two parameters characterizing its segregation: the rate of downward segregation into the pure intermediate fraction, and the rate of its segregation into the pure coarse one. Nevertheless, the basic assumptions made for the process mechanism shown in Fig. 1
remain the same. The detailed study of ternary mixture formation, the rules of constructing the matrix of transition probabilities and results of the model experimental validation can be found in[12], and we believe that there is no reason to reproduce the obtained cumbersome formulae in the present paper. For this reason, only computational example based on this model that addresses the multi-layer loading is presented here. It is shown inFig. 4.
Fig. 2. Influence of the key component initial distribution (upper graphs) on the mixing kinetics (middle graph) and its distribution at maximum homogeneity of the mixture (lower graphs) (lines 1–4 are related to the initial distributions 1–4 shown at the top).
Fig. 3. Influence of the number of sandwiches on the total mixing time at different value ofa.
The calculations are done to compare mixing kinetics and mixture state at optimal mixing time for two cases of loading: one-time loading and loading as two sandwiches. The mixture components are numbered 1, 2 and 3 where 1 corresponds to the finest fraction. The transition probabilities are taken as follows:
v
012= 0.2,v
013= 0.3,v
023= 0.1 and d = 0.2. The mixture composi-tion is 1:1:1.The upper row of graphs illustrates mixing kinetics at one-time loading. The mixture non-homogeneity reaches the minimum value
r
= 0.119 at kopt= 31. The distribution of components at this state is shown in the right graph. The lower row of graphs refers to multi-layer loading as two sandwiches (see the left graph). Now the minimum non-homogeneity is achieved at kopt= 13 (almost 3 times as fast) and is equal to 0.067 (almost 2 times as little). It is obvious that the multi-layer loading allows obtaining considerable gain in comparison to the one-time loading.3. Experimental
Experimental part of the work pursued two purposes: to develop a loading device for effective multi-layer loading of dis-similar particulate solids into a batch mixer and to validate the model of mixing kinetics for a ternary mixture during multi-layer loading.
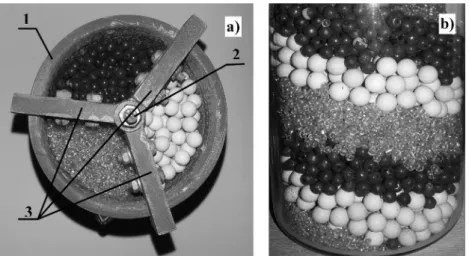
One of possible technical solutions of multi-layer loading is shown inFig. 5a. Several rectangular vertical dividing plates are fixed on a vertical shaft and placed into the cylindrical mixer body. While in the initial state, the lower parts of the plates touch the mixer’s bottom. The angle between the plates can be adjusted pro-portionally to the mixture’s component ratio. The components are loaded into the sectors formed by the dividing plates. After that, the shaft with the plates is brought in rotation; at the same time,
it moves up until all the components appear in the mixer. Their distribution after loading is shown inFig. 5b. It can be seen from the picture that such device provides effective multi-layer loading with a required number of sandwiches.
An experimental validation of the model was carried out using a custom vibration stand that generates vertical vibrations of con-trolled amplitude and frequency. Glass beads with diameters of 2, 4, and 6 mm (with a different color for each size) were used to simulate the components to be mixed. The mixing vessel was a box with a transparent front wall of size 100 % 150 mm. The gap between the front and back walls was 20 mm.
Using the ruler on the front wall of the box, the components were arranged in layers. After the experiment had started, the mix-ture was photographed every 30 s. These picmix-tures were analyzed using special image analysis software that allowed the content dis-tribution of each fraction to be determined. Each experiment was repeated at least five times to obtain reproducible results, and then the average content of the fractions was calculated.
In order to make the model work, it was necessary to determine the velocity of downward segregation of the fractions into the other pure fraction, which is coarser. The experimental procedure to do that is described in[12]. It was done as follows. The thin layer of the tested fraction was placed on top of the coarser fraction and the mixing process was launched. The pictures of the particles dis-tribution were taken after each 10 seconds. After the taken pictures were treated the time when 50% of the tested fraction showed up in the bottom cell was found. The velocity of segregation was cal-culated as the distance between the coarse fraction top and the bottom cell divided by this time. It is necessary to note that these experiments are labor and time consuming, and it would be very convenient to use the DEM simulation instead of them.
The rate of pure stochastic mixing d was used as the adjusting parameter to minimize the sum of squared deviations of the
experimental data from the model-calculated data model ones over the entire range of the experimental data (the least squares method).
4. Results and discussion
The average segregation velocities found for the glass bead frac-tions according to the approach described in the previous section were broadly similar: V12= 2.1 cm/min, V13= 2.95 cm/min, and V23= 1.1 cm/min. At the accepted transition duration Dt= 10 s and a cell height ofDx= 1 cm, the corresponding segregation rates were 0.35, 0.49, and 0.18, respectively (
v
¼ VDt=Dx). The rate of pure stochastic mixing d = 0.12 was adjusted to minimize the sum of squared deviations of the experimental data from the model-calculated data over the entire range of the experiment (the least-squares method).Fig. 6shows the mixing kinetics for two ways of loading: one-time loading (curve 1) and loading as two sandwiches (curve 2). In the first case the minimum non-homogeneity is reached at 180 s and is equal to 0.17 while in the second case it is reached at about 90 s and is equal to 0.1. It is clearly seen that the second
case has an obvious advantage in comparison to the first one: the optimum mixing time is halved, and the minimum mixture non-homogeneity becomes 1.7 times as little.
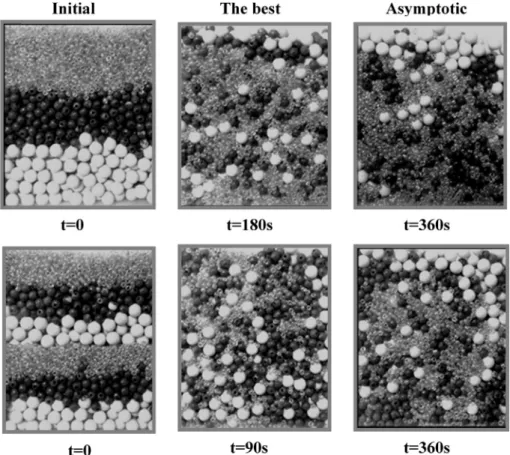
The photographs of components distribution for these two ways of loading at different moments of time are shown inFig. 7. The last column of photos is conditionally called ‘‘asymptotic” because curves 1 and 2 have not converged yet at 360 s. (It is necessary to remind that the asymptotic distribution does not depend on the initial conditions and must be identical under other conditions being equal). At the same time it is possible to distinguish visually that the optimum mixture is more homogeneous for the second way of loading.
5. Conclusions and perspectives
Using the Markov chain model of the kinetics of multi-component mixture formation, the influence of multi-components initial distribution on mixing kinetics and mixture quality has been investigated. It is shown that loading the components to be mixed into a batch mixer by multi-layer method as several sandwiches helps to considerably reduce the mixture’s minimum non-homogeneity that can be achieved for dissimilar particulate solids, as well as cut down on the time that it takes the mixture to achieve this state. In this case the process of loading is combined with pre-mixing, and it is obvious that the sheer mixing time decreases. However, the loading time also depends on the number of sand-wiches in the load and grows with it. Therefore, there must be an optimum number of sandwiches that yields a minimum loading-and-mixing time which also depends on the loading rate. A technical solution for multi-layer loading into a batch vibra-tion mixer is proposed and its ability to realize effective multi-layer loading is demonstrated experimentally. The mixing kinetics for two ways of loading (one-time loading and loading as two sandwiches) is investigated experimentally for a ternary mixture of glass beads size fractions. It is shown that the structured load allows reducing the mixture time and minimum mixture non-homogeneity almost by half. In is also shown that the earlier devel-oped Markov chains model of mixing kinetics of ternary mixture formation fits the process in question rather well.
However, despite the fact that pre-mixing always improves the mixing at large, it is necessary to test the multi-layer loading at an industrial scale mixer to get a more accurate quantitative estima-tion of its efficiency. It is also important to investigate how the cohesion of particles influences on the proposed loading device workability and on the mixing kinetics. In addition it is necessary
Fig. 5. Multi-layer loading of components into cylindrical mixer. (a) – design of the loading device: 1 – cylindrical mixer body; 2 – vertical shaft; 3 – dividing plates; (b) – initial state of loaded ternary mixture.
Fig. 6. Comparison of the mixing kinetics for one-time loading (1) and loading as two sandwiches (2): points – experiment, lines – calculation.
to come up with a loading device that allows multi-layer layer loading into a mixer having a rotating agitator inside its operating volume. This all defines the future work in the described direction. Acknowledgement
This work is supported by the Russian Foundation for Basic Research (Project 15-08-01684).
References
[1]C. Ammarcha, C. Gatumel, J.L. Dirion, M. Cabassud, V. Mizonov, H. Berthiaux, Transitory powder flow dynamics during emptying of a continuous mixer, Chem. Eng. Process. 65 (2013) 68–75.
[2]H. Berthiaux, V. Mizonov, V. Zhukov, Application of the theory of Markov chains to model different processes in particle technology, Powder Technol. 157 (2005) 128–137.
[3]J. Bridgwater, Mixing of particles and powders: Where next?, Particuology 8 (2010) 563–567
[4]J. Bridgwater, Mixing of powders and granular materials by mechanical means—a perspective, Particuology 10 (2012) 397–427.
[5]J. Doucet, N. Hudon, F. Bertrand, J. Chaouki, Modeling of the mixing of monodisperse particles using a stationary DEM-based Markov process, Comput. Chem. Eng. 32 (2008) 1334–1341.
[6]L.T. Fan, F.S. Lai, Y. Akao, K. Shinoda, E. Yoshizawa, Numerical and experimental simulation studies on the mixing of particulate solids and the synthesis of a mixing system, Comput. Chem. Eng. 2 (1978) 19–32.
[7]H. Iddir, H. Arastoopour, C.M. Hrenya, Analysis of binary and ternary granular mixture behavior using the kinetic theory approach, Powder Technol. 151 (2005) 117–125.
[8]A.K. Jha, V.M. Puri, Percolation segregation of multi-size and multi-component particulate materials, Powder Technol. 197 (2010) 274–282.
[9]A.K. Jha, J.S. Gill, V.M. Puri, Percolation segregation in binary size mixtures of spherical and angular-shaped particles of different densities, Part. Sci. Technol. 26 (2008) 482–493.
[10]V. Mizonov, H. Berthiaux, P. Arlabosse, D. Djerroud, Application of the theory of Markov chains to model heat and mass transfer between stochastically moving particulate and gas flows, Granular Matter 10 (2008) 335–340. [11]V. Mizonov, H. Berthiaux, C. Gatumel, Theoretical search for solutions to
minimize negative influence of segregation in mixing of particulate solids, Particuology 25 (2016) 36–41.
[12]V. Mizonov, I. Balagurov, H. Berthiaux, C. Gatumel, A Markov chain model of mixing kinetics for ternary mixture of dissimilar particulate solids, Particuology 31 (2017) 80–86.
[13]P. Tang, V.M. Puri, Segregation quantification of two-component particulate mixtures: Effect of particle size, density, shape, and surface texture, Part. Sci. Technol. 25 (2007) 571–588.
[14]R.H. Wang, L.T. Fan, Axial mixing of grains in a motionless Sulzer (Koch) mixer, Ind. Eng. Chem. Process Des. Develop. 15 (1976) 381–388.
[15]R.H. Wang, L.T. Fan, Stochastic modeling of segregation in a motionless mixer, Chem. Eng. Sci. 32 (1977) 695–701.
![[PDF] Cours Modèles de conception UML](data:image/gif;base64,R0lGODlhAQABAIAAAP///wAAACH5BAEAAAAALAAAAAABAAEAAAICRAEAOw==)