HAL Id: hal-02433568
https://hal-univ-pau.archives-ouvertes.fr/hal-02433568
Submitted on 27 Oct 2020
HAL is a multi-disciplinary open access
archive for the deposit and dissemination of
sci-entific research documents, whether they are
pub-lished or not. The documents may come from
teaching and research institutions in France or
abroad, or from public or private research centers.
L’archive ouverte pluridisciplinaire HAL, est
destinée au dépôt et à la diffusion de documents
scientifiques de niveau recherche, publiés ou non,
émanant des établissements d’enseignement et de
recherche français ou étrangers, des laboratoires
publics ou privés.
Towards the internet of everything: Deployment
scenarios for a QoO-aware integration platform
Antoine Auger, Ernesto Expósito, Emmanuel Lochin
To cite this version:
Antoine Auger, Ernesto Expósito, Emmanuel Lochin. Towards the internet of everything: Deployment
scenarios for a QoO-aware integration platform. 2018 IEEE 4th World Forum on Internet of Things
(WF-IoT), Feb 2018, Singapore, France. pp.499-504, �10.1109/WF-IoT.2018.8355113�. �hal-02433568�
Towards the Internet of Everything: Deployment
Scenarios for a QoO-aware Integration Platform
Antoine Auger†, Ernesto Exposito‡ and Emmanuel Lochin†
†Institut Supérieur de l’Aéronautique et de l’Espace (ISAE-SUPAERO),
Université de Toulouse, 31055 Toulouse Cedex 4, France {antoine.auger, emmanuel.lochin}@isae-supaero.fr
‡Université de Pau et des Pays de l’Adour, LIUPPA, France
Abstract—Built upon the Internet of Things (IoT), the Internet of Everything (IoE) acknowledges the importance of data quality within sensor-based systems, alongside with people, processes and Things. Nevertheless, the impact of many technologies and paradigms that pertain to the IoE is still unknown regarding Quality of Observation (QoO).
This paper proposes to study experimental results from three IoE-related deployment scenarios in order to promote the QoO notion and raise awareness about the need for characterizing observation quality within sensor-based systems. We specifically tailor the definition of QoO attributes to each use case, assessing observation accuracy within Smart Cities, observation rate for virtual sensors and observation freshness within post-disaster areas. To emulate these different experiments, we rely on a custom-developed integration platform for the assessment of QoO as a service called iQAS.
We show that QoO attributes should be used to specify what is an observation of “good quality”, that virtual sensors may have specific and limiting capabilities impacting QoO and that network QoS and QoO are two complementary quality dimensions that should be used together to improve the overall service provided to end-users.
Keywords-Internet of Everything; sensors; observations; qual-ity; Quality of Observation; platform; integration
I. INTRODUCTION
Over numerous integration platforms that have been devel-oped for the Internet of Things (IoT), network Quality of Service (QoS) [1] has shown to be unsuitable for assessing the actual value of observations [2]. Basically, within data-centric systems, Quality of Observation (QoO) mainly depends on consumer needs and the specific context in which he/she consumes it. Therefore, we believe that QoO is a critical issue to address in the forthcoming Internet of Everything (IoE) [3] as more and more decisions will be based on services derived from received observations.
Built on the IoT, the IoE paradigm mostly acknowledges the importance of data (and therefore of data quality) within systems, alongside with people, processes and Things. Due to its wide scope, the IoE encompasses many use cases that may bring as much challenges regarding QoO. Among these use cases, Smart Cities, Web of Things and peer-to-peer connections between sensing Things have already become a
reality, waiting for bigger scale adoption. However, each of these uses also brings specific QoO challenges to address.
By introducing three deployment scenarios for a custom QoO-aware integration platform, the goal of our study is to promote the QoO notion and the need for characterizing observation quality (QoO assessment as a service). In or-der to draw more insightful lessons, we focus on specific attributes specifically tailored for each use case: observation accuracy within Smart Cities, observation rate for virtual sensors pertaining to the Web of Things and, finally, freshness when observations are collected in a peer-to-peer decentralized fashion as within post-disaster areas.
The rest of this paper is structured as follows: Section II introduces the required background and the related work. Section III presents the integration platform that we used to obtain the experimental results, with a focus on initial requirements and concrete implementation choices that have been made. Then, Section IV, V and VI presents the three IoE-related deployment scenarios. Finally, Section VII concludes and describes further perspectives.
II. BACKGROUND ANDRELATEDWORK
This section describes several notions required to fully understand the three deployment scenarios. From Things to people, many enablers will be needed to pursue IoT and IoE paradigms.
A. Internet of Things (IoT) and Internet of Everything (IoE) The Internet of Things (IoT) [4] can be defined as a paradigm that envisions pervasive and inter-connected ob-jects (also called Things) that can be uniquely addressed, generally through the Internet. Some examples of these Things can be found with Radio-Frequency IDentification (RFID) tags, sensors, actuators, mobile phones, etc. Within the IoT ecosystem, Things generally produce data that needs to be collected and processed by gateways or IoT platforms. De-pending on the use case considered, these platforms may provide enhanced services to end users based on received data. Built upon the IoT which mainly refers to the deployment and the interconnection of smarter communication-capable Things, the Internet of Everything (IoE) extends this paradigm by going beyond Things to also integrate societal impacts, risks
and economic benefits of a more interconnected World. This relatively new paradigm has been introduced by Cisco in an official report dated 2013 [3]. In this report, Cisco has defined the IoE as “the networked connection of people, process, data, and things”. Compared to the IoT that was mainly driven by technology, the IoE has been coined to rather envision business and deep changes in society. We believe that the IoE vision is particularly appropriate as we are witnessing the emergence of more and more sensor-based data-centric systems. Indeed, this paradigm acknowledges the importance of data (and therefore of data quality) within sensor-based IoT systems.
B. Observations and Quality of Observation (QoO)
Like many researchers before us, and in particular Perera et al. in [5], we distinguish several kinds of sensors: physical sensors are the most common kind consisting in concrete devices often used for environmental monitoring use cases;
virtual sensors are generally Web-based services that can be
queried through APIs; finally, logical sensors may combine information coming from both physical and virtual sensors. Regardless of their type, all these sensors generate observa-tions, which may be seen as the representation of an observed phenomenon (e.g., the temperature of a place) or an event (e.g., availability of a new software update) at different granularity levels [6].
Several quality dimensions have been envisioned in order to characterize observations. Among them, we can cite Qual-ity of Service (QoS) [1], QualQual-ity of Information (QoI) [7] or even Context annotation [8]. Such quality dimensions generally define quality attributes that aim at characterizing how fit-for-use is an observation for a specific use by an application (specific context). Table I gives five examples of quality attributes that may be used to characterize sensors or observations. For instance, using both latency (network QoS) and timeliness (QoI), an application may better understand if some outdated observations are the result of poor network performances or due to a sensor sampling rate too low. Recent related work includes the CityPulse framework [9], which also considers QoI (with the computation of collection point-related Key Performance Indicators) and QoI inspection (with tools such as the CityPulse QoI Explorer). However, this frame-work mainly aims at providing large-scale stream processing solutions for Smart City applications.
In this paper, we consider Quality of Observation (QoO) as “the actual observation value for a specific consumer given a specific Context”. To remain compliant with previous definitions, we acknowledge the fact that QoO can be impacted by network QoS and we consider QoS as the assembly of network QoS and QoO.
C. Semantics and Ontologies
Ontologies have proven to be suitable for addressing het-erogeneity within sensor-based systems. They are mainly used to 1) abstract sensors and their capabilities and 2) annotate observations according to common concepts to enable their sharing and understanding by other systems. The most popular
Attribute
name Common definition
Mentioned in
Accuracy Distance between reported observations and
the corresponding phenomenon/event.
[7], [2]
Provenance Sensor or mechanism that has output the
observation.
[7]
Reputation Publicly held opinion of a sensor or
interme-diary mechanism.
[7]
Latency Duration to retrieve an observation (including
network transport time).
[7]
Timeliness Time horizon over which an observation is
considered as valid.
[7], [2]
TABLE I: Examples of quality attributes used for observation and sensor characterization. For more metrics, see [7]. ontology for sensors and observations is without any doubt the Semantic Sensor Network (SSN) ontology developed by the W3C [10], [11]. Regarding sensor abstraction, integra-tion platforms generally use ontologies to describe sensor capabilities (what are their type, their sampling rate, their units, etc.). This mechanism allows to consider sensors as abstract observation providers, enhancing their reusability and the global interoperability of the solution.
III. THE IQAS PLATFORM
Before diving into results, we kindly remind the reader that iQAS is a prototype of an integration platform for QoO Assessment as a Service [12]. iQAS is interoperable, exten-sible, configurable and usable by stakeholders with different skills and interests. In this paper, we present new unpublished material by detailing 1) concrete implementation choices that we made during the development of our platform and 2) ex-perimental results for the three deployment scenarios. Please note that the source code of any iQAS component presented in this paper is available upon simple request.
A. Reminder of iQAS Requirements
In [12], initial functional (F) and non-functional (NF) requirements for the iQAS platform were expressed as follows: F1 Users should be able to submit queries with QoO
con-straints about a couple topic/location;
F2 Users should be able to monitor QoO attributes in real-time according to several granularity levels;
F3 Users should be able to develop their own mechanisms to provide QoO guarantees;
F4 Users should be able to express the impact of these mechanisms on QoO attributes;
NF1 The platform should be usable and configurable by stake-holders with different skills;
NF2 The platform should be extensible by supporting integra-tion of new protocols and observaintegra-tion sources;
NF3 The platform should be interoperable; NF4 The platform should be scalable.
B. The QoOnto ontology
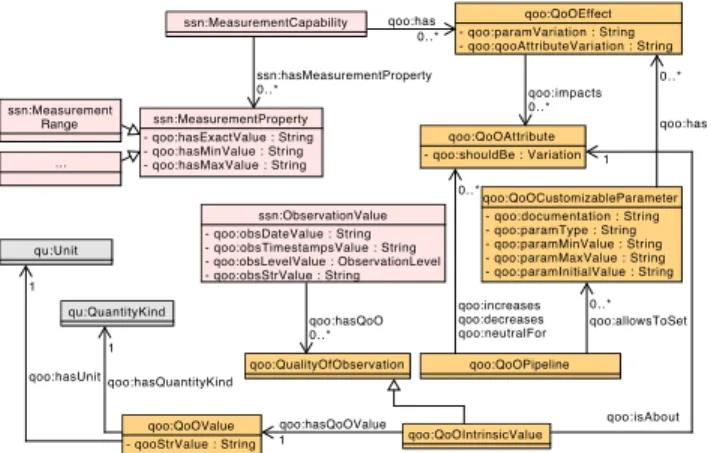
Extensibility (NF2) and interoperability (NF3) requirements have led to the development of the QoOnto ontology (see Figure 1). This ontology, which makes the link between
qoo:isAbout qu:QuantityKind qu:Unit qoo:QoOIntrinsicValue qoo:QoOValue - qooStrValue : String qoo:QualityOfObservation qoo:QoOPipeline qoo:QoOCustomizableParameter - qoo:documentation : String - qoo:paramType : String - qoo:paramMinValue : String - qoo:paramMaxValue : String - qoo:paramInitialValue : String qoo:QoOAttribute - qoo:shouldBe : Variation ... ssn:ObservationValue - qoo:obsDateValue : String - qoo:obsTimestampsValue : String - qoo:obsLevelValue : ObservationLevel - qoo:obsStrValue : String qoo:QoOEffect - qoo:paramVariation : String - qoo:qooAttributeVariation : String ssn:Measurement Range ssn:MeasurementCapability ssn:MeasurementProperty - qoo:hasExactValue : String - qoo:hasMinValue : String - qoo:hasMaxValue : String qoo:hasQuantityKind 1 qoo:hasUnit 1 qoo:hasQoOValue 1 1 qoo:hasQoO 0..* qoo:increases qoo:decreases qoo:neutralFor 0..* qoo:allowsToSet 0..* qoo:has 0..* qoo:impacts 0..* qoo:has 0..* ssn:hasMeasurementProperty 0..*
Fig. 1: Overview of main classes and relationships for the QoOnto ontology used by our iQAS platform
people, process, data and things (as envisioned by the IoE), reuses the existing to not reinvent the wheel. In compliance
with Linked Data1 best practices, it imports parts of the
W3C SSN, IoT-Lite and Quantity Kinds & Units ontologies. More concretely, the QoOnto ontology allows users to express existing relationships between several concepts used within the iQAS platform. For instance, as shown by Figure 1, an
ObservationValue may have a QoOIntrinsicValue, which is
related to a QoOAttribute (e.g., accuracy) and consists in a QoOValue (e.g., 100%). Besides, within iQAS, domain-specific experts (e.g., meteorologists) may use their knowl-edge in order to develop a new QoOPipeline, which is the succession of several transformation functions (called QoO mechanisms) successively applied on observations that flow throughout the iQAS platform.
For the experiments that we performed in this paper, we instantiated the QoOnto ontology by defining three instances of the QoOAttribute class:
• OBS_ACCURACY is the distance between a reported observation and its corresponding phenomenon or event. For a given observation, we assumed that its accuracy was equal to 100% when its value was within the sensor measurement range and 0% otherwise.
• OBS_FRESHNESSis defined as the age of an observation when it becomes available for final consumers. Annotated to each observation, it measures the additional latency due to 1) transport time over the collection network and 2) iQAS processing time.
• OBS_RATE refers to the number of observations that the platform effectively delivers by unit of time for a given request (e.g., 3/second). On the contrary of the two previous attributes, this metric refers to an observation flow rather than a single observation.
C. Implementation and Deployment
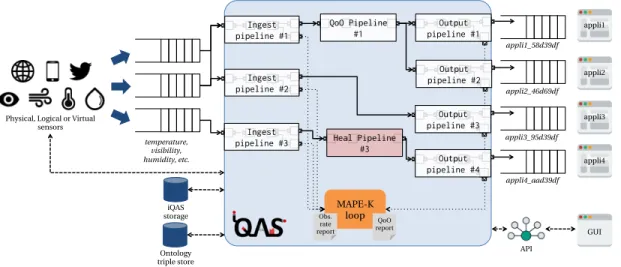
1) Implementation: we developed iQAS following a
data-flow component-based architecture (see Figure 2 for an
1http://linkeddata.org
overview). Main iQAS components have been implemented
according to the Actor model, thanks to the Akka toolkit2.
iQAS enables adaptation (with both auto-(re)configuration and QoO-based adaptation) by implementing an adaptation
control loop (denoted as the “MAPE-K3 loop” in Figure 2).
Adaptation is continuously performed by monitoring the QoO provided by iQAS to its different consumers. When possible, the platform can try to “heal” a request by deploying a set of mechanisms chained to form a “QoO Pipeline”. In order to make such a decision, the platform should reason on the QoOnto ontology, performing inference to select a suitable
QoOPipelinecandidate, when available.
2) Deployment: for this experimentation campaign, we
locally deployed the different iQAS components on a Mac Pro server 2013 with 3.7 GHz Quad-Core Intel Xeon E5 processor and 32 GB RAM.
D. The iQAS ecosystem
As part of the iQAS ecosystem, two additional tools have been developed to specifically evaluate functional require-ments F1, F2 and F4 of the platform. The first tool is a Virtual Sensor Container (VSC) image, which allows to create virtual sensors that may generate observations at random, from file or by first retrieving them from other observation sources (such as the Web) as a transparent proxy. The second tool is a Virtual Application Consumer (VAC) image, which allows to emulate fake consumers that submit iQAS requests and then consume observations while reporting back the perceived QoO to the iQAS platform in real-time. Both these tools are
two Docker4 container images. We chose to use the Docker
virtualization for its great modularity and reusability: once a Docker image has been defined, it is easy to deploy several container instances that may accept custom parameters at run-time. Besides, since virtualization is performed at application level, containers are less resource demanding than common Virtual Machines.
IV. SCENARIO1: SMARTCITIES
A. Motivation and Scenario considered
The motivation to envision QoO within Smart Cities has already been extensively described in the original paper that introduced the iQAS platform [12]. In the same paper, we have also shown the benefits to apply some QoO Pipeline (such as observation filtering) on observation streams to cope with systematic errors of sensors.
For this first use case, let us consider two stakeholders: Matt, the first one, is a city employee in charge of the sensor maintenance; Maggie is a meteorologist for a private weather forecast company. Let us imagine that Matt is asked to check the good working of all visibility sensors across the city. In parallel, Maggie is interested in collecting visibility measurements to release a weather report for an upcoming
2http://akka.io
3Monitor, Analyze, Plan, Execute according to a Knowledge base 4https://www.docker.com
MAPE-K loop QoO report Obs. rate report appli1_58d39df temperature, visibility, humidity, etc. appli1
Physical, Logical or Virtual sensors Ingest pipeline #1 Ingest pipeline #2 QoO Pipeline #1 Ingest pipeline #3 appli2 appli3 appli4 appli2_46d69df appli3_95d39df appli4_aad39df Output pipeline #1 Output pipeline #3 Output pipeline #4 Output pipeline #2 iQAS storage Ontology triple store GUI API Heal Pipeline #3
Fig. 2: iQAS: an integration platform for QoO Assessment as a Service airshow that will take place on the same day. In this case,
both stakeholders are interested in visibility for the same spatiotemporal context, but with different QoO needs. As a domain-expert, Maggie only wants to retrieve accurate obser-vations, which will help her to write her weather report and make accurate forecasts. For physical sensors, this requirement mainly translates into selecting records that have a consistent value regarding their sensor’s measurement range. As visibility is a distance measurement, Maggie specifies that she only wants to retrieve positive observation values. Matt’s needs are different: even if he surely also knows that visibility sensors only output positive measurements, he wants to identify the defective ones in order to replace or repair them. Therefore, he decides to submit a query with no specific thresholds. He could also had limited the received observations to the interval ] − ∞, 0[.
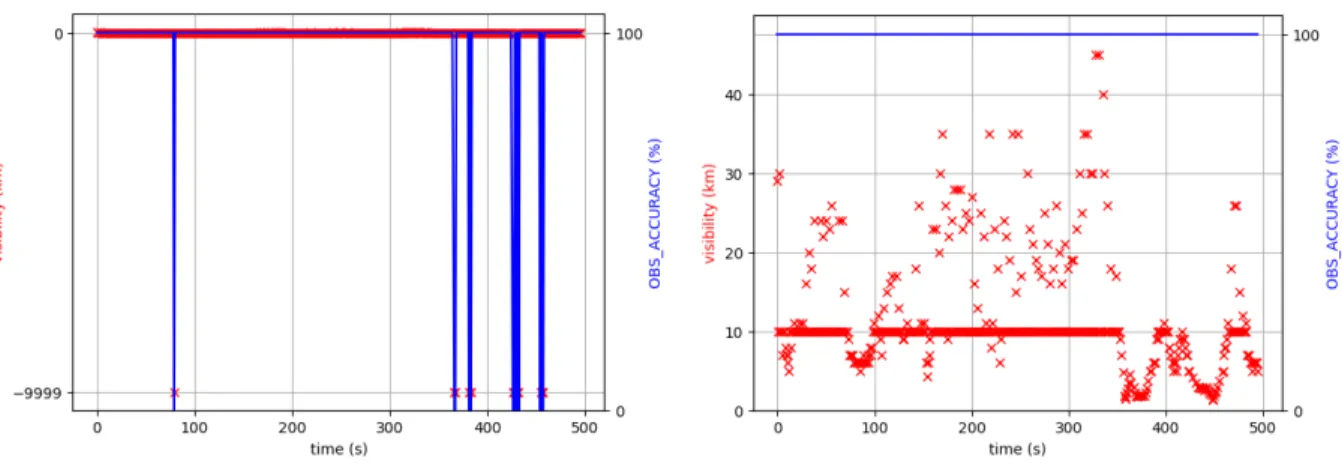
To emulate this Smart City use case, we created two VACs for our stakeholders Matt and Maggie. Each VAC submitted a representative request to our iQAS platform. In response, iQAS auto-configured itself by creating two observation pipelines, reusing the first pipeline to construct the second one. Then, we created a VSC to emit observations corresponding to a raw visibility dataset recorded in the city
of Aarhus in Denmark5 from February 2014 to June 2014 at
the sensing rate of 2 measurements per second. This dataset was chosen specifically since we were aware that it contained some systematic measurement errors (with some values equal to −9999 km). As soon as we started the VSC, observations started to flow throughout iQAS and were delivered to the two VACs. While consuming the visibility observations, the VACs reported to iQAS the QoO for the received observations, enabling real-time visualization (see Figure 3 for the first 500 seconds of the simulation).
B. Results and Analysis
As expected, Figure 3a shows several visibility values equal to −9999 km, which have been annotated as “not accurate”
5http://iot.ee.surrey.ac.uk:8080/datasets.html#weather
by the iQAS platform (0% for OBS_ACCURACY, as defined in Section III-B). In comparison, the QoO visualization for Maggie the meteorologist only contains accurate visibility observations (OBS_ACCURACY = 100%) according to the iQAS platform. The first lesson learned from this deployment scenario is that QoO can be significantly improved by the deployment of intermediary transformation functions such as filtering. The second lesson learned is that QoO needs are best expressed by the final consumers who will consume observations. For instance, if iQAS had automatically filtered inaccurate visibility observations, Matt could not have iden-tified and replaced faulty sensors. As a result, developers should avoid to implement default behaviors, especially when it comes to QoO. Finally, inaccurate observations may some-times represent high-quality observations and actually worth something for some consumers. Therefore, the expression of some QoO constraints may help to precise the definition of a “good-quality observation”.
V. SCENARIO2: WEB OFTHINGS
A. Motivation and Scenario considered
The Web of Things (WoT) [13] is another paradigm en-compassed by the IoE. The WoT is generally defined as a set of practices, architectures and programming patterns used in order to expose sensors to the World Wide Web. For instance, a real-world physical sensor that can be remotely accessed through the Internet using main HTTP verbs (GET, POST, etc.) can be considered as being part of the WoT. Current trends regarding the number of connected Things show that more and more physical sensors will continue to be abstracted as virtual sensors in the next years. This second deployment scenario gives us the opportunity to study some QoO-related challenges that can be raised by the integration of third-party observation sources. First, we created a free account on the
OpenWeath-erMap website6in order to use the “current weather data” API
that it provides. We only applied for a free plan that allows no more than 60 API calls per minute. API documentation says
(a) QoO visualization for the maintenance request (b) QoO visualization for the meteorologist request
Fig. 3: Visibility measurements with OBS_ACCURACY assessment for two different iQAS requests that “current weather is frequently updated based on global
models and data from more than 40000 weather stations”. In order to integrate this virtual sensor to iQAS, we used a new VSC as a proxy that we configured to retrieve the current temperature in the city of London from this API at a rate of 2 observations per second. Then, we submitted an iQAS request for temperature measurements with a QoO constraint regarding OBS_RATE (guaranteed minimum of 2 observation per second). Finally, we counted the number of observations received by grouping them based on 10-second windows.
B. Results and Analysis
Despite the QoO needs and the guaranteed Service Level Agreement (SLA) submitted to iQAS, Figure 4 shows that the platform was only able to retrieve 60 temperature records per minute maximum (for the intervals [0, 60[, [60, 120[, [120, 180[ and so on). This result is consistent with the fact that the free plan of OpenWeatherMap only allows 60 calls per minute maximum for a same API key. Integration platforms (such as iQAS) are systems of systems. As a consequence, their ability to meet SLAs is often conditioned by other resources (such as external observation sources, Cloud-based infrastructure for commercial platforms, etc.). In fact, the OpenWeatherMap API could be seen as a virtual sensor that has a maximum sensing rate of 1 observation per second. Furthermore, its capabilities are also conditioned by the ones of the sensors (physical or virtual) that it uses in turn. The main lesson to be learned from this deployment scenario is that ensuring QoO guarantees requires a deep knowledge of the available resources as well as their characteristics. As a result, capabilities of third-party observation sources should always be carefully identified and described. In that way, semantics can help to make the link between an observed symptom (e.g., sensor unavailability) and its cause (e.g., battery drained for a physical sensor; API call limit reached for a virtual sensor). To provide finer QoO guarantees, we strongly believe that more research is required to better describe sensor capabilities (according to their type, as they evolve over time, etc.).
Fig. 4: OBS_RATE assessment for a Virtual Sensor Con-sumer (VSC) that retrieves temperature for the city of London through the OpenWeatherMap API (free plan allowing no more than 60 API calls per minute)
VI. SCENARIO3: CHALLENGINGENVIRONMENTS
A. Motivation and Scenario considered
So far, we only considered scenarios where sensors had permanent connection to the Internet. The objective of this deployment scenario consists in assessing the impact of post-disaster areas on QoO. We define as “post-post-disaster” the envi-ronments where sensors could have intermittent connection to the Internet. To emulate such environments, we envision Delay Tolerant Networks (DTNs) [14] where observation collection is performed in a decentralized peer-to-peer manner according to the store-and-forward paradigm. To that end, we reused HINT [15], which is a self-developed hybrid emulation system for opportunistic networks where nodes can be either Android phones or virtual ones. For more details on our HINT emulator, the interested reader can refer to the associated publication. First, we developed a specific asynchronous adapter Python class to poll observations from HINT as soon as they arrive. We used this adapter to configure a new VSC that acts as a transparent proxy between the HINT emulator and the iQAS platform. Then, we submitted a request without any QoO
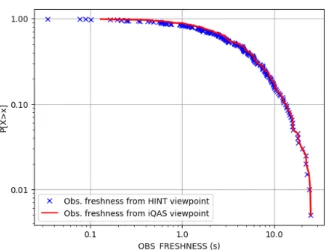
Fig. 5: CCDF for the OBS_FRESHNESS for observations generated by a single HINT node and consumed by a single iQAS consumer (log-log scale)
constraints to retrieve all observations coming from the HINT emulator. Finally, within HINT, we generated 200 observations from a real node to a gateway node. Each message had to be first internally exchanged within HINT in a peer-to-peer manner before reaching the gateway node where it was consumed by our VSC. Once that all messages were delivered to iQAS consumers, we computed offline the freshness (the age) of the observations when 1) they arrived at the HINT gateway node (HINT viewpoint) and 2) they were delivered by iQAS to consumers (iQAS viewpoint).
B. Results and Analysis
Figure 5 depicts the Complementary Cumulative Distribu-tion FuncDistribu-tion (CCDF) that represents the age of the observa-tions from both HINT and iQAS perspectives. For example, this figure shows that, in more than 10% of time, observations that are effectively consumed by iQAS consumers are, at least, 15-second old. Beyond freshness’ order of magnitude that may vary depending on the HINT configuration, the main lesson to retain from this deployment scenario is that the overhead intro-duced by the iQAS platform in terms of delay can be negligible compared to the routing overhead introduced when observation collection is achieved in a peer-to-peer decentralized way. Therefore, in order to significantly improve the overall service provided to their end-users, IoE platforms should consider both network QoS (e.g., latency) and QoO (e.g., freshness) as complimentary quality dimensions.
VII. CONCLUSIONS AND PERSPECTIVES
Our research work aims at raising awareness about the QoO notion and promoting the characterization of observation qual-ity within sensor-based systems. The challenge is considerable as providing QoO guarantees is an ambitious task that depends on many parameters including use cases, software used and configuration.
In this paper, we envisioned three IoE-related deployment scenarios for a QoO-aware integration platform. For each of
them, we presented experimental results obtained with the help of iQAS, a custom integration platform for QoO assessment as a service. To better understand results, we briefly recalled the main requirements for iQAS, as well as the main implemen-tation choices that we made during its development. Then, by introducing specific QoO attributes tailored for each use case, we managed to draw some QoO-related lessons that integration platforms should take into account in order to correctly fulfill the IoE. Hence, the study of observation accuracy within Smart Cities confirmed that there might be several definitions of a “good-quality observation”; the analyze of observation rate allowed us to identify limiting capabilities for virtual sensors; finally, the study of freshness for observations reported in a decentralized way demonstrated that network QoS and QoO are two complementary quality dimensions that should be used together in order to improve the overall service provided to end-users, especially within post-disaster areas.
As future work, we plan to pursue the study of the QoO notion and perform more complex deployment scenarios with iQAS. We also plan to conduct an extended performance evaluation campaign of the platform.
ACKNOWLEDGEMENT
This research was supported in part by the French Ministry of Defense through financial support of the Direction Générale de l’Armement (DGA).
REFERENCES
[1] ITU-T, “E.800: Definitions of terms related to QoS,” Sep. 2008. [2] P. Barnaghi et al., “Challenges for Quality of Data in Smart Cities,” J.
Data and Information Quality, vol. 6, no. 2-3, pp. 6:1–6:4, 2015. [3] J. Bradley et al., “Internet of Everything: A $4.6 Trillion Public-Sector
Opportunity,” Cisco, White Paper, 2013.
[4] L. Atzori et al., “The Internet of Things: A survey,” Computer Networks, vol. 54, no. 15, pp. 2787–2805, Oct. 2010.
[5] C. Perera et al., “Context Aware Computing for The Internet of Things: A Survey,” IEEE Communications Surveys Tutorials, vol. 16, no. 1, pp. 414–454, 2014.
[6] A. Sheth, “Internet of Things to Smart IoT Through Semantic, Cognitive, and Perceptual Computing,” IEEE Intelligent Systems, vol. 31, no. 2, pp. 108–112, 2016.
[7] C. Bisdikian et al., “On the Quality and Value of Information in Sensor Networks,” ACM Trans. Sen. Netw., vol. 9, no. 4, pp. 48:1–48:26, 2013. [8] A. K. Dey, “Understanding and Using Context,” Personal and ubiquitous
computing, vol. 5, no. 1, pp. 4–7, 2001.
[9] D. Puiu et al., “Citypulse: Large scale data analytics framework for smart cities,” IEEE Access, vol. 4, pp. 1086–1108, 2016.
[10] M. Compton et al., “The SSN ontology of the W3c semantic sensor network incubator group,” Web Semantics: Science, Services and Agents on the World Wide Web, vol. 17, pp. 25–32, 2012.
[11] “Semantic Sensor Network Ontology,” W3C Editor’s Draft, 2017. [Online]. Available: http://w3c.github.io/sdw/ssn/
[12] A. Auger et al., “iQAS: An Integration Platform for QoI Assessment as a Service for Smart Cities,” in IEEE World Forum on Internet of Things 2016, Reston, VA, USA, 2017, pp. 88–93.
[13] D. Guinard and V. Trifa, “Towards the Web of Things: Web Mashups for Embedded Devices,” in WWW MEM 2009, Madrid, Spain, Apr. 2009. [14] K. Fall and S. Farrell, “DTN: an architectural retrospective,” IEEE
Journal on Selected areas in communications, vol. 26, no. 5, 2008. [15] G. Baudic et al., “HINT: from network characterization to opportunistic