HAL Id: hal-01001817
https://hal.archives-ouvertes.fr/hal-01001817
Submitted on 5 Jun 2014
HAL is a multi-disciplinary open access
archive for the deposit and dissemination of
sci-entific research documents, whether they are
pub-lished or not. The documents may come from
teaching and research institutions in France or
abroad, or from public or private research centers.
L’archive ouverte pluridisciplinaire HAL, est
destinée au dépôt et à la diffusion de documents
scientifiques de niveau recherche, publiés ou non,
émanant des établissements d’enseignement et de
recherche français ou étrangers, des laboratoires
publics ou privés.
Beyond Contact Predictions in Mobile Opportunistic
Networks
Alexandru Tatar, Tiphaine Phe-Neau, Marcelo Dias de Amorim, Vania
Conan, Serge Fdida
To cite this version:
Alexandru Tatar, Tiphaine Phe-Neau, Marcelo Dias de Amorim, Vania Conan, Serge Fdida. Beyond
Contact Predictions in Mobile Opportunistic Networks. IEEE/IFIP Annual Conference on Wireless
On-demand Network Systems and Services (IFIP/IEEE WONS), Apr 2014, Obergurgl, Austria. pp.65
- 72, �10.1109/WONS.2014.6814723�. �hal-01001817�
Beyond Contact Predictions in Mobile
Opportunistic Networks
Alexandru Tatar
⋆, Tiphaine Phe-Neau
⋆, Marcelo Dias de Amorim
⋆⋄, Vania Conan
†, and Serge Fdida
⋆ ⋆Sorbonne Universit´es, UPMC Univ Paris 06, UMR 7606, LIP6, F-75005, Paris, France ⋄ CNRS †Thales Communications & Security
Abstract—When studying and designing protocols for mobile opportunistic networks, most works consider only direct con-tact patterns between mobile nodes. Tracking these concon-tacts is important for end-to-end communications but relying only on this kind of information provides a limited view about transmission possibilities. Mobile users are often in intercontact, but still separated by only a few hops, which translate into effective communication opportunities between nodes. In this paper, we focus on such a type of communication opportunities and investigate to what extent they can be predicted. Using real-world datasets, we provide evidences about the predictable nature of nodes’ proximity and evaluate the benefits of these results compared to direct contact predictions.
Index Terms—Opportunistic networks, intermittent connec-tions, support vector machine, link prediction.
I. INTRODUCTION
The delay-tolerant network (DTN) paradigm has developed over the last few years [1]. Its growth comes from the de-mocratization of recent mobile technologies like smartphones, laptops, tablets, or game stations. These devices allow each person to carry wireless technologies and enables them to collect and disseminate data on the go. During the day, people encounter each other at random locations in the street, the public transportation system or at work. By coming close to one another, these persons are able to transmit information to each other via short range wireless technologies like Wi-Fi Direct or Bluetooth.
The design of efficient communication protocols in DTNs depends in great part on the capacity to understand and predict human mobility patterns. Thus, over the last years, several studies have revealed important insights about contact durations between mobile users [2], the periodicity of human encounters [3], or the network structures created by human meeting patterns [4]. Uncovering these mobility patterns can then be used to design measures that facilitate the prediction of contacts between nodes. This includes the use of frequency of contacts to identify similarities in mobility characteristics [5], or in finding strongly-connected mobile users that could serve as message carriers [6]. While these metrics are used as good heuristics to the contact prediction problem, they provide only a limited view on the future contact opportunities. A more advantageous but laborious approach to this problem is to predict the contact patterns.
Recent studies have addressed the problem of contact prediction – predict if two nodes are going to be in direct transmission range – and have revealed that, under the right prediction method and predictive features, contacts between mobile users are to a certain extent predictable [7]. This result is valuable as it allows one to predict the evolution of the network of human interactions that can be used to design more effective DTN communication protocols.
But contacts between nodes are not the only type of relationship between mobile users. Often, users may find themselves not in direct transmission range but still in the nearby vicinity. Thus, to have a broader view on the available communication opportunities, the extended notion of contact, namely κ-contact, has recently been proposed [8]. Previous analyses showed that considering only contacts between nodes ends up in a biased suboptimal network understanding while studying κ-contacts provides a more complete understanding on the available end-to-end communication opportunities.
In this work, we study the predictability of extended contact opportunities in DTNs. Using data from three human-based contact traces, we show that κ-contact opportunities are more predictable than direct contact relationships. To measure the possible impact of this finding in a real-world application, we propose an experimental setting that supports the idea that κ-contact prediction has an interesting potential usage. Our contributions in this paper can be summarized as follows:
• We provide insights on the κ-contacts relationships be-tween mobile nodes and show that considering only direct contacts covers a limited part of the end-to-end transmission possibilities. We reveal the instability of periods of time nodes stay at the same distance, and that κ-contact intervals display better predictability character-istics: intervals frequency and length.
• Using a supervised prediction framework, we study the predictive nature of κ-contacts and compare it with the traditional case of predicting contacts between nodes. Our results indicate that, in highly dynamic mobile settings (e.g. rollerblading scenario), predicting that nodes will remain at a distance of at most two hops from one another, can attain twice the performance of a direct contact prediction.
• Through simulations, we evaluate the impact of κ-contact prediction in a service that would benefit from predicting contacts between mobile users. The experimental results 978-1-4799-4937-3/14/$31.00 c 2014 IEEE
0 20 40 60 80 100 contact intercontact % o f to ta l
(a) Current vision.
0 20 40 60 80 100 contact 2 3 4 5 6 7 8 ∞ % o f to ta l (b) Vicinity-aware vision. Fig. 1. Sig09example: current vision versus vicinity awareness.
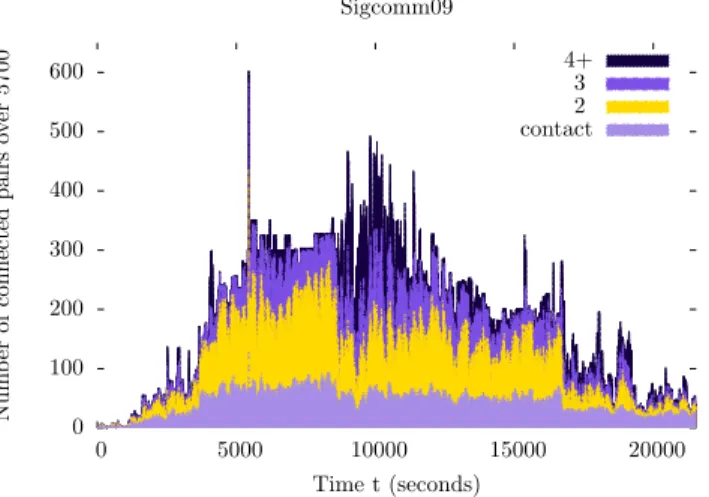
0 100 200 300 400 500 600 0 5000 10000 15000 20000 Nu m b er of con n ec te d p ai rs ov er 5700 Time t (seconds) Sigcomm09 4+ 3 2 contact
Fig. 2. Sig09end-to-end transmission opportunities.
show that there is a higher potential on relying on κ-contact prediction compared to the traditional κ-contact case.
The remainder of this paper is structured as follows: Sec-tion II details the κ-vicinity noSec-tion as well as κ-contact and the datasets used in our study. Sections III exposes interesting facts about κ-contacts relationships while Section IV describes the prediction framework and reports the prediction perfor-mance. Finally, we link our work to the existing literature in Section VI and conclude our study in Section VII.
II. VICINITY ANDDATASETS
A. Is contact enough?
Current DTN approaches only consider network knowledge coming from nodes in contact. While this approach may be simple, it has proven to be efficient in making decisions to forward data in DTNs. However, we realize that there is more at hand than simple contact information. In Fig. 1, we repre-sent some interesting facts about two nodes from Sig09 dataset (see Section II-C for more details on this dataset).
In Fig. 1(a), we plot the proportion of time nodes spend in contact and in intercontact (not in contact) according to the traditional approach. They stay around 6% of the time in contact and the remaining 94% in intercontact. However, when we observe the same situation under a vicinity-aware
i i
1-vicinity 2-vicinity
Fig. 3. Example of κ-vicinity. The 1-vicinity consists in only node i’s contacts (1-hop distance). The 2-vicinity consists in all i neighbor’s whose shortest distance is inferior to 2 hops.
point of view (see Fig. 1(b)), we see that these nodes stay 6% of their time in contact but they also remain at a 2-hop distance around 20% of the time and at a 3-hop distance around 10% of the time. The time that the nodes spend without any end-to-end path linking them (∞) is only 57% of the experiment duration; far below the 94% intercontact time illustrated in Fig. 1(a). Considering only the time spent at a 2-hop distance improves our understanding of the duration that the two nodes are linked by an end-to-end path by a factor of3.
At a network-wide level, we observe that contacts also rep-resent a minor part of end-to-end transmission opportunities. In Fig. 2, we represent the number of connected pairs by their shortest distances for the beginning of the Sig09 dataset. The bottom layer indicates the number of nodes that are in contact, the yellow layer shows nodes connected by 2-hop paths and so on. It becomes clear that most end-to-end opportunities come from 2-hop paths and not from contacts. Therefore, ignoring such opportunities results in a waste of connectivity assets.
B. κ-vicinity, κ-contact, and κ-intercontact
To characterize a vicinity in DTN, we use the concept of κ-vicinity [9]. We discriminate a node i’s vicinity according to the number of hops between i and its surrounding neighbors. Note that in our definition, we assume that connectivity is bidirectional, as a result κ-vicinity relationships are symmetric. Definition 1. κ-vicinity. The κ-vicinityVi
κof node i is the set
of nodes with shortest paths of length at most κ hops from i.
Clearly,Vi
κ−1 ⊂ Vκi. In Fig. 3, we illustrate the1-vicinity and 2-vicinity for node i. The κ-vicinity’s relevancy comes from the proximity of nodes. The shortest distance is one of the easiest characteristics to gather in opportunistic networks. We need to extend the notion of contact and intercontact to the κ-vicinity as from now on, they represent our point of view in the network.
Definition 2. κ-contact. Two nodes are in κ-contact when
they dwell within each other’s κ-vicinity, with κ∈ N∗. More
formally, two nodes i and j are in κ-contact when{i ∈ Vj κ} ≡ {j ∈ Vi
κ}. In other words, a contemporaneous path of length
at most κ hops links i and j. Note that,1-contact represents
TABLE I
DATASETS CHARACTERISTICS.
Dataset # Duration Probing Type
Infocom05 41 12h 120s Conference
Sig09 76 1 day 120s Conference
Rollernet 61 1h30 15s Sport TABLE II
DISTANCE AVERAGE DURATION(IN SECONDS).
κ
Dataset 1 2 3 4 5 6 7
Infocom05 399 296 224 175 131 154 212
Sig09 149 83 41 25 18 13 11
Rollernet 48 65 76 89 105 114 129
Definition 3. κ-intercontact. Two nodes are in κ-intercontact
when they do not belong to each other’s κ-vicinity (there is no path of length κ or less linking the two nodes). Note that,
1-intercontact represents simple intercontact.
C. Datasets
We consider several real-world contact traces throughout our experiments.
Infocom05measurement was held during a 5 days conference in 2005 [2]. 41 attendees carried iMotes collecting information about other iMotes nearby within a 10m wireless range. We study a 12-hour interval bearing the highest networking activity. Each iMote probes its environment every 120 seconds.
Infocom05 represents a professional meeting framework. Sig09 was taken during the first day of a conference in Barcelona [10]. The experiment recorded 76 users relation-ships using Bluetooth-based smartphones. Each phone logged contacts every 120 seconds.
Rollernethad 62 participants measuring their mutual connec-tivity with iMotes during a 1 hour and a half rollerblading tour in Paris [11]. These iMotes sent beacons every 15 seconds. This experiment shows a specific sport gathering scenario.
In Table I, we recapitulate all datasets characteristics. # is the number of participating nodes. Duration indicates the dataset duration. Probing shows the probing intervals of the measuring devices.
III. PAIRWISE INTERACTIONS UNDER THEκ-CONTACT CASE
Given the new definitions of contact and intercontact we analyze different characteristics of the pairwise interactions. For more detailed information concerning contact and κ-intercontact, please refer to [9].
A. Pairwise minimum distance
We begin by studying the pairwise minimum distance, i.e., how close nodes come to each other during the duration of a trace. For instance, if two nodes meet at least once, we mark
0 20 40 60 80 100
Infocom05 Sig09 Rollernet
%
of
tot
al
δvalue (in seconds)
∞ 1 2 3 4 5+
Fig. 4. Pairwise minimum distance for Infocom05, Sig09, and Rollernet. TABLE III
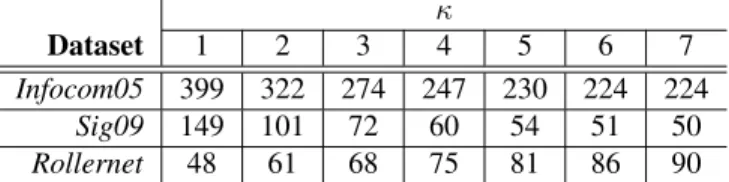
κ-CONTACT AVERAGE DURATION(IN SECONDS).
κ
Dataset 1 2 3 4 5 6 7
Infocom05 399 322 274 247 230 224 224
Sig09 149 101 72 60 54 51 50
Rollernet 48 61 68 75 81 86 90
this distance as1. If they come as close as 3 hops, we consider the minimum distance to be 3. For nodes that never come in κ-contact, we consider this distance as∞.
We represent the results in Fig. 4. In terms of pairs of nodes that come in direct contact, we observe that in conference settings, characterized by a high number of nodes in restricted physical spaces, the number of connected pairs is reasonably high: 49% for Sig09 and 73% for Infocom05. Rollernet on the other hand shows a lower network connectivity, with only 33% of nodes coming in a direct contact. But the analysis of contact alone yields an incomplete picture as there is a considerable amount of nodes who come close to each other but never in direct contact. For example, the percentage of pairs that come at a distance of 2 is 5% for Infocom05, 16% for Sig09, and 41% for Rollernet. For Rollernet the percent of nodes that come at a 2-hops distance is even higher than the nodes that come in direct contact and one can observe that a non negligible amount of nodes advance up to a distance 3 (6%) and 4 (16%).
B. Average distance duration
In Table II, we present the average duration of an interval during which nodes remain at a distance of κ-hops from one another. For Infocom05 and Sig09, we observe that close connections are more stable, with smaller average durations as the distance between nodes increases. This shows how for conference settings, network stability comes from the core of the κ-vicinity. However, we observe the opposite phenomenon for Rollernet dataset. With larger κ we have an increase of
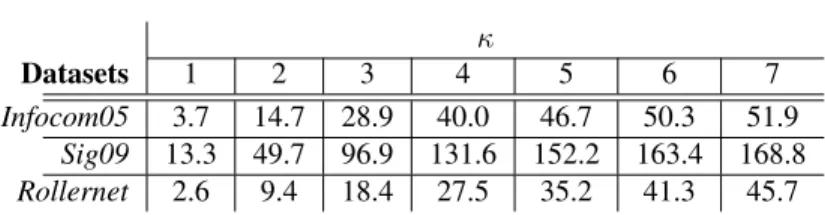
TABLE IV
κ-CONTACT NUMBER OF INTERVALS(×1, 000).
κ
Datasets 1 2 3 4 5 6 7
Infocom05 3.7 14.7 28.9 40.0 46.7 50.3 51.9
Sig09 13.3 49.7 96.9 131.6 152.2 163.4 168.8
Rollernet 2.6 9.4 18.4 27.5 35.2 41.3 45.7
the average duration that nodes spend at a certain distance from one another. Thus, due to nodes’ movement in a highly dynamic scenario, meeting between users lasts for very short periods of time but nodes spend a significant amount of time in the nearby vicinity.
C. Average κ-contact duration
We also study the average κ-contact durations (see Ta-ble III), i.e., we observe the average duration of any κ-contact interval. Following our logic, since we cover a wider spatial range with our κ-vicinity, nodes coming closer are likely to be in κ-contact earlier and leave the κ-contact later, therefore we should obtain longer κ-contact intervals. With Rollernet, we observe that the greater the value for κ, the longer the durations. Surprisingly for Infocom05 and Sig09, this is not the case, we actually notice the opposite phenomenon. With larger κ, we seem to have smaller κ-contact intervals. So does that mean that increasing our network vision with the κ-vicinity reduces the duration of end-to-end transmission possibilities? Table IV shows how wrong this conclusion may be. In this table, we show the actual number of κ-contact intervals for each κ and each dataset. For all of them, the greater the value of κ, the greater the number of κ-contact intervals. So, with higher κ values, we multiply the possibility of observing a κ-contact interval. They may be on average of shorter length (for Infocom05 and Sig09) yet we multiply the possibility of having pairwise end-to-end paths. In addition, the cumulated κ-contact duration grows with larger κ. A similar observation as well as an explanation has been made in a companion paper [9].
IV. PREDICTINGκ-CONTACT ENCOUNTERS
A. Dynamic graph representation
The mobile traces analyzed in this paper represent dynamic networks composed of a set of mobile users that sporadically come in contact. We represent this network using a dynamic graph structure, G0,T = (V, E0,T), with V the set of mobile users observed during a finite period of time [0, T) and E0,T the set of temporal edges between them. We consider an edge euv ∈ E0,T if any two users u, v ∈ V have been at least once into contact during the period [0, T). To analyze the evolution of this network over time, we split time into fixed time-windows of duration w and represent the dynamic network as a time series of network snapshots Gt1, Gt2, ..., Gtn, with n = ⌈
T
w⌉. Gti represents the aggregate graph Gti−1,ti that records the contacts between mobile users during the period [ti−1, ti). In a dynamic network, the future
changes of the network may depend not only on the most recent state of the network but also on older ones. To model the dynamic evolution and catch possible periodicities in human encounters, the data used as input in the prediction process is represented as a successive series of static snapshots Gti−m, ..., Gti−2, Gti−1. Thus, given data from the previous m time-windows our objective is to predict the κ-contacts during the next target period Gti. We will later discuss how the choice of w and m affect the prediction performance.
B. κ-contact prediction problem
We formulate the prediction task as a binary classification problem where, given past data recorded until a moment in time ti−1, the goal is to predict if any two mobile nodes will be in κ-contact during the subsequent period [ti−1, ti).
We rely on two types of information in the prediction model: the frequency of κ-contact occurrences and the structural prop-erties of the connectivity network. The first type of information measures the strength of κ-contact relationships, quantified by the duration and the number of times any pair of nodes has been in κ-contact in the past. A longer duration and a greater number of κ-contacts can provide stronger evidence that two nodes will be in κ-contact in the future. For the second type of information, to quantify the structural properties of the network, we extract various features that capture the proximity between nodes in the graph of past interactions. These fea-tures showed predictive power in various applications such as collaborative filtering and link prediction problems [12], [13], [14]. In this work we use four common proximity measures:
• Common neighbors (CN). For each pair of nodes u, v ∈ V, CN represents the number of common neighbors:
CN(u,v)= | V1u∩ V1v |. (1) • Adamic Adar [15]. This measure extends the notion of common neighbors by weighting each neighbor by the inverse logarithm of its degree centrality:
AdamicAdar(u,v)= X x∈{Vu 1∩V v 1} 1 | Vx 1 | . (2)
• Katz [16]. This feature counts all the paths between any pair of nodes, giving a higher weight to shorter paths. If pathl
u,v represents the set of paths of length l between two nodes u and v, and β is a damping factor (set to 0.05 in our evaluation), the Katz score is calculated using the following formula: Katz(u,v)= ∞ X l=1 βl× | pathl u,v |. (3)
• Preferential attachment[17]. This feature is built on the premise that the probability of a new contact is correlated with the product of nodes’ degree.
P A(u,v) = | V1u | × | V v
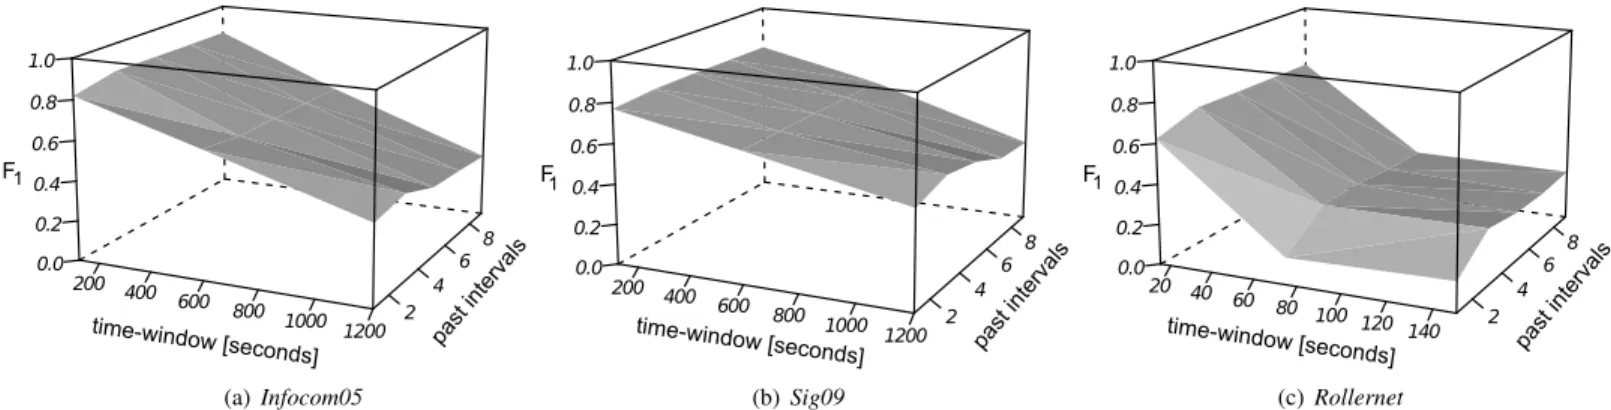
200 400 600 800 1000 1200 2 4 6 8 0.0 0.2 0.4 0.6 0.8 1.0 time-window [seconds] past inter vals F1 (a) Infocom05 200 400 600 800 1000 1200 2 4 6 8 0.0 0.2 0.4 0.6 0.8 1.0 time-window [seconds] past inter vals F1 (b) Sig09 20 40 60 80 100 120 140 2 4 6 8 0.0 0.2 0.4 0.6 0.8 1.0 time-window [seconds] past inter vals F1 (c) Rollernet
Fig. 5. Prediction performance for different time-window durations and by varying the number of training time-windows (past intervals).
TABLE V
NOTATION FOR THE BINARY CLASSIFICATION CONFUSION MATRIX
Predicted value predicted = 1 predicted = 0
Actual value actual = 1 T P F N
actual = 0 F P T N
The two types of features provide complementary informa-tion about nodes’ contact patterns. The frequency of interac-tions catches the persistence of κ-contact relainterac-tionships but its predictive power is conditioned by the past contact occurrences (using these features one can only predict the reoccurrence of a κ-contact). Topological features, on the other hand, allow us to capture complex data patterns about the structure of the network of interactions. We build the prediction model and report the results using the entire set of features as we observed that taking these features together achieves a higher performance than using them separately.
We adhere to a supervised learning procedure in our evalu-ation. Each mobile trace is split in two equal-sized temporal parts: the first period is used as the training set and the remaining part serves to report the prediction performance. We examined two classification algorithms: SVM (using LIBSVM library [18]) and logistic regression, under different parameter settings and used a validation set to avoid overfitting. We report the quality of the prediction using the F1 score (also called F -measure), expressed as the harmonic mean between precision ( T P
T P+F P) and recall ( T P
T P+F N) as defined by the confusion matrix (Table V).
C. The effect of time-window duration and past data
The prediction performance is influenced by the duration of the time-window. Aggregating data over longer durations may lose useful temporal information about the structure of the dynamic network. Another important aspect is given by the number of training time-windows. Including more information from the past may capture important temporal patterns but also increase the computational cost.
To evaluate the impact of past information in the predic-tion performance we vary the amount of data used in the prediction model and include information from the previous {1, 3, 5, 7, 9} time-windows. We illustrate the results for the
1-contact case as we observed that the remarks made on this value are consistent with other κ values as well. For the size of the time-window we select the most granular duration (the scanning rate used in the mobile trace) and two other values that represent 5× and 10× this duration. Thus, we consider time-windows of duration{120, 600, 1200} seconds for Sig09 and Infocom05 and use {15, 75, 150} seconds for
Rollernet(which has a more granular frequency).
The results are presented in Fig. 5 by means of 3D plots that represent the F1 score as a function of the time-window duration and the number past time-windows used in the prediction model. On the x-axis we examine different time-window durations and the y-axis (labeled past intervals in Fig. 5) denotes the number of time-windows used in the prediction model. For example, a past interval of length 9 for a time-window of 1200 seconds means that, based on the contacts recorded during the previous 9 intervals of 1200 seconds, we predict contacts during the next time-window.
The figure illustrates that the most recent information plays the most important role in the prediction performance. For all three datasets, using data from the latest three time-periods achieves the highest performance and older informa-tion has little predictive power. This indicates that the most recent interactions are the most important in predicting the immediate future. We can also observe that the longer the duration of the time-window, the less accurate the prediction performance. This suggests that aggregating data over longer durations is prone to larger errors. Taking the example of
Infocom05 (Fig. 5(a)), the results show that predicting the contact opportunities during the next 2 minutes shows an F1 score of 0.8 and the performance drops with 50% when trying to predict what will happen during the next 20 minutes. For
Rollernet, which represents a more dynamic scenario, the drop of performance is even higher with a 70% decrease when trying to predict the contacts during the next 150 seconds compared to a 15-seconds time-window.
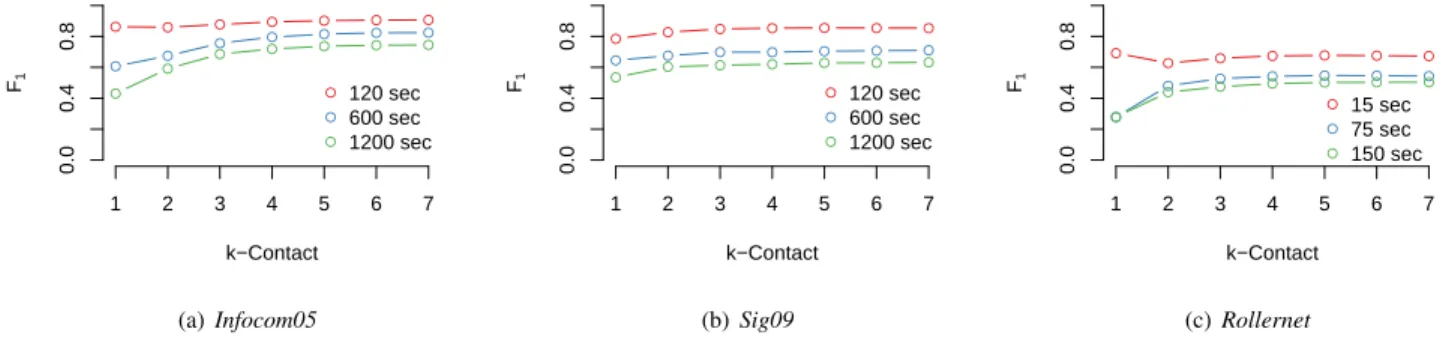
D. κ-contact prediction results
Based on the previous observations of the optimal number of past intervals we assess the performance of predicting κ-contact relationships. We vary the value of κ from 1 to 7 and consider three durations for the time-window:{120, 600, 1200} seconds for Infocom05 and Sig09 and {15, 75, 150}
● ● ● ● ● ● ● 1 2 3 4 5 6 7 0.0 0.4 0.8 k−Contact F1 ● ● ● ● ● ● ● ● ● ● ● ● ● ● ● ● ● 120 sec 600 sec 1200 sec (a) Infocom05 ● ● ● ● ● ● ● 1 2 3 4 5 6 7 0.0 0.4 0.8 k−Contact F1 ● ● ● ● ● ● ● ● ● ● ● ● ● ● ● ● ● 120 sec 600 sec 1200 sec (b) Sig09 ● ● ● ● ● ● ● 1 2 3 4 5 6 7 0.0 0.4 0.8 k−Contact F1 ● ● ● ● ● ● ● ● ● ● ● ● ● ● ● ● ● 15 sec 75 sec 150 sec (c) Rollernet
Fig. 6. The efficiency of predicting κ-contact relationships for different durations of the time-window. On the y-axis we represent the prediction performance and on the x-axis we vary the value of κ-contact from 1 to 7.
seconds for Rollernet. The results are illustrated in Fig. 6. First, we observe that predicting that two nodes will be in direct communication range shows particularly poor results in very dynamic mobile settings (e.g. Rollernet that describes a rollerblading activity) and for longer durations of the time-window. Thus, in situations that involve important changes in the network topology, predicting that nodes will be in direct contact is prone to large errors.
Relaxing the prediction objective beyond direct contact relationships reveals more accurate predictive power. Overall, the greater the value for κ the more effective the prediction performance. On average (for all mobility traces and different time-window durations) predicting that nodes will be at most at a distance 2, 3, and 4 shows an improvement of 7%, 10%, and 11% compared to the case where we want to predict direct meetings between mobile users. While the improvement is important for small values of κ we notice that there is little benefit in extending the prediction for a κ greater than 3. The most significant increase, compared to the direct contact case, can be observed for κ = 2 with an average increase of 10% for Rollernet, 7% for Infocom05, and 6% for Sig09. The benefit is negligible when trying to predict the network change in the immediate horizon but it becomes significant when trying to make predictions over longer periods of time. Taking the case of Infocom05 for a time-window of 1200 seconds and Rollernet for 150 seconds, predicting that nodes will be separated by at most two nodes (κ-contact = 3) reveals an improvement of 60% for Infocom05 and 74% for
Rollernet compared to the direct contact prediction case. While we leave a more detailed analysis of these findings for future work, we give two plausible explanations for these results. First, as we showed in Fig. 4, a non-negligible number of nodes, although never in direct contact, they come at a 2-hop distance. By extending the prediction objective to 2-hop contacts, we include these potential events into consideration, which appear to have a more predictable nature. Then, as showed in Section III direct contacts between mobile users are scarce and short-lived, which makes them more difficult to predict in very dynamic scenarios and for longer time hori-zons. This explains the low prediction effectiveness observed with Rollernet and for longer time-windows for Sig09 and
Infocom05. Thus, extending the notion of contact to κ-contact
gives us access to more stable connections (nodes leave direct connectivity but remains in κ-contact for longer durations) that reveal a more predictable nature.
V. PRACTICAL IMPLICATIONS
To capture the possible benefit that κ-contact prediction would bring in practical scenario we propose and evaluate the following use-case example.
We consider a content producer, located on the Internet, that regularly publishes content for a known group of collocated mobile users that communicate with the server using the cellular infrastructure. Content is categorized in topics. Users subscribe to these topics and content is pushed to users upon creation. We also consider that, in order to reduce the amount of cellular traffic caused by content delivery, the content producer collects data about the mobile contact traces and relies on a κ-contact prediction functionality when transmitting information to users. More specifically, at the publication of a content, instead of individually transmitting the content to each subscriber, the content producer optimizes the delivery process based on the predicted κ-contact opportunities. For example, if the server predicts that two users, interested in the same content, will be in κ-contact, a message is sent to only one of these nodes which will opportunistically forward the message to the other node when they will be κ-contact. We also assume that nodes are capable of sensing their κ-vicinity and can detect when a targeted user is in κ-contact. To collect nearby topological knowledge, we assume the existence of a link-state protocol gathering nearby knowledge under the form of a connectivity graph. The implementation itself is beyond the scope of our study, yet a previous analysis studied the impact of monitoring overhead [8].
We design the experimental setting using ONE simulation environment [19]. In our experiments we set the number of topics to 100. Each mobile node randomly subscribes to 20 up to 100 topics. For the prediction module, we use a time-window of 75 seconds for Rollernet, and 600 seconds for
Infocom05and Sig09. Content is uniformly created throughout the duration of the experiments (that covers the duration of a mobility trace) and the results are averaged over 10 simulation runs. We also consider an infinite cache size at the user side and assume that the content is small enough to fit into one message in the communication between content producer
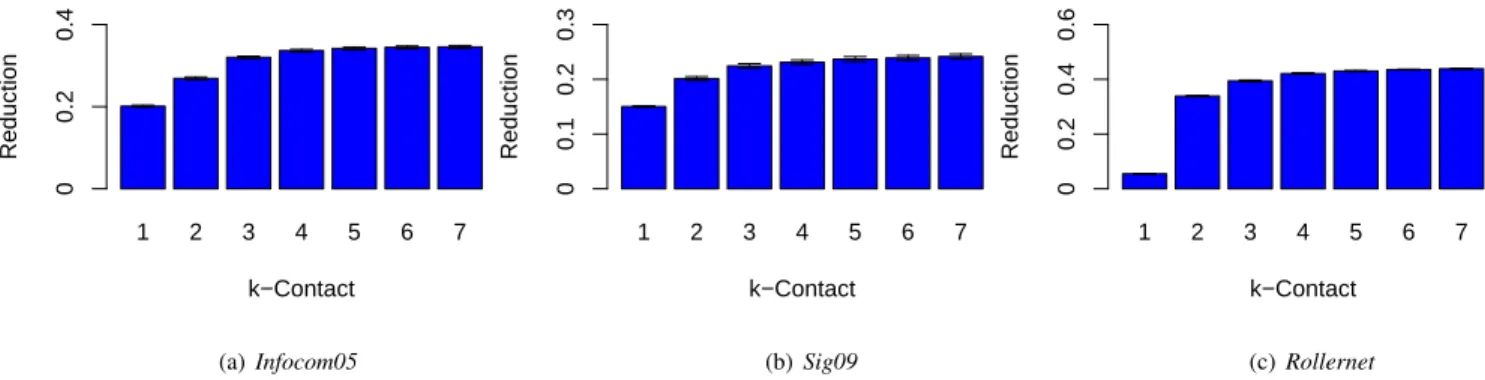
1 2 3 4 5 6 7 k−Contact Reduction 0 0.2 0.4 (a) Infocom05 1 2 3 4 5 6 7 k−Contact Reduction 0 0.1 0.2 0.3 (b) Sig09 1 2 3 4 5 6 7 k−Contact Reduction 0 0.2 0.4 0.6 (c) Rollernet
Fig. 7. The percent of traffic with the infrastructure that can be reduced through κ-contact prediction and mobile opportunistic communications. On the y-axis we represent the traffic reduction compared to the case where content is sent to mobile users using only the infrastructure. On the x-axis we present different values for κ-contact.
and the users and between the mobile users. To measure the impact of κ-contact prediction we report the reduction in the number of messages in the communication between the content producer and the mobile users when using κ-contact prediction module compared to a case where the content is individually sent to each user using the cellular infrastructure. The results are presented in Fig. 7. First, we observe that the greater the value of κ-contact, the greater the potential of traffic reduction. The biggest improvement of predicting beyond direct neighbors is noticed for κ = 2, that shows an improvement of 6% for Sig09, 7% in Infocom05, and 30% for Rollernet. The potential traffic reduction is directly af-fected by the characteristics of the traces: κ-vicinity properties (presented in Fig. 4) and prediction performance (presented in Fig. 6). Taking the example of Sig09, even if the effec-tiveness of the prediction showed little improvement for κ = 2 compared to κ = 1 the potential reduction is nevertheless important (6%). This is explained by the significant number of nodes located at a 2-hop distance detected with the κ-contact prediction. The benefit is even more substantial in the case of Rollernet. By counting on the pairs of nodes connected at a 2-hop distance (that exceed the number of direct contact opportunities), the traffic reduction attains a performance of 33% compared to 5% when using only direct contact prediction.
VI. RELATED WORK
The DTN community used different ways to benefit from a node’s neighborhood. Some relied on the social behavior of users. In urban areas, where people tend to form com-munities around points of interests, Ott et al. presented a protocol leveraging end-to-end and multi-hop DTN paths [20]. Sarafijanovic-Djukic et al. made a similar observation for VANET [21]. Heimlicher and Salamatian demonstrated that mobile wireless networks tend to have connected crowds [4]. The transient notion between all these studies is that there are immediate neighborhood structures to use but none of them actually defined a notion of vicinity for DTN. Similar principles have also been considered even in other contexts, such as wireless mesh networks [22].
In the latest years, analyzing human mobility to detect useful patterns and to derive accurate prediction models has
been well studied. Song et al. observed that, despite the many decisions influencing our daily routines, there is a 93% potential in predicting user mobility [23]. Clauset and Eagle revealed strong periodicities in contact periods between mobile users that may depend on the environment under study (the physical place and the type of user activity) [3]. Zayani et al. studied the problem of predicting contact opportunities between mobile users [7]. Using a tensor-based link prediction technique, they provide evidence about the predictive power of various features that capture both the topological distance and the physical proximity between users. In this work we focus on one specific aspect of human mobility, i.e. predicting if two nodes will be in each other κ-vicinity. Our analysis is close to the work of Zayani et al. but differs in the prediction goal (we extend the contact prediction to the κ-contact case), the mobility traces under study, and the prediction framework (we use a supervised learning framework compared to the unsupervised setting used in their paper).
From a general point of view, our prediction objective is related to the link prediction problem in complex networks. This topic is an important research direction in several do-mains that define relationships between different entities. This includes predicting the co-authorship of research publications, hyperlinks between web pages, or human communication pat-terns [13], [14], [24], [25]. Liben-Nowell and Kleinberg have studied the predictive power of various topological features and observed that the Katz measure performs consistently well. While analyzing the predictive power of non-topological attributes Al Hasan et al. observed that the frequency of interactions (e.g. co-authorship of scientific papers) is an efficient predictive variable [26]. We build on this knowledge, and we analyze the predictive powers of different features (topological measures and the frequency of users encounters) in predicting the κ-contact relationships between mobile users.
VII. CONCLUSION AND FUTURE WORK
In this work, we addressed the problem of predicting κ-contact opportunities between mobile users – predict if users will find themselves at a distance of at most κ-hops from one another. By analyzing three real-world contact traces, we observed that one can obtain better performances when predicting2+-contacts compared to the direct contact case. To
assess the impact of these findings in a real-world application, we proposed a simulation experiment in which, by combining mobile opportunistic communications with κ-contact predic-tion one can reduce the amount of traffic used in the commu-nication of mobile nodes with the infrastructure. Our results suggest that services benefiting from contact predictions can efficiently exploit the predictable nature of κ-contacts.
Research in the area of κ-contact prediction and its ap-plications is an open subject with many possible extensions. First, as the observations made in this paper are based on specific mobility settings (conferences and rollerblading) more work is needed in order to understand to what extend these observations can be generalized to other mobility scenarios. The quality of the prediction shows promising performances, yet not optimal, and suggests there is still room for im-provement. One way to increase the prediction performance is to consider additional features in the prediction model. This includes information about the geographical co-location patterns of nodes (not available in the traces used in this paper) that showed strong predictive power in the link prediction problem [7], [14]. Then, in this study, we only consider a one-step ahead prediction problem (we use information received in the previous m time periods to predict what will happen during m+ 1 period). To cover a larger range of situations the prediction objective can be extended to further time periods, i.e. predict contacts during subsequent time periods m+ 1, m+2, ..., m+n. This can be particularly favorable in situations where collecting and processing data adds a significant delay, for which immediate prediction can be considered outdated.
Finally, the current evaluation of the applicability of κ-contact prediction in real-world scenarios considers some simplifying assumptions and more work would be needed to assess the benefit of κ-contact prediction in practice. This includes an evaluation of the additional cost of collecting data about nodes’ mobility and the feasibility of implementing a mechanism capable of detecting the κ-contact communication opportunities.
ACKNOWLEDGMENT
Alexandru-Florin Tatar, Tiphaine Phe-Neau, Marcelo Dias de Amorim, and Serge Fdida carried out part of the work at LINCS (http://www.lincs.fr). This work was partially funded by the European Community’s Seventh Framework Pro-gramme under grant agreement no. FP7-317959 MOTO.
REFERENCES
[1] K. Fall, “A Delay-Tolerant Network Architecture for Challenged Inter-nets,” in ACM Sigcomm, Karlsruhe, Germany, Aug. 2003.
[2] A. Chaintreau, P. Hui, J. Crowcroft, C. Diot, R. Gass, and J. Scott, “Impact of human mobility on opportunistic forwarding algorithms,” IEEE Transactions on Mobile Computing, vol. 6, no. 6, pp. 606–620, 2007.
[3] A. Clauset and N. Eagle, “Persistence and periodicity in a dynamic proximity network,” arXiv preprint arXiv:1211.7343, 2012.
[4] S. Heimlicher and K. Salamatian, “Globs in the Primordial Soup – The Emergence of Connected Crowds in Mobile Wireless Networks,” in ACM Mobihoc, Chicago, Illinois, USA, Sep. 2010.
[5] V. Erramilli, A. Chaintreau, M. Crovella, and C. Diot, “Diversity of forwarding paths in pocket switched networks,” in Proceedings of the 7th ACM SIGCOMM conference on Internet measurement. ACM, 2007, pp. 161–174.
[6] V. Erramilli, M. Crovella, A. Chaintreau, and C. Diot, “Delegation forwarding,” in Proceedings of the 9th ACM international symposium on Mobile ad hoc networking and computing. ACM, 2008, pp. 251–260. [7] M.-H. Zayani, V. Gauthier, and D. Zeghlache, “Improving link prediction in intermittently connected wireless networks by considering link and proximity stabilities,” in WOWMOM, 2012, pp. 1–10.
[8] T. Phe-Neau, M. Dias de Amorim, and V. Conan, “The Strength of Vicinity Annexation in Opportunistic Networking,” in IEEE NetSciCom, Torino, Italy, Apr. 2013.
[9] ——, “Vicinity-based DTN Characterization,” in ACM MobiOpp, Zurich, Switzerland, Mar. 2012.
[10] A.-K. Pietil¨anen and C. Diot, “Dissemination in opportunistic social networks: the role of temporal communities,” in ACM Mobihoc, Hilton Head, South Carolina, USA, Jun. 2012.
[11] P.-U. Tournoux, J. Leguay, F. Benbadis, J. Whitbeck, V. Conan, and M. D. de Amorim, “Density-aware routing in highly dynamic DTNs: The rollernet case,” IEEE Transactions on Mobile Computing, vol. 10, pp. 1755–1768, 2011.
[12] Z. Huang, X. Li, and H. Chen, “Link prediction approach to collaborative filtering,” in Proceedings of the 5th ACM/IEEE-CS joint conference on Digital libraries. ACM, 2005, pp. 141–142.
[13] D. Liben-Nowell and J. Kleinberg, “The link-prediction problem for social networks,” J. Am. Soc. Inf. Sci. Technol., vol. 58, no. 7, pp. 1019– 1031, May 2007.
[14] D. Wang, D. Pedreschi, C. Song, F. Giannotti, and A.-L. Barabasi, “Human mobility, social ties, and link prediction,” in ACM SIGKDD, 2011, pp. 1100–1108.
[15] L. A. Adamic and E. Adar, “Friends and Neighbors on the Web,” Social Networks, vol. 25, no. 3, pp. 211–230, 2003.
[16] L. Katz, “A new status index derived from sociometric analysis,” Psychometrika, vol. 18, no. 1, pp. 39– 43, 1953.
[17] A.-L. Barabˆasi, H. Jeong, Z. N´eda, E. Ravasz, A. Schubert, and T. Vicsek, “Evolution of the social network of scientific collaborations,” Physica A: Statistical Mechanics and its Applications, vol. 311, no. 3, pp. 590–614, 2002.
[18] C.-C. Chang and C.-J. Lin, “LIBSVM: A library for support vector machines,” ACM Transactions on Intelligent Systems and Technology, vol. 2, pp. 27:1–27:27, 2011, software available at http://www.csie.ntu.edu.tw/ cjlin/libsvm.
[19] A. Ker¨anen, J. Ott, and T. K¨arkk¨ainen, “The ONE Simulator for DTN Protocol Evaluation,” in International Conference on Simulation Tools and Techniques, Rome, Italy, Mar. 2009.
[20] J. Ott, D. Kutscher, and C. Dwertmann, “Integrating DTN and MANET routing,” in ACM Chants, Pisa, Italy, Sep. 2006.
[21] N. Sarafijanovic-Djukic, M. Pidrkowski, and M. Grossglauser, “Island Hopping: Efficient Mobility-Assisted Forwarding in Partitioned Net-works,” in IEEE SECON, Reston, VA, USA, Sep. 2006.
[22] M. E. M. Campista, L. H. M. K. Costa, and O. C. M. B. Duarte, “A routing protocol suitable for backhaul access in wireless mesh networks,” Computer Networks, vol. 56, no. 2, pp. 703–718, Feb. 2012.
[23] C. Song, Z. Qu, N. Blumm, and A.-L. Barab´asi, “Limits of predictability in human mobility,” Science, vol. 327, no. 5968, pp. 1018–1021, 2010. [24] B. Taskar, M.-F. Wong, P. Abbeel, and D. Koller, “Link prediction in relational data,” in Neural Information Processing Systems, vol. 15, 2003.
[25] Z. Huang and D. K. Lin, “The time-series link prediction problem with applications in communication surveillance,” INFORMS Journal on Computing, vol. 21, no. 2, pp. 286–303, 2009.
[26] M. Al Hasan, V. Chaoji, S. Salem, and M. Zaki, “Link prediction using supervised learning,” in SDM06: Workshop on Link Analysis, Counter-terrorism and Security, 2006.