Preliminary results from the STAR-Liège clinical trial: Virtual trials,
safety, performance, and compliance analysis
Vincent Uyttendaele*, **, Jennifer L. Knopp**, Marc Pirotte***, Julien Guiot***, Philippe Morimont***, Bernard Lambermont***, Geoffrey M. Shaw****, Thomas Desaive*, and J. Geoffrey Chase**.
* GIGA – In silico Medicine, University of Liège, Belgium
(email: Vincent.Uyttendaele@uliege.be, Vincent.Uyttendaele@pg.canterbury.ac.nz) **Department of Mechanical Engineering, University of Canterbury, Christchurch, New Zealand
*** Department of Medical Intensive Care, University Hospital of Liège, Belgium **** Department of Intensive Care, Christchurch Hospital, New Zealand
Abstract: Glycaemic control has been shown to improve outcome in critically ill patients, but hard to
achieve in a safe and effective manner. This paper presents the preliminary results of 8 patients controlled at the University Hospital of Liège under STAR-Liège, an insulin-only version of the model-based STAR glycaemic controller framework. Clinical data is compared with virtual trial simulations of the glycaemic control outcomes for the STAR-Liège protocol, and with the standard of care protocol of this intensive care unit, to assess safety, performance, and compliance of the new protocol.
Results show 78% of clinical blood glucose measurements in target band. Only 3% of blood glucose measurements were below 4.4 mmol/L (79 mg/dL), with only 1% mild hypoglycaemia and no severe hypoglycaemia. These results are similar to simulation of the protocol, but slightly higher workload is observed clinically due to nursing choice. Compared to standard protocol virtual trial simulations, STAR-Liège achieved tighter and less variable control with similar safety, and less percentage time in higher blood glucose levels. Clinically, 14% of insulin intervention were increased or decreased from recommendation with median [IQR] change of 1 [1, 2] or -2 [-3, -2] U/hr respectively.
Clinical and simulation results show STAR-Liège better controls glycaemia to lower ranges compared to the standard protocol, while ensuring safety. Lower time in higher blood glucose ranges potentially improves patient outcomes. Compliance analysis shows potential nurse fears in protocol changes and different insulin dosing. These results are encouraging for the continuation of the clinical trial realised in this medical intensive care unit and its extension to insulin and nutrition control.
Keywords: Glycaemic control, Hyperglycaemia, Insulin, Clinical trial, Virtual Trial
1. INTRODUCTION
Stress-induced hyperglycaemia is a common complication in critically ill patients (McCowen et al., 2001). Abnormal and highly variable blood sugar (BG) levels are associated with increased mortality and morbidity (Bagshaw et al., 2009; Capes et al., 2000; Egi et al., 2006; Egi et al., 2010; Krinsley, 2008). Many studies have shown beneficial outcomes using insulin therapy for these patients, reducing mortality, morbidity, length of stay, and workload (Chase et al., 2010a; Krinsley, 2004, 2005; Reed et al., 2007; Van den Berghe et
al., 2001; Van den Berghe et al., 2003). However, others
have shown glycaemic control (GC) hard to reproduce safely, with significantly increased risk of hypoglycaemia for no reductions in mortality (Brunkhorst et al., 2008; Finfer et al., 2009; Finfer et al., 2012; Preiser et al., 2009).
The debate over whether tight glycaemic control is beneficial or harmful for intensive care unit (ICU) patients (Marik, 2016; Preiser et al., 2016) is thus legitimate. A recent study showed no difference in insulin sensitivity and variability
between survivors and non-survivors, implying that the association between glycaemic outcomes and mortality is a function of GC achieved and not patient condition (Uyttendaele et al., 2017). Thus, good GC protocol design can be essential for patient outcome. Hence, insulin therapy needs to be safe and effective for all patients, offering a ‘one
method fits all’ solution, and be repeatable across ICUs
(Stewart et al., 2016) before any potential beneficial impact can be assessed (Chase et al., 2017).
STAR is a GC framework using physiological and stochastic models to dose insulin and nutrition (Evans et al., 2012; Fisk
et al., 2012). STAR uses a risk-based dosing approach,
accounting for intra- and inter- patient variability (Lin et al., 2008). Model-based insulin sensitivity (SI) is determined using clinical data, and its likely future variability is assessed using a stochastic model built on population data (Lin et al., 2006; Lin, et al., 2008; Lin et al., 2011). This risk-based forward prediction of SI allows STAR to adjust treatment so the resulting predicted BG outcome best (and safely) overlaps a clinically chosen target band. STAR has shown safe,
effective control in Christchurch, New Zealand, and Gyula, Hungary, where it is the standard of care (Stewart, et al., 2016). STAR is a user-friendly software, and easily adaptable to different ICU practices.
This paper presents intermediate clinical trial results of a modified, insulin-only version of STAR (STAR-Liège) at the University Hospital of Liège (CHU), Belgium. This clinical trial assesses the performance of STAR and the impact of this new model-based solution on nurse workload. This trial is realised over two major phases of 20 patients each. During the first phase, only insulin intervention will be suggested, while nutrition is left to clinician discretion. The second phase will control both nutrition and insulin inputs.
2. METHODS
2.1 STAR-Liège protocol
STAR-Liège is an insulin-only version of STAR (Evans, et
al., 2012; Fisk, et al., 2012) with starting criteria of 2
successive BG > 8.0 mmol/L (145 mg/dL). Insulin is administered continuously through arterial IV catheter. Increments of maximum 2 U/hr of insulin are allowed, and the maximum rate is 9 U/hr. STAR-Liège targets 4.4-8.0 mmol/L (79 – 145 mg/dL). STAR-Liège stopping criteria are defined as stable BG over the last 6 hours period during which low insulin was given (≤ 2U/hr), either for clinical reasons, or after 72 hours on the protocol. The University Hospital of Liège Ethics Committee approved this trial and the use of this data.
Using clinical data, model-based SI is determined from a clinically validated physiological model (Lin, et al., 2011). SI characterises the patient-specific metabolic response to insulin. Based on this current SI value, the stochastic model, built on population data, is used to determine the distribution of future SI, thus accounting for future metabolic variability. The 5th and 95th percentile of likely future SI are used to
determine the corresponding 95th and 5th percentiles of future
BG outcomes, for a given intervention. STAR-Liège thus determines the best insulin intervention that best overlaps the clinically chosen target band, ensuring a maximum of 5% risks for BG < 4.4 mmol/L (79 mg/dL). STAR-Liège offers 1 to 3 hourly treatment options based on patient stability and treatment risk profiles.
2.2 Standard protocol
The GC standard of care in this ICU is a table-based sliding scale protocol, using the current BG and previous insulin rate to adjust insulin intervention. This protocol targets the 5.6-8.3 mmol/L (100-150 mg/dL) band, with a maximum insulin rate of 50 U/hr. Starting criteria is BG > 10.0 mmol/L (180 mg/dL). Measurements are taken 4-hourly if BG is stabilised with two consecutive BG measurements between 5.6 and 10.0 mmol/L (100 and 180 mg/dL). If BG is not stable and/or if insulin rate was changed, BG is measured hourly. Full details are presented in (Penning et al., 2014).
2.3 Protocol comparisons
This study analyses and compares the GC outcomes from the first 8 patients included in the STAR-Liège trial, and simulated GC outcomes from virtual simulations of the STAR-Liège protocol and the standard of care protocol currently used. These virtual trials are simulated based on virtual patients characterised by their model-based SI profiles, which were created from clinical data. Real data and simulation data can be compared to assess compliance to the original protocol. Nutrition profiles in simulations are based on clinical data. The generalisability across different cohorts and ICUs of such virtual trials has been validated in (Chase et
al., 2010b; Dickson et al., 2017). Additionally, retrospective
clinical glycaemic control data from 20 patients was collected for the Liège sliding scale protocol for comparison and assessment of clinical compliance. These latter patients were presented elsewhere (Dickson, et al., 2017). Clinical outcome is not analysed in this study.
2.4 Analyses
This analysis focuses on the safety and performance of different GC protocols. Performance is assessed using the percentage of hourly resampled BG measurements in the 4.4-8.0 mmol/L (79-145 mg/dL) target band and the per-patient median [IQR] BG. Safety is evaluated by the percentage BG with mild hypoglycaemia (BG < 4.0 mmol/L or 79 mg/dL), or severe hypoglycaemia (BG < 2.2 mmol/L or 40 mg/dL). BG data is resampled hourly to allow fair comparison across different measurement intervals.
Clinical compliance is assessed for each protocol. Compliance is assessed as the number of unchanged insulin interventions from the original recommendation. Delays in insulin delivery of up to 15 minutes are not considered non-compliant as long as the rate matches the recommendation. For the STAR-Liège protocol, the nurse selected treatment is compared with the treatment option with the maximum measurement interval available.
In summary, this study compares the safety, performance, and compliance across:
Clinical GC data from 8 patients treated with the STAR-Liège protocol
Virtual trial simulations of the STAR-Liège protocol Virtual trial simulations of the standard protocol Retrospective clinical GC data from 20 patients
treated with the standard protocol. 3. RESULTS
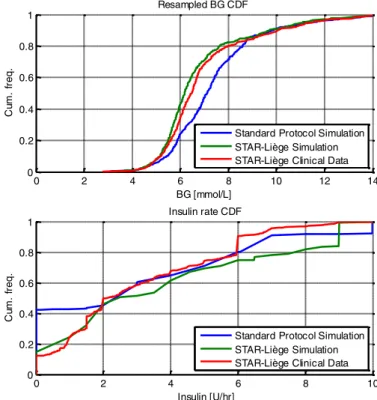
Clinical and simulation results are summarised in Table 1 for each protocol. Resampled BG and insulin rate cumulative distribution functions (CDFs) are shown in Figure 1. The evolution of BG traces over time for the 8 patients are also shown in Figure 2.
3.1 STAR-Liège clinical trial results vs. virtual trials
Clinical data shows very good performance with 78% of BG measurements within 4.4-8.0 mmol/L target band and a median [IQR] BG of 6.5 [5.8, 7.5]. Only 3% of BG were below the target band, with 1% BG < 4.0 mmol/L and no severe hypoglycaemia (0% BG < 2.2 mmol/L).
Table 1 – Clinical and simulation results summary for performance, safety and compliance protocol comparison. BG stats are calculated from hourly resampled BG as measurement interval can differ from treatment to treatment.
STAR-Liège Standard Protocol
Clinical Sim. Sim. Clinical Retro.
# Patients 8 20 Total hours 404 404 413 5006 Average measurements per day 16 14 11 7 Median [IQR] BG (mmol/L) 6.5 [5.8, 7.5] 6.2 [5.6, 7.2] 7.1 [6.1, 8.2] 7.7 [6.5, 8.9] Median [IQR] insulin rate (U/hr) 2.0 [1.0, 5.5] 2.5 [1.5, 6.5] 3.0 [0.0, 6.0] 2.5 [2.0, 3.0] Median [IQR] dextrose rate (g/hr) 7.8 [5.6, 9.0] 7.8 [5.6, 9.0] 7.8 [5.6, 9.0] 9.8 [8.6, 11.5] % BG in 4.4-8.0 mmol/L 78 80 69 55 % BG in 5.6-8.3 mmol/L 60.8 58 64 54 % BG in 8.0-10.0 mmol/L 9 8 20 31 % BG > 10.0 mmol/L 11 9 9 12 % BG < 4.4 mmol/L 2 2 2 1 % BG < 4.0 mmol/L 1 1 1 1 % BG < 2.2 mmol/L 0 0 0 0 Unchanged intervention (%) 86 100 100 N/A Max. option chosen (%) 86 100 100 N/A 0 2 4 6 8 10 12 14 0 0.2 0.4 0.6 0.8 1 BG [mmol/L] C um . fr e q . Resampled BG CDF 0 2 4 6 8 10 0 0.2 0.4 0.6 0.8 1 Insulin [U/hr] C um . fr e q . Insulin rate CDF
Standard Protocol Simulation STAR-Liège Simulation STAR-Liège Clinical Data Standard Protocol Simulation STAR-Liège Simulation STAR-Liège Clinical Data
Figure 1 – Cohort resampled BG and insulin rate CDFs comparison between simulations and real clinical data.
0 10 20 30 40 50 60 70 0 5 10 15 20
25 Real data BG traces over time
Time (hours) B G ( m m o l/L )
Figure 2 – Real BG evolution traces over time for the first 8 patients treated under STAR-Liège protocol. Dashed lines show the target 4.4-8.0 mmol/L range.
Compared to simulation, both safety and performance were similar. Slightly higher % BG in higher bands is observed (shift to the right of the CDF, 20% vs. 17% BG > 8.0 mmol/L), explained by the overall lower median [IQR] insulin administered clinically (shift to the left of the CDF, 2.0 [1.0, 5.5] vs. 2.5 [1.5, 6.5] U/hr median [IQR] insulin). The average number of measurements per day is higher clinically than simulated (16 vs. 14), and this increased workload is explained by 14% of actual treatment option selecting lower than the maximum measurement interval offered. Finally, 14% of insulin interventions were
non-compliant to protocol as insulin dose was changed from the original recommendation. Where treatments were non-compliant to recommendations, 17 (47%) involved a median [IQR] reduction in insulin rate of -2 [-3, -2] U/hr, and 19 (53%) involved a median [IQR] increase in insulin rate of 1 [1, 2] U/hr. From data observation, insulin rate reduction often occurred when BG was close to target band limits at relatively high insulin rates (either when BG was decreasing and approaching the upper target band limit, or when BG was close to the lower target band limit). In contrast, modifications increasing insulin rate often occurred when
STAR suggested important lowering in insulin
administration, whereas nurses tended to dislike decreasing insulin rate too quickly. In general, this behaviour reflects a more dynamic dosing by STAR than nurses were used to, affecting compliance (Chase et al., 2008). It is important to note that giving higher insulin rates than recommended results in increased risk of hypoglycaemia (>5%) predicted by the controller (Evans, et al., 2012). Nutrition rates are equal as expected since simulations are based on clinical nutrition data.
3.2 STAR-Liège protocol vs. standard protocol simulations
Simulation results show the STAR-Liège protocol achieved tighter and less variable control (6.2 [5.6, 7.2] vs. 7.1 [6.1, 8.2] mmol/L median [IQR] BG) than the sliding scale protocol without compromising safety. In Figure 1, the STAR-Liège BG CDF (green) is located to the left of the Standard protocol BG CDF (blue), and is more vertical and thus less variable. The % BG higher than 8.0 mmol/L is much lower for STAR-Liège (17% vs. 29%). However, STAR-Liège workload is greater (14 vs. 11 measurements per day), despite broadly similar insulin dosing (Figure 1). Note that the number of simulated hours difference between the protocols is due to when the last measurements within available data occurred, leading to last 1-2 hours being trimmed.
3.3 Standard protocol retrospective data
Although the reported metrics are not based on the same underlying cohort, this comparison is interesting for compliance assessment and overall protocol behaviour analysis. As shown in Table 1, median [IQR] BG is higher for the retrospective data (7.7 [6.5, 8.9] vs. 7.1 [6.1, 8.2] mmol/L) then simulations of the standard protocol, and the % BG > 8.0 mmol/L is higher, with lower insulin given (2.5 [2.0, 3.0] vs. 3.0 [0.0, 6.0] U/hr). The very high percentage (40%) of hours without insulin in the simulation of the standard protocol (Figure 1) is explained by the different starting inclusion criteria (BG > 8.0 for STAR and BG > 10.0 for standard protocol). In terms of performance, the simulation achieved 64% BG in the target band (5.6-8.3 mmol/L) whereas 54% was achieved clinically. The average measurements/day is much lower at 7 measures/day. Simulations on this specific cohort of 20 patients have been previously published elsewhere (Dickson, et al., 2017), showing an important lack of compliance to the protocol in terms expected average measurement per day (7 vs. 11) and
important modifications in insulin intervention, having direct impact on both protocol performance and safety. Interestingly, much higher nutrition rates are observed in this retrospective cohort compared to what have been given to STAR-Liège patients (9.8 [8.6, 11.5] vs. 7.8 [5.6, 9.0]), also impacting the higher % BG > 8.0 mmol/L.
4. DISCUSSION
These preliminary results from the STAR-Liège clinical trial are encouraging. Performance of STAR-Liège is similar to previous published performance of the original STAR protocol (Stewart, et al., 2016), despite modulating only insulin. As reported in Table 1, 14% of recommended insulin treatments were changed, typically reflecting a potential fear of too aggressive treatment or more dynamic changes in dosing than typically used, as nurses need time to learn and completely adapt to this new model-based solution. This issue can be explained by the lower target band used in STAR-Liège compared to the Standard protocol (4.4-8.0 mmol/L vs. 5.6-8.3 mmol/L). Moreover, what characterises STAR is its power to determine SI based on clinical data and dynamically adjust treatment according to predicted SI variability, whereas nurses rely on clinical judgement. Hence, these insulin adjustments rates were commonly lower than recommended because of a fear of hypoglycaemia, especially in normoglycaemic ranges, resulting in higher %BG > 8.0 mmol/L for little to no avoidance of hypoglycaemia (Table 1). Additionally, the longest available treatment option suggested by STAR-Liège was not chosen 14% of the time, either by nurse choice or for clinical reasons, inducing additional workload, but potentially leading to slightly safer control.
Per-patient time in band is consistently high, with the exception of one 1 patient (red trace in Figure 2). This patient was very resistant to insulin (median SI of 1.8e-4 L/mU/min), and rapidly fed with a consistent 8.4 g/h of total carbohydrates rate. STAR-Liège was thus recommending the maximum insulin rate possible, but could not effectively lower BG. In the second phase of the clinical trial, STAR-Liège will also be allowed to modulate nutrition, and this is typically a case where nutrition would be decreased to lower BG to safer ranges.
One BG < 4.0 mmol/L was measured and can also be seen Figure 2 (blue trace). This mild hypoglycaemic episode happened while no recorded insulin was administered to the patient during the previous two hours of treatment. It is hard to explain what might have happened, as this patient was receiving consistent 4.2 g/h of enteral carbohydrates. One explanation could be some undesired administered remaining insulin in the catheter, or wrong rate adjustment on the insulin pump.
In this analysis, virtual trials of STAR-Liège and the Standard protocols using virtual patients created with the clinical data of the first 8 real patients are also used. Results show tighter control with lower and less variable BG outcomes for the STAR-Liège protocol, while ensuring
similar very good safety. These results were achieved with modestly higher workload for the STAR-Liège protocol, showing this trade-off in GC. Retrospective data from 20 patients controlled using the standard protocol supports the simulations trend of higher (expected) BG outcomes, but lack of compliance to this protocol was shown in clinical practice, questioning its potential improved outcomes.
No matter the optimal target band chosen for GC, safety and performance must both be achieved for all patients, and repeatable across different ICU practices. STAR, and its unique risk-based dosing approach accounting for inter- and intra- patient variability, allow tighter control to a lower target band while ensuring both performance and safety. If some patients are “easy” to control, the “hard” patients to control are probably the ones that matter most. STAR-Liège, in line with previous results of the STAR GC framework, shows good control for essentially all patients, with very low episodes of hypoglycaemia. Most importantly, these results suggest the STAR framework generalises well to different population of critically ill patients, having potentially different underlying metabolic and ethnic conditions, and different ICUs across the world, as well as showing equal safety and performance using insulin-only control.
5. CONCLUSIONS
These preliminary results of the STAR-Liège clinical trial currently running at the University Hospital of Liège, Belgium, show positive GC outcomes from this GC protocol. The % BG time in target band is 78% with only 2% of mild hypoglycaemia and no severe hypoglycaemia. Compliance to the protocol is quite high, with only 14% of insulin intervention changed from the original recommendation. In-silico trials show slightly higher performance and similar safety for the STAR-Liège protocol, reflecting what would likely have happened if nurse had exactly followed the protocol requirements. Compared to simulation results of the Standard protocol used in this ICU, STAR-Liège has lower and less variable BG outcomes while performing similar safety with increased workload.
These results suggest these preliminary results of the STAR-Liège trial are encouraging and support the continuation of this clinical trial.
ACKNOWLEDGEMENTS
The authors acknowledge the support of the EUFP7 and RSNZ Marie Curie IRSES program, the Health Research Council (HRC) of New Zealand, the MedTech CoRE and TEC, NZ National Science Challenge 7, Science for Technology and Innovation, the European Erasmus + Student Mobility program, and the FRIA – Fund for Research Training in Industry and Agriculture.
REFERENCES
Bagshaw, S. M., Bellomo, R., Jacka, M. J., Egi, M., Hart, G. K., and George, C. (2009). The impact of early hypoglycemia and blood glucose variability on outcome in critical illness. Crit Care, 13.
Brunkhorst, F. M., Engel, C., Bloos, F., Meier-Hellmann, A., Ragaller, M., and Weiler, N. (2008). Intensive insulin therapy and pentastarch resuscitation in severe sepsis.
N Engl J Med, 358.
Capes, S. E., Hunt, D., Malmberg, K., and Gerstein, H. C. (2000). Stress hyperglycaemia and increased risk of death after myocardial infarction in patients with and without diabetes: a systematic overview. Lancet, 355, 773-778.
Chase, J. G., Andreassen, S., Jensen, K., and Shaw, G. M. (2008). Impact of human factors on clinical protocol performance: a proposed assessment framework and case examples. J Diabetes Sci Technol, 2, 409-416. Chase, J. G., and Dickson, J. (2017). Traversing the valley of
glycemic control despair. Critical Care.
Chase, J. G., Pretty, C. G., Pfeifer, L., Shaw, G. M., Preiser, J. C., and Compte, A. J. (2010a). Organ failure and tight glycemic control in the SPRINT study. Crit
Care, 14.
Chase, J. G., Suhaimi, F., Penning, S., Preiser, J. C., Compte, A. J., and Lin, J. (2010b). Validation of a model-based virtual trials method for tight glycemic control in intensive care. Biomed Eng Online, 9.
Dickson, J. L., Stewart, K. W., Pretty, C. G., Flechet, M., Desaive, T., Penning, S., Lambermont, B. C., Benyo, B., Shaw, G. M., and Chase, G. (2017). Generalisability of a Virtual Trials Method for Glycaemic Control in Intensive Care. IEEE
Transactions on Biomedical Engineering, PP, 1-1.
Egi, M., Bellomo, R., Stachowski, E., French, C. J., and Hart, G. (2006). Variability of blood glucose concentration and short-term mortality in critically ill patients.
Anesthesiology, 105, 244-252.
Egi, M., Bellomo, R., Stachowski, E., French, C. J., Hart, G. K., and Taori, G. (2010). Hypoglycemia and outcome in critically ill patients. Mayo Clin Proc, 85.
Evans, A., Le Compte, A., Tan, C. S., Ward, L., Steel, J., Pretty, C. G., Penning, S., Suhaimi, F., Shaw, G. M., Desaive, T., and Chase, J. G. (2012). Stochastic targeted (STAR) glycemic control: design, safety, and performance. J Diabetes Sci Technol, 6, 102-115. Finfer, S., Chittock, D. R., Su, S. Y., Blair, D., Foster, D.,
and Dhingra, V. (2009). Intensive versus conventional glucose control in critically ill patients. N Engl J Med,
360.
Finfer, S., Liu, B., Chittock, D. R., Norton, R., Myburgh, J. A., McArthur, C., Mitchell, I., Foster, D., Dhingra, V., Henderson, W. R., Ronco, J. J., Bellomo, R., Cook, D., McDonald, E., Dodek, P., Hebert, P. C., Heyland, D. K., and Robinson, B. G. (2012). Hypoglycemia and risk of death in critically ill patients. N Engl J Med,
367, 1108-1118.
Fisk, L. M., Le Compte, A. J., Shaw, G. M., Penning, S., Desaive, T., and Chase, J. G. (2012). STAR
development and protocol comparison. IEEE Trans
Biomed Eng, 59, 3357-3364.
Krinsley, J. S. (2004). Effect of an intensive glucose management protocol on the mortality of critically ill adult patients. Mayo Clin Proc, 79.
Krinsley, J. S. (2005). Glucose control reduces ICU stay and mortality. Perform Improv Advis, 9, 4-6, 1.
Krinsley, J. S. (2008). Glycemic variability: a strong independent predictor of mortality in critically ill patients. Crit Care Med, 36.
Lin, J., Lee, D., Chase, J. G., Shaw, G. M., Hann, C. E., Lotz, T., and Wong, J. (2006). Stochastic modelling of insulin sensitivity variability in critical care.
Biomedical Signal Processing and Control, 1,
229-242.
Lin, J., Lee, D., Chase, J. G., Shaw, G. M., Le Compte, A., Lotz, T., Wong, J., Lonergan, T., and Hann, C. E. (2008). Stochastic modelling of insulin sensitivity and adaptive glycemic control for critical care. Comput
Methods Programs Biomed, 89, 141-152.
Lin, J., Razak, N. N., Pretty, C. G., Compte, A., Docherty, P., and Parente, J. D. (2011). A physiological Intensive Control Insulin-Nutrition-Glucose (ICING) model validated in critically ill patients. Comput Methods
Programs Biomed, 102.
Marik, P. E. (2016). Tight glycemic control in acutely ill patients: low evidence of benefit, high evidence of harm! Intensive Care Med, 42, 1475-1477.
McCowen, K. C., Malhotra, A., and Bistrian, B. R. (2001). Stress-induced hyperglycemia. Crit Care Clin, 17, 107-124.
Penning, S., Lambermont, B., Desaive, T., Pretty, C., and Chase, J. G. (2014). In silico assessment of a
computarized model-based glycaemic control
approach in a Belgian medical intensive care unit.
IFAC Proceedings Volume, 47, 9913-9918.
Preiser, J. C., Devos, P., Ruiz-Santana, S., Melot, C., Annane, D., and Groeneveld, J. (2009). A prospective randomised multi-centre controlled trial on tight glucose control by intensive insulin therapy in adult intensive care units: the Glucontrol study. Intensive
Care Med, 35.
Preiser, J. C., and Straaten, H. M. (2016). Glycemic control: please agree to disagree. Intensive Care Med, 42, 1482-1484.
Reed, C. C., Stewart, R. M., Sherman, M., Myers, J. G., Corneille, M. G., and Larson, N. (2007). Intensive insulin protocol improves glucose control and is associated with a reduction in intensive care unit mortality. J Am Coll Surg, 204.
Stewart, K. W., Pretty, C. G., Tomlinson, H., Thomas, F. L., Homlok, J., and Noemi, S. N. (2016). Safety, efficacy and clinical generalization of the STAR protocol: a retrospective analysis. Ann Intensive Care, 6.
Uyttendaele, V., Dickson, J. L., Shaw, G. M., Desaive, T., and Chase, J. G. (2017). Untangling glycaemia and mortality in critical care. Crit Care, 21, 152.
Van den Berghe, G., Wouters, P., Weekers, F., Verwaest, C., Bruyninckx, F., Schetz, M., Vlasselaers, D., Ferdinande, P., Lauwers, P., and Bouillon, R. (2001).
Intensive insulin therapy in critically ill patients. N
Engl J Med, 345, 1359-1367.
Van den Berghe, G., Wouters, P. J., Bouillon, R., Weekers, F., Verwaest, C., Schetz, M., Vlasselaers, D., Ferdinande, P., and Lauwers, P. (2003). Outcome benefit of intensive insulin therapy in the critically ill: Insulin dose versus glycemic control. Crit Care Med,