Development of a Quick Quantitative Real-Time PCR for the In Vivo Detection
and Quantification of Peach latent mosaic viroid
Olivier Parisi, Philippe Lepoivre, and M. Haissam Jijakli, Université de Liège, Gembloux Agro-Bio Tech, Plant Pathology Unit, Passage des Déportés 2, 5030 Gembloux, Belgium
Abstract
Parisi, O., Lepoivre, P., and Jijakli, M. H. 2011. Development of a quick quantitative real-time PCR for the in vivo detection and quantification of Peach latent mosaic viroid. Plant Dis. 95:137-142.
Viroids are plant pathogens infecting a broad range of herbaceous and tree crops. Among them, the Peach latent mosaic viroid (PLMVd) infects mainly peach trees, causing a loss of production with no curative options. Detecting this viroid is thus important for certification procedures aiming to avoid the release of infected material into orchards. Presented here is a complete detection method based on reverse transcription (RT) followed by a quantitative real-time
polymerase chain reaction (PCR). New primers were selected and optimal reaction conditions determined for routine application of the method. The technique is 105 times more sensitive than the endpoint RT-PCR used for PLMVd detection, and permits earlier detection of PLMVd in infected plants. The quick, low-cost extraction procedure used and the quality of the results obtained make this method suitable for routine testing.
Viroids were discovered in the 1970s (7) and classified in two families based on biological, biochemical, and structural char-acteristics (13,14). These families are the Pospiviroidae, whose type species is the Potato spindle tuber viroid, and the Avsunviroidae, whose type species is the Avocado sunblotch viroid (ASBVd). Viroids infect various herbaceous and tree species. Most infected plants develop symptoms and can be seriously damaged by viroid infection. There exist no curative options. Therefore, viroids are the targets of active detection and eradication procedures.
The Peach latent mosaic viroid (PLMVd) belongs to the Avsunviroidae family. Like the other members of this family, it folds into a highly branched secondary structure (insoluble in 2 M LiCl) and contains a ribozyme catalyzing the cleavage of oligomers to monomers during replication (6,8). It infects mainly peach trees and other Prunus hybrids (like almond and apricot). Often latent in orchards for several years, PLMVd is transmitted by the cutting and grafting tools commonly used in production areas (13). Currently, PLMVd is included in certification programs to avoid its uncontrolled expansion, as described in the EPPO standard PM 4/30(1) (10). Rapid, efficient detection techniques are needed to avoid certification of false-negative material. Currently, endpoint RT-PCR (hereafter called RT-PCR) and molecular hybridization are the most used techniques (16), but unfortunately, the routine use of such detection methods is sometimes insufficient to avoid false negatives (16). Recently, however, a new reverse transcription loop-mediated isothermal amplification (RT-LAMP) with higher sensitivity than RT-PCR was developed (3).
Viroid infections are presumed to be systemic, but it has been shown that PSTVd is transported into the sepals and not into the other floral organs, which are purely sink organs (23). This lack of uniformity complicates sampling and the interpretation of negative results in detection campaigns. In addition to being nonuniform, viroid distribution seems to depend on the viroid species concerned. ASBVd is found at higher concentration in symptomatic than in nonsymptomatic leaves (18), but to our knowledge, no similar data are available for PLMVd. Finally, the
viroid titer also shows peaks and troughs in the course of the growth season (17), so that depending on the sampling date, infected plants may be detected as healthy. A more sensitive detection method could thus be helpful.
Real-time quantitative PCR (hereafter called qPCR) combines the simplicity of PCR amplification with the sensitivity of fluorescence detection during amplification (21). It is widely used for pathogen detection because it allows more sensitive, precise quantification than (RT-)PCR (22). It also gives results more quickly because it does not require post-PCR processing. With some adjustments, it should be applicable to viroid detection. This prospect and the advantages just mentioned have led us to develop an RT-qPCR method for detecting and quantifying PLMVd, based on the use of SYBR green dye.
Materials and Methods
Preparation of dimeric PLMVd RNA. Monomeric cDNA of a severe PLMVd variant (GenBank accession no. DQ680690) belonging to PLMVd sequence group II-A (11) was used as template for dimerization and subsequent inoculations. The monomeric PLMVd cDNA was amplified with the Pfu DNA polymerase (Fermentas, Vilnius, Lithuania). The PCR conditions were: 5 min at 95°C, 35 cycles of 95°C for 30 s, 60°C for 60 s, 72°C for 60 s, and a final elongation step at 72°C for 7 min), and the primers (each used at 0.4 µM final concentration) were hPLMVd (5′-CCCGATAGAAAGGCTAAGCACCTCG-3′) and cPLMVd (5′-AACTGCAGTGCTCCGAATAGGGCAC-3′) (12). The amplification products were purified by 1.2% agarose gel electrophoresis, and the PLMVd DNA of the expected length was eluted, phosphorylated with T4 polynucleotide kinase (Fermentas), and ligated with T4 DNA ligase (Fermentas). The ligation products were amplified with the High Fidelity PCR enzyme mix from Fermentas. Amplification was carried out with the hPLMVd and cPLMVd primers (PCR cycle: 5 min at 95°C, 35 cycles of 95°C for 30 s, 60°C for 60 s, 72°C for 60 s, and a final elongation step at 72°C for 7 min, the final concentration of each primer being 0.4 µM). Dimers were isolated by electrophoresis through a 1.2% agarose gel. The eluted dimers were cloned into the pCR2.1 cloning vector (Invitrogen, Carlsbad, CA) and used to transform chemically competent Escherichia coli cells (Invitrogen) according to the manufacturer’s instructions. After an overnight incubation in liquid medium with ampicillin, the transformed cells were collected by centrifugation and the recombinant plasmids purified with the GeneJet plasmid miniprep kit (Fermentas). To distinguish
Corresponding author: M. Haissam Jijakli, E-mail: MH.Jijakli@ulg.ac.be Accepted for publication 16 September 2010.
doi:10.1094 / PDIS-07-10-0512
the plasmids containing head-to-tail dimers, the dimers were digested with the KpnI restriction enzyme (Fermentas), and positive clones were sequenced by Macrogen (Seoul, Korea) to confirm the overall orientation of the dimers in the cloning vector. After transcription by T7 RNA polymerase (Fermentas), a dimeric PLMVd RNA molecule with plus polarity was obtained.
Plant material. Ten GF-305 peach trees were grown from viroid-free seedlings and maintained in a greenhouse. Nine plants were inoculated by slashing the stems with a suspension (in 50 mM K2HPO4) of the dimeric RNA corresponding to a severe PLMVd
variant. One plant remained noninoculated as a negative control. Sample preparation. Total RNA extraction. Each sample was prepared by grinding eight leaves (approximately 1 g leaf tissue, precisely weighed) in liquid nitrogen. Of the resulting powder, 400 mg was used for each sample. Total RNA was extracted from this material with 1 ml Qiazol Buffer (Qiagen, Hilden, Germany) and resuspended in 50 µl of 0.1% DEPC water according to the manufacturer’s instructions. The quality of the total RNA extract was checked by agarose gel electrophoresis and visualization of the ribosomal RNA.
Crude sap extraction. Two protocols of crude sap extraction were compared: one with 2× SSC buffer (20× SSC: 175.3 g/liter NaCl and 88.2 g/liter citrate trisodium dihydrate, pH 7) and the other with KAJI Buffer (DNAlis, Gembloux, Belgium). Eight leaves (approximately 1 g of leaf tissue, precisely weighed) were harvested. Five milliliters of KAJI Buffer or 2× RNAse-free SSC with 1% sodium sulfite as antioxidant were added before grinding. The crude sap was collected and centrifuged for 30 min at 12,000 × g (at 4°C to avoid RNA degradation). The supernatant was diluted 100-fold before the one-tube RT-PCR or the separate reverse transcription step of the RT-qPCR.
Reverse transcription step of the RT-qPCR. Reverse transcription of PLMVd (before the qPCR) was carried out on the 100-fold-diluted crude sap with the SuperScript III first strand synthesis system for RT-PCR (Invitrogen) according to the manufacturer’s instructions.
RT-PCR. RT-PCR according to (12), with primers hPLMVd and cPLMVd each used at 0.4 µM concentration, and Titan one-tube RT-PCR system, using a mix of AMV reverse transcriptase and High-Fidelity Taq polymerase (Roche Diagnostic, Penzberg, Germany), was used to confirm the infection status of the inoculated plants and as a reference method with which to compare our RT-qPCR. The sensitivity of the technique was evaluated on samples diluted 100-, 1,000-, and 10,000-fold. Amplification products were electrophoresed through a 1.2% agarose gel with the GeneRuler 100pb plus DNA ladder (Fermentas).
Quantitative real-time PCR. The qPCR was performed on a StepOne real-time thermal cycler (Applied Biosystems, Foster City, CA) equipped with the StepOne v.2.1 software. The forward primer used was F-PLMVd, and five possible specific reverse primers, selected in conserved PLMVd regions by ClustalW alignment of 119 PLMVd sequences (15), were tested (Table 1). The five primer pairs amplify PLMVd fragments ranging in size from 50 to 150 base pairs (bp) (Table 1). The
F-PLMVd/R7-PLMVd pair was chosen for its high efficiency and low dimerization potential, and the corresponding amplicon was synthesized by Eurogentec (Liège, Belgium) for use as a qPCR standard (standard-F and standard-R, see Table 1). This standard was diluted in crude extract from healthy tissue so as to take into account the effect of the extract on the efficiency and quantification. The qPCR, performed with the Maxima SYBR Green/ROX qPCR Master Mix (using Maxima Hot Start Taq DNA polymerase and a final MgCl2 concentration: 2.5 mM)
(Fermentas), included the following steps: 10 min at 95°C and 40 cycles of 95°C for 15 s, 60°C for 60 s. To check the specificity of the amplification, a melting curve was added at the end of the qPCR. It included 1 min at 60°C and then a rise by increments of 0.3°C (10 s at each temperature) up to 95°C. Three replicates were run for each sample as recommended for qPCR assay design.
Data analysis. All of the output data were analyzed with the StepOne v2.1 software (Applied Biosystems) using the preset parameters. The software was used to determine the PCR efficiency and to quantify the DNA in the reaction plate from serial dilutions of the PCR standards. Standard curves were generated for each set of serial dilutions by plotting the quantification cycle (Cq) value against the logarithm of the concentration for the exponential phase of the reaction and fitting a straight line to these data by simple linear regression (5,9,21). The slope of the standard curve was used to determine the efficiency (E) of the PCR: E = 10–1/slope – 1.
Optimal PCR efficiency is achieved when a slope of –3.32 is reached (21). The determination coefficient (R2) was calculated to determine the validity of the linear regression. For detection purposes, a quantification cycle (Cq) of 35 was established as the cutoff for distinguishing positive from negative samples as previously described (19).
Results
Development of the qPCR on positive controls. To develop the qPCR, we first used dimeric PLMVd cDNA clones to avoid the
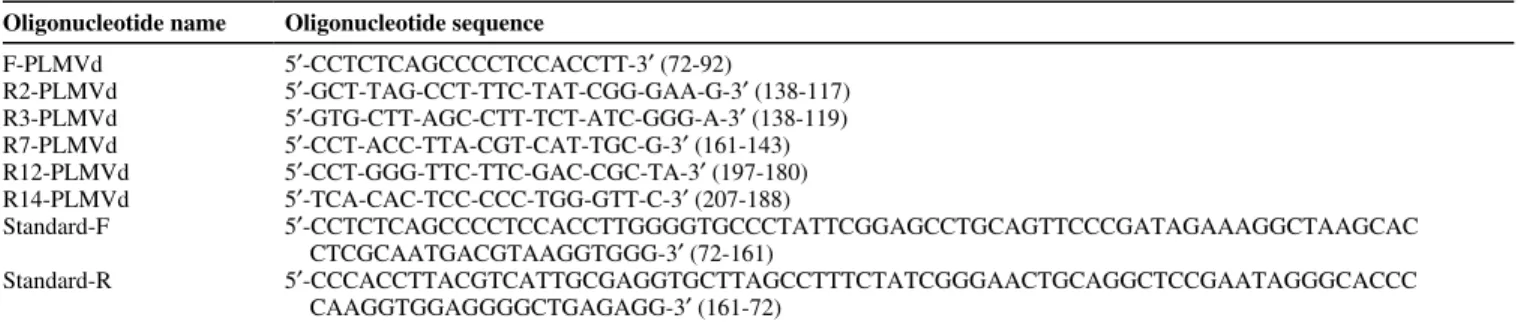
Table 1. Designed primers for the quantitative real-time amplification of the Peach latent mosaic viroid (PLMVd)a Oligonucleotide name Oligonucleotide sequence
F-PLMVd 5′-CCTCTCAGCCCCTCCACCTT-3′ (72-92) R2-PLMVd 5′-GCT-TAG-CCT-TTC-TAT-CGG-GAA-G-3′ (138-117) R3-PLMVd 5′-GTG-CTT-AGC-CTT-TCT-ATC-GGG-A-3′ (138-119) R7-PLMVd 5′-CCT-ACC-TTA-CGT-CAT-TGC-G-3′ (161-143) R12-PLMVd 5′-CCT-GGG-TTC-TTC-GAC-CGC-TA-3′ (197-180) R14-PLMVd 5′-TCA-CAC-TCC-CCC-TGG-GTT-C-3′ (207-188) Standard-F 5′-CCTCTCAGCCCCTCCACCTTGGGGTGCCCTATTCGGAGCCTGCAGTTCCCGATAGAAAGGCTAAGCAC CTCGCAATGACGTAAGGTGGG-3′ (72-161) Standard-R 5′-CCCACCTTACGTCATTGCGAGGTGCTTAGCCTTTCTATCGGGAACTGCAGGCTCCGAATAGGGCACCC CAAGGTGGAGGGGCTGAGAGG-3′ (161-72)
a For each primer pair the length of the amplicon is comprised of between 65 and 120 base pairs. Standard-F and Standard-R refer to the quantitative
polymerase chain reaction (qPCR) standards used for the quantifications. Numerals in brackets refer to the primer position in the PLMVd sequence.
Fig. 1. Polymerase chain reaction amplifications performed with the five newly designed primer pairs at 60 and 64°C. M refers to the molecular weight ladder O’GeneRuler 50pb (Fermentas). A to E, Use of reverse primers R14, R12, R7, R3, and R2, respectively, at 60°C. F to J, Use of the same reverse primers at 64°C.
difficulties of the reverse transcription and the inhibitory effect of total extract. Five reverse primers were selected in conserved regions of the PLMVd highlighted by a multiple sequence alignment of 119 PLMVd sequences. To avoid selecting nonspecific primers amplifying plant DNA or RNA, the five reverse primers (R14, R12, R7, R3, and R2) combined with the forward primer (F-PLMVd) were tested by RT-PCR on crude sap extract from peach tree leaves. Three PLMVd-specific primers were thus identified, yielding amplicons of 65 to 135 bp, as recommended for qPCR. Primers R12 and R3 appeared nonspecific, as they yielded multiband patterns (Fig. 1B and D). Primers R14 and R7 seemed highly specific (Fig. 1A and C). Finally, the R2/F-PLMVd pair yielded a smear at 60°C (Fig. 1E). A temperature gradient was applied to avoid this smear (data not shown), and amplification was specific at 64°C (Fig. 1J). This primer pair was abandoned, however, as amplification with R14 or R7 was less efficient at 64°C (Fig. 1F and H). A similar, high efficiency was recorded for R14 and R7 (respectively, 97.0 and 97.21%), but a slightly higher determination coefficient was obtained with the F-PLMVd/R7 pair (R2 = 0.991 versus R2 =
0.984). This primer pair was selected for further optimizations. To determine the lowest concentration allowing optimal efficiency (E) while avoiding primer dimer formation, three primer concentrations were tested in the qPCR: 50 nM, 150 nM, and 300 nM. Best results were obtained at 300 nM (E300nM = 97.7%, R2 =
0.997; E150nM = 87.8%, R2 = 0.993; E50nM = 87.1%, R2 = 0.996)
(Figs. 2 and 3).
Development of the whole procedure, from extraction and RT to qPCR. Selection of the extraction method. A complete test was developed involving extraction followed by analysis in two separate steps: reverse transcription of PLMVd and quantitative real-time amplification of the fragment defined by the selected primers. Three extraction methods were tested: total RNA extraction and the preparation of crude sap with 2× SSC or KAJI buffer, both of which are commonly used to efficiently detect viroids and fruit tree viruses (1,12). The amplification efficiencies
Fig. 2. Optimization of the F-PLMVd/R7-PLMVd primer pair concentration in the real-time quantitative polymerase chain reaction (qPCR). Concentration of each primer: 300 nM, 150 nM, or 50 nM as indicated. Standard curves were obtained by plotting quantification cycle (Cq) values versus the logarithm of the initial quantity of Peach latent mosaic viroid (PLMVd) cDNA clone. Three replicates were run for each quantity.
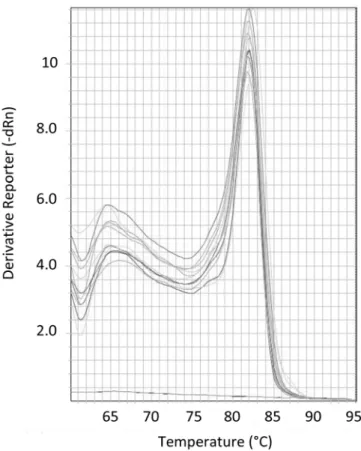
Fig. 3. Melting curve analysis of the amplicon generated with the standard and no-template control (NTC). The x-axis indicates the temperature and the y-axis the negative first derivative of the normalized fluorescence generated by the reporter during polymerase chain reaction amplification. No peak corresponding to a nonspecific amplicon or primer dimer is observed.
determined by RT-qPCR for these three extraction methods are presented in Table 2. The results show that all three extraction methods can be used to amplify the viroid by qPCR. For amounts of extract corresponding to the same weight of leaf tissue from the same tree, the Cq was significantly lower after total RNA extraction than after crude extract preparation (Table 3). This suggests that the total RNA extraction provides more viroid RNA or lacks in components that could inhibit the qPCR reaction. Yet the PCR efficiency and R2 coefficient were higher for samples
extracted with the KAJI or SSC buffer (ETotRNA = 81.3%, R2TotRNA
= 0.94; EKAJI = 88.7%, R2KAJI = 0.94; and ESSC = 90%, R2SSC =
0.99), and crude sap extraction is easiest to apply for routine use in diagnostic laboratories. A comparison of the two crude sap extraction procedures showed that the better PCR efficiency and lower Cq were obtained after extraction in 2× SSC and 1% sodium sulfite. These results led us to choose this extraction procedure as the most suitable for routine diagnosis in terms of rapidity, viroid recovery, and cost.
Optimization of sample dilution. Sample dilution was optimized so as to limit the inhibitory effect of the crude sap in the reverse transcription and subsequent qPCR. A qPCR efficiency between 90 and 99% was obtained with a 100-fold dilution of the crude extract (as recommended previously for the RT-PCR [12]) before the reverse transcription step and the use of 2 µl of the produced cDNA for the amplification (amounting to a total 1,000-fold dilution). Detection tests performed on negative controls (a sample from a healthy plant and a water sample) showed that neither the PLMVd nor any nonspecific amplifiable material was detectable before cycle 35 (chosen as the positive detection limit) under these conditions (Table 4).
Comparison of our RT-qPCR with the reference RT-PCR. To compare the sensitivities of the reference PCR and our RT-qPCR, both methods were used to detect the viroid in the same sample. For the RT-PCR, two replicates of three different dilutions were used (1/100–1/1,000–1/10,000) (Fig. 4). For the RT-qPCR, expected to be more sensitive, a range of 10-fold dilutions from 10–3
to 10–7 was tested. The RT-PCR detected PLMVd only in the first dilution, and the RT-qPCR proved to be 105 times as sensitive
(Table 3, Figs. 4 and 5). The standard deviation of the Cq (Cq SD, calculated for the three replicates of each sample) was near zero for each dilution, showing the repeatability of the technique. The
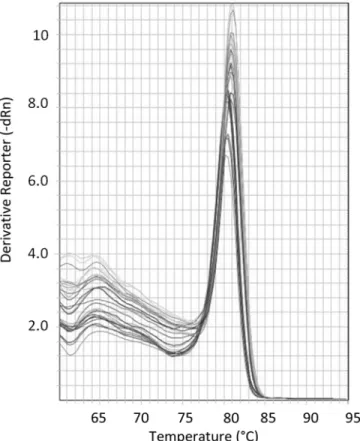
reproducibility of the qPCR was also checked by independent amplifications from the same extract (data not shown). The melting curve confirmed specific amplification of the PLMVd even in the most diluted samples (Fig. 6).
Comparison of RT-PCR and RT-qPCR applied to plant samples taken over a 12-month period. To confirm the utility of our RT-qPCR in certification procedures, we performed PLMVd amplifications on extracts from two young peach seedlings inoculated 3 months after emergence. As these seedlings were in active development, we assumed they were actively replicating PLMVd (20). Each month until 1 year postinoculation, eight leaves per plant were harvested, frozen, and stored. The reference RT-PCR did not detect PLMVd in the samples harvested until 8 months postinoculation. With our optimized RT-qPCR, the viroid was already detectable and quantifiable (Cq < 35) 3 months postinoculation (Fig. 7). All the plants were inoculated in June, and the quantity of viroid appeared to remain stable in the greenhouse over the winter. After 8 to 9 months, with the arrival of spring and increased plant growth, the viroid level increased drastically. During this active replication period, the Pearson’s correlation coefficient, measuring the strength of the linear relationship between two variables, revealed a significant linear correlation between the viroid titer and the number of weeks of active viroid replication after inoculation.
Discussion
Traditional RT-PCR procedures for detecting PLMVd have clearly shown their limitations in certification programs. Essentially, they are not sensitive enough, and this leads to false-negative results. Problems include primer dimer formation, samples with a low viroid level, and the unequal distribution of PLMVd through the plant. To allow detection of lower viroid quantities and thereby limit the risk of false negatives, we have developed a quick and highly sensitive RT-qPCR.
Table 4. Quantification cycle (Cq) mean and standard deviations (SD)
obtained after amplification on control samples (water and extract from healthy tissue)
Sample Cq mean SD
Healthy 35.79 1.61
Water 35.86 0.087
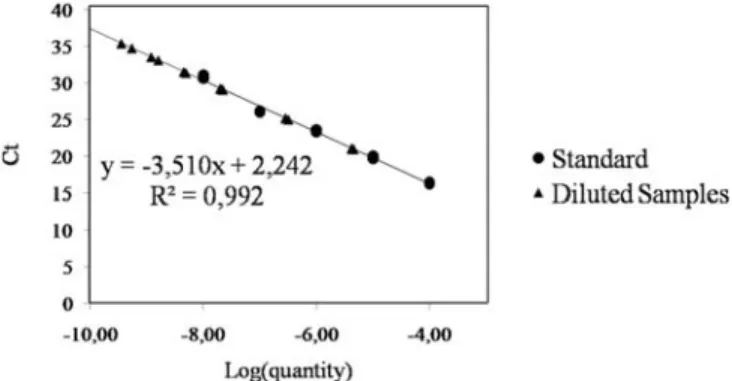
Fig. 5. Standard curve analysis of quantitative polymerase chain reaction (qPCR) sensitivity. The x-axis displays the logarithm of the DNA quantity and the y-axis the measured quantification cycle (Cq) value. Round points: standards used to calculate the curve; triangles: diluted samples. E: qPCR efficiency.
Table 2. Influence of extraction method on polymerase chain reaction
(PCR) efficiency and R2 value
Extraction method PCR efficiency R2
Qiazol 81.5% 0.94
2X SSC 99.0% 0.99
KAJI 88.7% 0.94
Fig. 4. Sensitivity of the reverse transcription–polymerase chain reaction technique. M, molecular weight ladder Gene Ruler 100bp Plus (Fermentas); Bl, blank sample. Letters A to C, sample dilutions 104-fold (A, A’), 1,000-fold (B, B’), and 100-fold (C,
C’). The (’) designates the second replicate. The 340-bp amplicon corresponds to Peach latent mosaic viroid (PLMVd). Lower band corresponds to primer dimers.
Table 3. Mean of measured quantification cycle (Cq) according to
extraction method for three serially diluted samples
Extraction method Dilution Total RNA (mean Cq) KAJI Buffer (mean Cq) SSC 2× buffer (mean Cq) 103 17.85 ± 0.6 23.52 ± 0.24 19.84 ± 0.08 104 21.16 ± 0.16 28.50 ± 0.67 23.49 ± 0.06 105 25.08 ± 0.39 32.93 ± 2.24 26.49 ± 0.08 106 28.49 ± 0.28 33.87 ± 1.51 29.79 ± 0.07 107 38.91 ± 1.88 36.67 ± 1.21 32.06 ± 0.03
We demonstrate here the importance of choosing adequate primers and a good extraction method. Use of the primers developed previously yields a fragment that is too long for qPCR (340 nucleotides) (12), there being a risk of reaching saturating levels of fluorescence or of depleting the PCR reagents too rapidly. It was therefore necessary to design new primers. The primers selected in this study allow specific, efficient amplification of an 89-nucleotide fragment suitable for qPCR. The other (recent)
sensitive detection protocols of which we are aware use time-consuming total RNA or liquid-nitrogen-based extraction procedures (2,3,19). Here we show that both crude sap extraction methods tested are quite efficient. They are also easy, quick, and relatively cheap, so that the technique can be exploited advantageously by many laboratories. To eliminate the PCR-inhibiting effect of the crude sap (inherent in this type of extraction [2]), it is sufficient to dilute the sap 1,000-fold, with no need of further purification. Furthermore, by diluting the standards in crude sap from healthy tissue, it is possible to ensure that a negative result really means that the plant is healthy or that the PLMVd concentration is below the detection level of the developed RT-qPCR.
The high sensitivity of this RT-qPCR makes it possible to detect and quantify low-level or early infections of peach trees by the PLMVd. This should help improve the efficacy of certification programs. Moreover, the absence of postamplification procedures reduces the risk of cross-contamination by comparison with RT-PCR and RT-LAMP (2,3), and permits the use of robotic laboratory handling systems. Finally, the higher cost of the qPCR reagents and the increased manipulation time before amplification are counterbalanced by the accurate results and the possibility of early PLMVd detection.
The technique does not yield absolute quantities of PLMVd in the leaf samples, as it is impossible to recover all of the crude sap after grinding and to evaluate correctly the efficiency of reverse transcription in the presence of crude sap. One can assume, however, that crude sap recovery and the reverse transcription efficiency are the same for all samples treated in a particular experiment, so that samples can be compared and a picture gained of (i) the infection level or (ii) the replication level of the PLMVd variant in these samples. Furthermore, the quantitative effects demonstrated here are in agreement with those established by dot blot hybridization (4). Our results show that PLMVd levels are higher during the spring and summer than during the winter, which may be explained by higher metabolic activity of plants during the growing season and use of plant enzymes for viroid replication (20). Also, we have shown a significant correlation between the viroid titer and the number of weeks postinoculation, as in the case of the citrus viroid CVd III (19). PLMVd thus seems unaffected by plant defense mechanisms during its life cycle in infected plants.
This technique should further the in vivo study of PLMVd replication, thanks to its capacity to quantify PLMVd in peach tree leaves quickly and without the need to use dangerous ingredients such as radioactive materials.
Fig. 6. Melting curve analysis of the amplicon generated with the standard. The x-axis indicates temperature and the y-x-axis the negative first derivative of the normalized fluorescence generated by the reporter during polymerase chain reaction (PCR) amplification. No signals of possible aspecific amplicons are present in standard amplifications and in the diluted samples.
Fig. 7. Quantification by optimized quantitative polymerase chain reaction (qPCR) of Peach latent mosaic viroid (PLMVd) in leaves from two seedlings harvested 3 to 12 months after inoculation. Data are expressed in PLMVd molecules per milligram of leaves.
Our method should help to avoid the accidental release of infected material into orchards and considerably accelerate the certification of new material (thanks to the reduced incubation time of the plant to be tested). Some of our results, however, suggest that PLMVd is not uniformly distributed in the plant (data not shown), so precautions need to be taken when sampling, especially in the framework of certification. Nevertheless, the high sensitivity of this method should limit the risk of false negatives. Further studies should be carried out to understand the distribution of PLMVd in trees and to optimize sampling procedures.
Acknowledgments
This work was supported by the Belgian Fonds National de la Recherche Scientifique (FNRS). O. Parisi was the recipient of a F.R.I.A. fellowship. Literature Cited
1. Aldaghi, M., Massart, S., Dutrecq, O., Bertaccini, A., Jijakli, M. H., and Lepoivre, P. 2009. A simple and rapid protocol of crude DNA extraction from apple trees for PCR and real-time PCR detection of ‘Candidatus Phytoplasma mali’. J. Virol. Methods 156:96-101.
2. Boonham, N., Pérez, L. G., Mendez, M. S., Peralta, E. L., Blockley, A., Walsh, K., Barker, I., and Mumford, R. A. 2004. Development of a real-time Rt-PCR assay for the detection of Potato spindle tuber viroid. J. Virol. Methods 116:139-146.
3. Boubourakas, I. N., Fukuta, S., and Kyriakopoulou, P. E. 2009. Sensitive and rapid detection of Peach latent mosaic viroid by the reverse transcription loop-mediated isothermal amplification. J. Virol. Methods 160:63-68.
4. Bussière, F., Lehoux, J. D., Thompson, A., Skrzeczkowski, L. J., and Perreault, J. P. 1999. Subcellular localization and rolling circle replication of Peach latent mosaic viroid: Hallmarks of group a viroids. J. Virol. 73:6353-6360.
5. Bustin, S. A., Benes, V., Garson, J. A., Hellemans, J., Huggett, J., Kubista, M., Mueller, R., Nolan, T., Pfaffl, M. W., Shipley, G. L., Vandesompele, J., and Wittwer, C. T. 2009. The Miqe guidelines: Minimum information for publication of quantitative real-time PCR experiments. Clin. Chem. 55: 611-622.
6. Daros, J. A., Elena, S. F., and Flores, R. 2006. Viroids: An Ariadne’s thread into the RNA labyrinth. EMBO J. 7:593-598.
7. Diener, T. O. 1972. Potato spindle tuber viroid. Vii. Susceptibility of several Solanaceous plant species to infection with low molecular-weight RNA. Virology 48:606-609.
8. Ding, B. 2009. The Biology of Viroid-Host Interaction. Annu. Rev. Phytopathol. 47:105-131.
9. Edwards, K., Logan, J., and Saunders, N. 2004. Real-Time PCR: An Essential Guide. Horizon Bioscience, Wymondham, Norfolk.
10. European Plant Protection Organization Bulletin 2001. Certification scheme
for almond, apricot, peach and plum. EPPO Bull. 31:463-478.
11. Fekih Hassen, I., Massart, S., Motard, J., Roussel, S., Parisi, O., Kummert, J., Fakhfakh, H., Marrakchi, M., Perreault, J. P., and Jijakli, M. H. 2007. Molecular features of new Peach latent mosaic viroid variants suggest that recombination may have contributed to the evolution of this infectious RNA. 360:50-57.
12. Fekih Hassen, I., Roussel, S., Kummert, J., Fakhfakh, H., Marrakchi, M., and Jijakli, M. H. 2006. Development of a rapid Rt-PCR test for the detection of Peach latent mosaic viroid, Pear blister canker viroid, Hop stunt viroid and Apple scar skin viroid in fruit trees from Tunisia. J. Phytopathol. 154:217-223.
13. Flores, R., Delgado, S., Gas, M. E., Carbonell, A., Molina, D., Gago, S., and De la Pena, M. 2004. Viroids: The minimal non-coding RNAs with autonomous replication. FEBS Lett. 567:42-48.
14. Flores, R., Randless, J. W., Bar-Joseph, M., and Diener, T. O. 2000. Subviral agents: Viroids. Pages 1009-1024 in: Virus Taxonomy, Seventh Report of the International Committee on Taxonomy of Viruses. M. H. V. van Regenmortel, C. M. Fauquet, D. H. L. Bishop, E. B. Carstens, M. K. Estes, S. M. Lemon, D. J. McGeoch, J. Maniloff, M. A. Mayo, C. R. Pringle, and R. B. Wickner, eds. Academic Press, San Diego, CA.
15. Larkin, M. A., Blackshields, G., Brown, N. P., Chenna, R., McGettigan, P. A., McWilliam, H., Valentin, F., Wallace, I. M., Wilm, A. L. R., Thompson, J. D., Gibson, T. J., and Higgins, D. G. 2007. ClustalW and ClustalX Version 2. Bioinformatics 23:2947-2948.
16. Loreti, S., Faggioli, F., Cardoni, M., Mordenti, G., Babini, A. R., Poggi Pollini, C., and Barba, M. 1999. Comparison of different diagnostic methods for detection of Peach latent mosaic viroid. EPPO Bull. 29:433-438.
17. Malfitano, M., Barone, M., Duran-Vila, N., and Alioto, D. 2005. Indexing of viroids in citrus orchards of Campania, Southern Italy. J. Plant Pathol. 87:115-121.
18. Markarian, N., Li, H. W., Ding, S. W., and Semancik, J. S. 2004. RNA silencing as related to viroid induced symptom expression. Arch. Virol. 149:297-406.
19. Rizza, S., Nobile, G., Tessitori, M., Catara, A., and Conte, E. 2009. Real time Rt-PCR assay for quantitative detection of Citrus viroid III in plant tissues. Plant Pathol. 58:181-185.
20. Singh, R. P., Ready, K. F. M., and Nie, X. 2003. Biology. Page 3 in: Viroids. H. Hadidi, R. Flores, J. Randles, and J. Semancik, eds. CSIRO Publishing, Victoria, Australia.
21. Turechek, W. W., Hartung, J. S., and McCallister, J. 2008. Development and optimization of a real-time detection assay for Xanthomonas fragariae in strawberry crown tissue with receiver operating characteristic curve analysis. Phytopathology. 98:359-368.
22. Valasek, M. A., and Repa, J. J. 2005. The power of real-time PCR. Adv. Physiol. Educ. 29:151-159.
23. Zhu, Y., Qi, Y., Xun, Y., Owens, R., and Ding, B. 2002. Movement of Potato spindle tuber viroid reveals regulatory points of phloem-mediated RNA traffic. Plant Physiol. 130:138-146.