HAL Id: hal-00463568
https://hal.archives-ouvertes.fr/hal-00463568
Submitted on 12 Mar 2010
HAL is a multi-disciplinary open access
archive for the deposit and dissemination of
sci-entific research documents, whether they are
pub-lished or not. The documents may come from
teaching and research institutions in France or
abroad, or from public or private research centers.
L’archive ouverte pluridisciplinaire HAL, est
destinée au dépôt et à la diffusion de documents
scientifiques de niveau recherche, publiés ou non,
émanant des établissements d’enseignement et de
recherche français ou étrangers, des laboratoires
publics ou privés.
Analysis of Freely Available Dataset for HDTV including
Coding and Transmission Distortions
Marcus Barkowsky, Margaret Pinson, Romuald Pépion, Patrick Le Callet
To cite this version:
Marcus Barkowsky, Margaret Pinson, Romuald Pépion, Patrick Le Callet. Analysis of Freely Available
Dataset for HDTV including Coding and Transmission Distortions. Fifth International Workshop on
Video Processing and Quality Metrics (VPQM), Jan 2010, Scottsdale, United States. �hal-00463568�
ANALYSIS OF FREELY AVAILABLE SUBJECTIVE DATASET FOR HDTV INCLUDING
CODING AND TRANSMISSION DISTORTIONS
Marcus Barkowsky
1, Margaret Pinson
2, Romuald Pépion
1, Patrick Le Callet
11
IRCCyN UMR 5697 CNRS, École Polytechnique de l’Université de Nantes,
rue Christian Pauc, La Chantrerie 44306 Nantes, France
{Marcus.Barkowsky,Romuald.Pepion,Patrick.LeCallet}@univ-nantes.fr
2
National Telecommunication and Information Administration (NTIA),
Institute for Telecommunication Sciences (ITS),
325 Broadway, Boulder, CO 80305, [email protected]
ABSTRACT
We present the design, preparation, and analysis of a subjective experiment on typical HDTV sequences and scenarios. This experiment follows the guidelines of ITU and VQEG in order to obtain reproducible results. The careful selection of content and distortions extend over a wide and realistic range of typical transmission scenarios. Detailed statistical analysis provides important insight into the relationship between technical parameters of encoding, transmission and decoding and subjectively perceived video quality.
1. INTRODUCTION
Users expect excellent quality from High Definition Television (HDTV). This can only be achieved by transmitting at a high bitrate that preserves image details. However, HDTV is often transmitted via satellite channels or packet switched networks, which have a limited bandwidth and often introduce transmission errors. Therefore it is desirable to measure video quality and tune the transmission system in order to deliver the highest visual quality under given technological constraints. Industry needs automated algorithms that can make these measurements quickly and easily. The Video Quality Experts Group (VQEG) has been working since 1997 on the validation of objective methods to measure video quality. VQEG performed experiments to validate the performance of objective models for standard definition television and lower resolution video [1], [2]. These models either compared the degraded video to the reference video or examined the degraded video. The problem is that industry often does not have access to the reference video and, thus far, models that examine only the degraded video have shown limited accuracy in VQEG validation testing.
Interest is thus focused on an alternative type of model, the hybrid model. This type of model examines both the bitstream and the decoded video, but not the reference video. Hybrid models hope to increase quality estimation accuracy while using only data available in a typical in-service application. The Joint Effort Group (JEG) within VQEG started a collaborative development of such a model in cooperation with the International Telecommunication Union – Standardization Sector (ITU-T) and their work on P.NAMS and P.NBAMS [3].
The subjective experiment described here was conducted in the course of the VQEG HDTV validation test currently underway. The bitstream data for this test were retained and will be made available by IRCCyN in order to encourage research into hybrid models.
2. SETUP OF THE SUBJECTIVE EXPERIMENT
The design and execution of this subjective experiment conformed to the VQEG HDTV Test Plan [4], and this paper uses VQEG terminology. The VQEG term for source video sequence is SRC (SouRCe), and the VQEG term for a distortion is HRCs (Hypothetical Reference Circuit, a fixed combination of a video encoder at a given bitrate, network condition and video decoder). Processed Video Sequences (PVS) displayed to the observers were generated using a full factorial design: each of nine SRC were degraded by each of fifteen HRCs (135 PVSs), and the source videos were presented as a sixteenth condition. The video resolution was 1920x1080 pixels at 59.94 fields-per-second in interlaced format. The PVSs were generated using 14 second video sequences. For the subjective test, only the middle 10 seconds were used, thus discarding any transient effect at the beginning or end of the sequence resulting from the video processing in the first or last two seconds. In addition to the 144 videos described above, a set of 24 video sequences were rated that are common to all subjective tests in VQEG’s
HDTV test, but those will not be further analyzed in this paper. Audio was not included in this experiment. The subjective experiment was conducted in an ITU conforming test environment following the additional guidelines of VQEG’s HDTV testplan. The display was a TVLogic LVM401W connected to a DVC1 video server using an HD-SDI connection in order to maintain the interlaced format. In total, 24 non-expert observers viewed the content at a distance of 1.5m corresponding to three times the picture height. An interactive setup for Absolute Category Rating with Hidden Reference (ACR-HR) conforming to ITU-T P.910 [5] with a 5 point rating scale was used. Each subject’s participation took less than one hour. The observers were screened according to ITU-T BT.500 [6] and the VQEG multimedia testplan. None of the observers were rejected.
2.1 SRC Selection
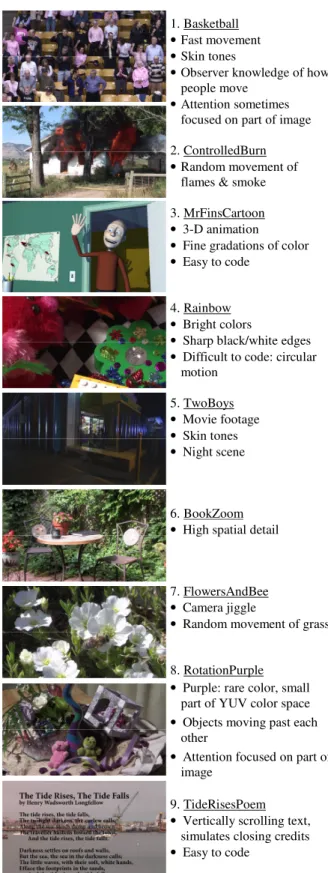
Reference sequence selection is crucial to viewer performance and for the validity of the analysis. Particular care was spent filming new content and selecting a balanced set of nine SRC. These SRC depict various video characteristics that might trigger unique coder responses or exercise an objective model’s ability to track human perception. Figure 1 identifies some characteristics that motivated the selection of each scene. This selection was constrained by VQEG’s desire to use footage that could be freely redistributed. These SRC are expected to be made available on the Consumer Digital Video Library (CDVL) [7] in 2010.
2.2 HRC Selection
The test design focused on two typical video codecs: H.264 and MPEG-2. The design includes more H.264 impairments than MPEG-2, because this algorithm has become increasingly popular for HDTV distribution. In terms of visual degradations, the fifteen different HRCs cover a broad range of typical distortions that occur in secondary distribution HDTV. Ten of the HRCs included coding impairments only, and five contained coding with simulated transmission error impairments. An overview of the parameters is given in Table 1. Please note, that the last column specifies the mean of the average temporal bitrate for all the different contents. The average temporal bitrate per content varies significantly as a fixed QP was selected. For example,
1
Certain commercial hardware and software are identified in this report to specify adequately the technical aspects of the reported results. In no case does such identification imply recommendation or endorsement by Polytech’ Nantes or the National Telecommunications and Information Administration, nor does it imply that the material or equipment identified is necessarily the best available for this purpose.
the bitrate for HRC1 is in the range from 1.2Mb/s to 28Mb/s with an average of 13.5Mb/s.
In a hybrid video coder, the individual images are predicted from previously transmitted image information. The resulting image information is transformed using a discrete cosine transform. The coefficients are then linearly quantized. The step size of the quantization is controlled by the encoding parameter QP (Quantization Parameter). An entropy encoding step follows. Quantization is the primary algorithmic cause of lost information in these video encoders and it is directly linked to image degradation. The QP values of H.264 and MPEG-2 translate differently to the quantization step sizes and so should not be compared. Further information can be found in [8] and [9].
The visual quality of each encoding in this experiment depended primarily on the coarseness of the QP controlled quantization of the transformed coefficients. The severity of each encoding was controlled by selecting a fixed value for QP throughout the complete video sequence, thus minimizing temporal quality variation. The intention of this approach was to degrade the visual quality of the sequences independently from the complexity of the content using a variable bitrate. Using a variable bitrate is not typical for video broadcasts. A typical application of a variable bitrate coder is a download scenario. However, because fast changes in quality annoy the viewer, most video encoders restrict temporal variations in quality. The video coding standards do not specify the encoder implementation, so the temporal adaptation of QP in order to maintain a constant bitrate is an implementation specific decision. This general behavior can be piecewise emulated by using fixed QP evaluations.
The H.264 HRCs were created using the reference encoder [10]. HRCs 1-4 contain coding only impairments, corresponding to four different H.264 QPs that span the visual quality range: 26, 32, 38 and 44.
HRCs 5-8 contain coding at the highest quality H.264 QP level selected (QP26) plus simulated transmission errors. HRCs 5-7 contained the same bitstream as HRC 1. HRC 8 contained a different color representation that led to a different error concealment behavior of the H.264 reference decoder. Where packet loss in HRCs 5-7 caused mainly blurriness and motion artifacts, packet loss in HRC 8 caused green blocks.
The transmission errors for HRC 5-8 were created by manually creating a burst in the middle of the video sequence. This placement ensured that the scene cut at the beginning and end of the scene would not visually mask transmission error artifacts. HRCs 5 and 8 contained one short burst of low level
Figure 1. Sample frame from each SRC with content characteristics.
Table 1. List of Hypothetical Reference Circuits (HRC)
HRC Codec Parameters, Remarks
Average Bitrate
0 None Source video sequence (Reference) 1 H.264 QP26 13.5Mb/s 2 H.264 QP32 5.1 Mb/s 3 H.264 QP38 2.3 Mb/s 4 H.264 QP44 1.2 Mb/s 5 H.264 QP26, Short burst of Packetloss at 0.7% 12.7 Mb/s 6 H.264 QP26, Long burst of Packetloss at 4.2% 12.3 Mb/s 7 H.264 QP26, Short burst of Packetloss at 4.2% 12.3 Mb/s 8 H.264 QP26, Short burst of Packetloss at 0.7% Green blocks 13.4 Mb/s 9 H.264 QP26, Rescaled Transmission in 720p 11.3 Mb/s 10 H.264 QP38, Rescaled Transmission in 720p 2.5 Mb/s 11 Transc. MPEG2 at QP15 followed by H.264 at QP38 2.4 Mb/s 12 MPEG2 QP10 10.0 Mb/s 13 MPEG2 QP15 6.5 Mb/s 14 MPEG2 QP25 3.8 Mb/s 15 MPEG2 QP10, 3 Bursts of Biterrors 10.0 Mb/s
packet loss. From 42% to 56% of the way through the 14 second sequence’s bitstream, 0.7% of packets were randomly lost. Thus, there were no errors from the beginning of the bitstream until 42% of the way through the bitstream and also no errors from 56% to the end. HRC 6 and 7 each contained a similar burst but created with different parameters. HRC 6 contained 4.2% of packets randomly lost from 21% to 64% of the way through the bitsream. HRC 7 contained 4.2% of packets randomly lost from 42% to 56% of the way through the bitstream. The corresponding range of frames is not obvious, due to the prediction of the H.264 video encoder. These transmission error HRCs simulated packet loss on a real-time transport protocol (RTP) connection. In order to allow a graceful degradation, the encoder always used two interlaced slice groups of 2 macroblock lines. For error recovery, an intra image was forced every 24 frames and the ratio of intra macroblock refresh was 5%.
HRCs 9-10 contain coding only impairments over a 720p 59.94 frames-per-second channel, using QP levels 26 and 38. Each 1080i field was up-scaled into a progressive 1080p
1. Basketball • Fast movement • Skin tones
• Observer knowledge of how people move
• Attention sometimes focused on part of image 2. ControlledBurn • Random movement of
flames & smoke 3. MrFinsCartoon • 3-D animation • Fine gradations of color • Easy to code
4. Rainbow • Bright colors
• Sharp black/white edges • Difficult to code: circular
motion 5. TwoBoys • Movie footage • Skin tones • Night scene 6. BookZoom • High spatial detail
7. FlowersAndBee • Camera jiggle
• Random movement of grass
8. RotationPurple • Purple: rare color, small
part of YUV color space • Objects moving past each
other
• Attention focused on part of image
9. TideRisesPoem • Vertically scrolling text,
simulates closing credits • Easy to code
frame using line duplication, and then the 1080p, 59.94 frames-per-second sequence was scaled to 720p. After encoding and decoding, the video was converted back to 1080i using the inverse process.
The MPEG-2 HRCs were created using the ffmpeg encoder and decoder [11]. HRCs 12-14 contain only coding impairments, corresponding to three different QP that span the visual quality range. HRC 15 contains coding at the highest quality QP level selected plus simulated transmission errors. These were generated by overwriting about 11% of the bitstream with zeros, equally split into three parts at 21%, 43% and 64% of the way through the 14s video sequence’s bitstream. For some content, these locations had to be shifted slightly, because the sequence was not decodable.
HRC 11 was an example for heterogeneous transcoding (e.g., two different video coding methods are applied sequentially, in this case, MPEG-2 and H.264). To create HRC 11, the decoded HRC 13 PVSs were re-encoded with the same settings as HRC 3.
3. SUBJECTIVE RESULTS
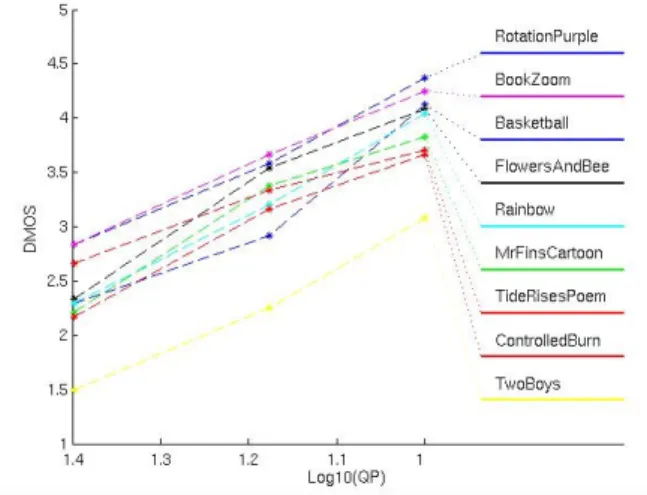
Figure 2 shows the relationship between the subjective Mean Opinion Score (MOS) and QP for the coding only H.264 sequences (HRC 1-4). The quality scores range from “bad” (MOS=1) to approximately “good” (MOS=4). For a single QP, the perceived quality spans a range, depending on the content. The range is largest for QP32, spanning 1.4 MOS. In this case, the blocking artifacts on the smoothly shaded background of the MrFinsCartoon sequence (described in Figure 1) appear to be very annoying, while the degradations in high motion sequences, such as Basketball, RotationPurple and FlowersAndBee, are less perceptible.
Figure 3 presents the data from HRCs 1-4 by bitrate instead of QP. This semilogarithmic plot demonstrates the exponential relationship between the bitrate and the MOS. The gradient in this range is 0.232 logBitrate/MOS. Figure 3 also demonstrates why a fixed bitrate per HRC may not be suitable for subjective experiments on HDTV content. The highest quality for MrFinsCartoon (MOS=3.9) is associated with a bitrate of 1.2 MBit/s, while the lowest quality of Rainbow (MOS=1.1) requires 2.1 MBit/s. Thus we see a problem with an HDTV experiment design that uses a full matrix of SRC by fixed bitrate: easy-to-code SRC produce transparent PVSs, while hard-to-code SRC produce PVSs of such low quality as to be uninteresting.
The results for MPEG-2 coding only can be found in HRCs 12-14. Figure 4 and Figure 5 depict HRCs 12-14 for QP and bitrate respectively. As seen in Figure 3 and
Figure 5, the gradient (i.e., MOS/log(bitrate)) for MPEG-2 is equal to the one found for H.264.
By comparing Figure 2 with Figure 4, we see the different relationship between the values of QP and MOS for H.264 and MPEG-2. While the data on both plots appear linear, Figure 2 plots QP while Figure 4 plots log(QP). Because the relationship between the value of QP and the quantization step is linear for MPEG-2, when QP is low (high quality), small changes to QP result in dramatic changes to quality and bitrate. When QP is high, small changes to QP result in minor changes. This is why HRCs 12-14 used unevenly spaced QP (10, 15 & 25) to get MOSs near 2, 3, and 4. The developers of H.264 fixed this problem by imposing a logarithmic relationship between the step size of the quantizer and QP [8]. Thus HRC 1-4 use evenly spaced QP (26, 32, 38 & 44). By comparing HRC 1 and HRC 3 with HRC 9 and HRC 10 respectively, we see that the conversion to 720p resulted in small changes. The average MOS for HRC 9 was 0.22 lower than HRC 1; and the average MOS for HRC 10 was 0.08 lower than HRC 3. The average HRC 9 bitrate was 3% higher than the average HRC 1 bitrate, and the average HRC 10 bitrate was 2% lower than the average HRC 3 bitrate.
HRC 11 employed a two stage transcoding. The first stage was identical to HRC 13 (MPEG-2), and the second stage corresponded to HRC 3 (H.264). The decoded MPEG-2 video (from the first stage) was used as the input for the H.264 encoder to complete stage two. The overall bitrate of HRC 11 was about 40% of the bitrate of stage one alone, and the visual quality was reduced by 1 MOS with respect to HRC 13. The bitrates of the transcoded sequences in HRC 11 stage two were always higher than those of corresponding sequences in HRC 3. On average, transcoding increased the bitrate requirement by 8% but the visual quality stayed the same. It is known that there is always loss due to the different transformations for MPEG-2 and H.264 and the fact that the quantization levels are not in the same positions [12].
Figure 6 shows the visual quality of all video sequences with native 1080i H.264 encoding. The coding only impairments on the left side (HRCs 1-4) can be compared to coding plus transmission errors on the right hand side (HRCs 5-8). Since HRC 5-8 were all generated from HRC 1, it is obvious that the transmission errors were perceptible. The short burst of 0.7% packet loss in HRC 5 received the highest quality score. HRC 8 used the same amount of packet loss, and this was judged to be 0.7 MOS worse. This can be attributed to the inferior error concealment algorithm. HRC 7 used the same duration of packet loss as HRCs 5, but a higher percentage of dropped packets (4.2%) which led to a lower MOS. HRC 6 also used the higher percentage of dropped packets (4.2%) and a longer duration which was judged to be even worse.
Figure 2: MOS versus QP for H.264 Coding (HRC 1-4) Figure 3: MOS versus bitrate [Bit/s] in semilogarithmic scaling for H.264 (HRC 1-4)
Figure 4: MOS versus the logarithm of the QP for MPEG-2 (HRC 12-14)
Figure 5: MOS versus bitrate [Bit/s] in semilogarithmic scaling for MPEG-2 (HRC 12-14)
Figure 6: Influence of coding, transmission errors and different concealment strategies on the MOS
4. MODELING & UPPER BOUNDS, CODING ONLY
Figure 2 through Figure 5 show the relationship between the MOS, QP and bitrate for H.264 and MPEG-2. The diagrams suggest linear behavior of the dependent variable MOS. For each figure, two linear models were derived using a least-squares fit. The first model contains only the two parameters for a straight line. In the second fit, the offset, f(SRC), is chosen optimally per SRC. Thus the function has ten parameters in total. This second fit is over-trained yet useful in its indication of trends. These functions are shown in Table 2. For each fitting, the resulting linear correlation and the root mean square error (RMSE) are presented. The RMSE is compensated for the number of degrees of the fitted function. Because there was a small number of data points available, the increase of degrees of freedom for the second fit leads to a poorer RMSE in all cases.
Table 2: Linear Fit for MOS and QP or Bitrate
Linear Approximation (2 or 10 parameters) Corr RMSE H.264 QP MOS= -0.172 QP + 9.249 MOS= -0.172 QP + f(SRC) 0.956 0.981 0.364 0.417 H.264 Bitrate MOS= 2.101 log10(BR) – 10.393 MOS= 3.082 log10(BR) + f(SRC) 0.824 0.963 0.704 0.805 MPEG2 QP MOS= -3.923 log10(QP) +8.181 MOS= -3.923 log10(QP) +f(SRC) 0.916 0.983 0.291 0.353 MPEG2 Bitrate MOS= 1.183 log10(BR) – 4.429 MOS= 3.721 log10(BR) + f(SRC) 0.586 0.954 0.587 0.712
The linear fit with two parameters leads to acceptable results when using the QP value. QP alone explains 91% of the variance of subjective scores for H.264, and 84% for MPEG-22. When using bitrate values instead, the linear fit accuracy drops significantly. The two parameter bitrate model explains only 68% of the variance of subjective scores for H.264 and 34% for MPEG-2. Here, a scene dependent offset seems mandatory in order to reliably predict the perceived quality.
This finding poses a problem for hybrid models analyzing encrypted transmissions. In this situation, only the bitrate is available and no obvious metric exists to predict the scene dependent offset.
Compare the increase in accuracy when moving from the linear fit with two parameters to ten parameters for H.264 and MPEG-2. The greater improvement for MPEG-2 indicates that MPEG-2 has a stronger scene dependent response than H.264. This phenomenon also appears in [13]. The correlation and the RMSE in Table 2 might be considered as upper bounds when validating an objective model that uses the QP or bitrate and eventually performs a content analysis as was analyzed for example in [14]. It should be noted that in this modeling approach many important aspects are missing, e.g. the image size, the frame rate, the influence of transmission distortions, the influence of different coder/decoder implementations. The results are also restricted to the scenario of a fixed QP value and the usage of the encoders and decoders used ([10] and [11]).
5. CONCLUSIONS
An extensive study of representative content transmitted over typical HDTV IPTV systems was conducted. The analysis contained in this paper could help tune an HDTV transmission system. The relationship between the visual quality and the bitrate or the quantization parameter was investigated in a linear model fit with two or ten parameters. The video sequences, MOS and bitstreams will be made freely available for research and development purposes after the VQEG HDTV Final Report is published. We expect that
2 Explained variance is correlation squared.
this dataset could become a valuable tool for designing an objective video quality measurement tool that examines the bitstream and the decoded sequence. Upper bounds on the expected accuracy were given.
REFERENCES
[1] International Telecommunication Union ITU-T. “Technical papers and tutorials,” Objective Perceptual Assessment of Video Quality: Full Reference Television, 2004. Available at
http://www.itu.int/publ/T-TUT-OPAVQ-2004-FRT/en. [2] ITU Study Group 9. 2008, “Final report of VQEG's
multimedia phase I validation test,” TD 923. Available at
http://www.its.bldrdoc.gov/vqeg/projects/multimedia/. [3] ITU-T Study Group 12, Question 14, "Development of
Parametric Models and Tools for Audiovisual and Multimedia Quality Measurement Purposes", http://www.itu.int/ITU-T/studygroups/com12/sg12-q14.html.
[4] G. Cermak, L. Thorpe and M. Pinson, “Test Plan for Evaluation of Video Quality Models for Use With High Definition TV Content,” Video Quality Experts Group
(VQEG), 2009. Available at
http://www.its.bldrdoc.gov/vqeg/projects/hdtv/.
[6] Question ITU-R 211/11, ITU-R BT.500-10 Methodology for the subjective assessment of the quality of television pictures, 1974.
[5] ITU-T Study Group 12, ITU-T P.910 Subjective video quality assessment methods for multimedia applications. 1997. [7] M. Pinson, S. Wolf, N. Tripathi, and C. Koh, “The Consumer
Digital Video Library,” VPQM, Scottsdale, Arizona, USA, 2010.
[8] G. Sullivan and T. Wiegand, "Video Compression - From Concepts to the H.264/AVC Standard," Proceedings of the IEEE, vol.93, no.1, pp.18-31, Jan. 2005. Available at
http://ip.hhi.de/imagecom_G1/assets/pdfs/pieee_sullivan_wie gand_2005.pdf.
[9] Richardson, I.E.G. “Video Codec Design: Developing Image and Video Compression Systems.” John Wiley and Sons Ltd., 2002.
[10] Tourapis, A.M., K. Sühring and G. Sullivan, “H.264/MPEG-4 AVC Reference Software Manual.” Geneva, ISO/IEC JTC1/SC29/WG11 and ITU-T SG16 Q.6, 2007.
[11] FFmpeg project homepage: http://ffmpeg.org.
[12] J. Bialkowski, M. Barkowsky, A. Kaup, "On Requantization in Intra-Frame Video Transcoding with Different Transform Block Sizes", Proc. IEEE Multimedia Sig. Proc. Workshop (MMSP'05), Shanghai, China, Nov. 2005. Available at
http://www.lnt.de/lms/publications/index.php?lang=eng&func tion=0&year=4.
[13] M. Pinson, S. Wolf, and G. Cermak, “HDTV subjective quality of H.264 vs. MPEG-2, With and Without Packet Loss,” to appear in IEEE Transactions on Broadcasting. [14] Stéphane Péchard, Patrick Le Callet, Mathieu Carnec, and
Dominique Barba, “A New Methodology to Estimate the Impact of H.264 Artefacts on Subjective Video Quality,” Proceedings of the Third International Workshop on Video Processing and Quality Metrics, 2007.