HAL Id: hal-02268376
https://hal.archives-ouvertes.fr/hal-02268376
Submitted on 20 Aug 2019
HAL is a multi-disciplinary open access
archive for the deposit and dissemination of
sci-entific research documents, whether they are
pub-lished or not. The documents may come from
teaching and research institutions in France or
abroad, or from public or private research centers.
L’archive ouverte pluridisciplinaire HAL, est
destinée au dépôt et à la diffusion de documents
scientifiques de niveau recherche, publiés ou non,
émanant des établissements d’enseignement et de
recherche français ou étrangers, des laboratoires
publics ou privés.
under Mars-like conditions: experiments and potential
implications for Martian gullies
Clémence Herny, S Conway, Jan Raack, Sabrina Carpy, Tanguy Colleu-Banse,
Manish Patel
To cite this version:
Clémence Herny, S Conway, Jan Raack, Sabrina Carpy, Tanguy Colleu-Banse, et al.. Downslope
sediment transport by boiling liquid water under Mars-like conditions: experiments and potential
implications for Martian gullies. The Geological Society, London, Special Publications, Geological
Society of London, 2019, 467, pp.373-410. �10.1144/SP467.10�. �hal-02268376�
Downslope sediment transport by boiling liquid water under
Mars-like conditions: experiments and potential implications
for Martian gullies
CLÉMENCE HERNY
1*, SUSAN J. CONWAY
2, JAN RAACK
3, SABRINA CARPY
2,
TANGUY COLLEU-BANSE
2& MANISH R. PATEL
3,41
Physikalisches Institut, Universität Bern, Sidlerstrasse 5, 3012 Bern, Switzerland
2Laboratoire de Planétologie et Géodynamique
– UMR CNRS 6112,
Université de Nantes, 2 rue de la Houssinière
– BP 92208, 44322 Nantes Cedex 3, France
3
School of Physical Sciences, Faculty of Science, Technology, Engineering & Mathematics,
The Open University, Walton Hall, Milton Keynes MK7 6AA, UK
4
Space Science and Technology Department, STFC Rutherford Appleton Laboratory,
Harwell Campus, Didcot OX11 0QX, Oxfordshire, UK
*Correspondence:
clemence.herny@space.unibe.ch
Abstract: Gullies are widespread morphological features on Mars for which current changes have been observed. Liquid water has been one of the potential mechanisms to explain their formation and activity. However, under present-day Martian conditions, liquid water is unstable and should only be transiently present in small amounts at the surface. Yet little attention has been paid to the mecha-nisms by which unstable water transports sediment under low atmospheric pressure. Here we present the results of laboratory experiments studying the interaction between liquid waterflowing over a sand bed under Mars-like atmospheric pressure (c. 9 mbar). The experiments were performed in a Mars Simulation Chamber (at the Open University, UK), in which we placed a test bed offine sand at a 25° slope. We chose to investigate the influence of two parameters: the temperature of the water and the temperature of the sand. We performed 27 experiments with nine different com-binations of water and sand temperatures ranging from 278 to 297 K. Under all experimental con-ditions, the water was boiling. We investigated and compared the types and timing of sediment transport events, and the shapes, characteristics and volumes of the resulting morphologies. In agree-ment with previous laboratory studies we found that more intense boiling increased the volume of sediment transported for a given volume of water. We found four main types of sediment transport: entrainment by overlandflow; grain ejection; grain avalanches; and levitation of saturated sand pel-lets. Our results showed that increasing sand temperature was the main driving parameter in increas-ing the sand transport and in modifyincreas-ing the dominant sediment transport mechanism. The temperature of the water played a negligible or minor role, apart from the duration of sand ejection and avalanches, which lasted longer at low water temperature. At low sand temperature the majority of the sand was transported by overlandflow of the liquid water. At higher sand temperatures the transport was dominated by processes triggered by the boiling behaviour of the water. At the highest temperatures, sediment transport was dominated by the formation of levitating pellets, dry ava-lanches and ejection of the sand grains. This resulted in a transport volume about nine times greater at a sand temperature of 297 K compared with 278 K. Our heat transfer scaling shows that the boil-ing behaviour will be enhanced under Martian low gravity, resultboil-ing in more efficient transport of sediment by levitating sand pellets even at temperatures close to the triple point. Our results showed that the boiling intensity played an important role in the physics of sediment transport by liquid water. This implied that the amount of water required to produce morphological changes at the sur-face of Mars could be lower than previously estimated by assuming stable liquid water. Boiling is a critical process to be considered when assessing gully formation and modification mechanisms mobilized by liquid water. Our work could have similar implications for any water-formed landform on Mars, which could include recurring slope lineae, dark duneflows and slope streaks. Supplementary material:Videos of the experiments are available athttps://doi.org/10.6084/m9. figshare.c.3990330
Gold Open Access:This article is published under the terms of theCC-BY 3.0 license.
From: CONWAY, S. J., CARRIVICK, J. L., CARLING, P. A.,DEHAAS, T. & HARRISON, T. N. (eds) Martian Gullies and their Earth Analogues. Geological Society, London, Special Publications, 467,
https://doi.org/10.1144/SP467.10
© 2018 The Author(s). Published by The Geological Society of London. Publishing disclaimer:http://www.geolsoc.org.uk/pub_ethics
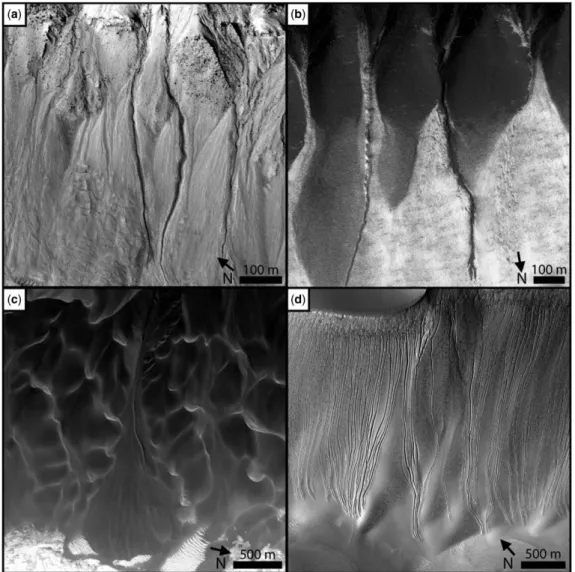
Activeflow processes are currently ongoing at the surface of Mars and have been revealed through mon-itoring campaigns using high-resolution images of landforms such as gullies (Fig. 1; e.g.Malin & Edgett
2000;Costard et al. 2002;Mangold et al. 2003;Reiss
& Jaumann 2003;Védie et al. 2008;Diniega et al.
2010,2013;Dundas et al. 2010,2012,2015;Reiss
et al. 2010; Jouannic et al. 2015;this volume, in
review;Raack et al. 2015;Pasquon et al. 2016;this
volume, in review). The physical processes involved
in the formation of gullies and their present-day activ-ity have not been unambiguously identified and are
still under debate. Among the proposed mechanisms (see the section‘Gullies on Mars’), liquid water is a strong candidatefluid.
Gullies closely resemble those formed by liquid water on Earth (e.g.Hartmann et al. 2003;Marchant
& Head 2007), hence the equivalent features on Mars
are often considered as an indicator of recent or cur-rent liquid water on the surface (e.g.Malin & Edgett
2000;Heldmann & Mellon 2004;Conway & Balme
2016). Although the morphology of these landforms is consistent with their terrestrial counterparts there remain numerous problems for the water hypothesis
Fig. 1. Examples of mass wasting features for which current activity has been observed. (a) New classical gully incision (HiRISE ESP_014093_1410). (b) New deposition and darkflows within a classical gully (HiRISE ESP_012332_1115). (c) Formation/modification of dune gullies (HiRISE ESP_013478_1300). (d) Formation and growth of linear dune gullies (HiRISE PSP_007018_1255).
driving recent activity: (1) liquid water is unstable and can only be produced in limited amounts (e.g.
Ingersoll 1970; Haberle et al. 2001;Hecht 2002;
Richardson & Mischna 2005; Sears & Moore
2005); (2) ongoing activity is recorded at locations and at times of year when the temperature is below the melting point of water (e.g. Diniega et al.
2010;Dundas et al. 2012;Raack et al. 2015;
Pas-quon et al. this volume, in review); (3)
volumetri-cally limited water sources (atmospheric humidity and/or perched topographic aquifers) cannot explain the large numbers of observed features (e.g.Balme
et al. 2006; Kneissl et al. 2010; Harrison et al.
2015) or the physical extent of the landforms observed (e.g.Dundas et al. 2010,2015).
Therefore water-based theories have difficulties explaining the source and amount of water required to create and/or modify these metre- to kilometre-scale geomorphological features. Estimations of the volumes of water required to produce the observed changes on Mars are often based on a ter-restrial understanding of the behaviour and transport capacity of stable water (Heldmann et al. 2005;
Pel-letier et al. 2008; Kolb et al. 2010; Parsons &
Nimmo 2010). However, recently, Martian-like
pressure experiments have highlighted the unusual behaviour of boiling water in sediment transport physics (Massé et al. 2016; Raack et al. 2017). Boiling of liquid water is thought to occur on Mars as the surface temperatures can locally and tempo-rarily exceed the saturation temperature for the atmospheric pressure (Haberle et al. 2001;Reiss &
Jaumann 2003; Fenton 2006;Martín-Torres et al.
2015). Despite the fact that boiling is likely under present-day conditions, this process has been overlooked to date when liquid water has been pro-posed as an agent of present-day surface changes. Neglecting the effects of boiling could lead to a bias estimation of the required amount of water involved in mass wasting features and some current activities.
The aim of the paper is to investigate the trans-port capacity of sediment by liquid water under Martian-like surface conditions. This subject has received only limited experimental investigation so far (see the section‘Previous experimental investiga-tions’), although it can potentially be of primary importance for the understanding and interpretation of water-driven processes and present-day surface activity on Mars. Hence, we conducted a series of experiments under low pressure to study the in flu-ence of boiling intensity on sediment transport. The experimental observations are then compared with physical laws in order to understand the impor-tant parameters driving the sediment transport by unstable water. Finally, we performed scaling to Martian gravity, in order to apply our results to Martian features.
State of art
Stability of liquid water at the surface of Mars
Climate models, experimental investigations and remote sensing data have shown that only transient and restricted amounts of water canflow on present-day Mars because it is highly unstable owing to low pressure and a dry atmosphere (e.g.Ingersoll 1970;
Kieffer et al. 1977; Haberle et al. 2001; Lobitz
et al. 2001;Smith et al. 2001;Hecht 2002;
Richard-son & WilRichard-son 2002;Kossacki & Markiewicz 2004;
Richardson & Mischna 2005; Sears & Moore
2005;Chevrier et al. 2009;Reiss et al. 2010;
McE-wen et al. 2011, 2014; Grimm et al. 2014; Ojha
et al. 2015; Stillman et al. 2016; Martín-Torres
et al. 2015). The range of temperatures over which
liquid water is stable is narrow, from about 274 to 281 K (Wagner et al. 2011) for an atmospheric pres-sure range between 6.5 and 10 mbar on Mars (Hess
et al. 1980; Hourdin et al. 1995; Haberle et al.
2001). Therefore, if the surface temperature reaches or exceeds the melting temperature (T0> 273 K at P > 610 Pa, above the triple point) then water poten-tially boils shortly afterwards. Surface temperatures on Mars can locally exceed 285 K (Haberle et al.
2001;Reiss & Jaumann 2003;Fenton 2006;
McE-wen et al. 2014;Martín-Torres et al. 2015) and
there-fore potentially exceed both the melting and boiling points. Boiling is a complex process that increases the rate of phase change compared with evaporation and results in a decreased lifetime of liquid water. Vapour bubbles start to nucleate at the solid–liquid interface according to the surface tension. Formation of gas bubbles is favoured when the surface tension increases as the atmospheric pressure and tempera-ture of the liquid–gas interface decrease (Cengel &
Ghajar 2014;Giraud et al. 2015). Surface roughness
also favours bubble formation, because it creates nucleation sites required for bubble initiation. Any waterflowing on Mars would encounter rough sedi-ments and rocks, which would encourage boiling.
The range of conditions allowing liquid water can be broadened if dissolved salts (brines) are consid-ered as the presence of salts depressing the melting point and evaporation rate (Brass 1980; Sears &
Chittenden 2005; Möhlmann & Kereszturi 2010;
Masterton & Hurley 2011; Nuding et al. 2015).
Although evaporation has been considered in previ-ous studies of waterflow at the Martian surface (e.g.
Heldmann et al. 2005), the physical effects of boiling
are usually not taken into account.
Gullies on Mars
Gullies on Mars (Fig. 1) are one of the most common mass wasting features and werefirst identified by
divided into three types: (1) ‘classical gullies’
(Fig. 1a, b; e.g.Malin & Edgett 2000;2006;Balme
et al. 2006; Dickson et al. 2007; Dundas et al.
2010, 2012, 2015, 2018; Harrison et al. 2015;
Raack et al. 2015;Conway et al. 2015,2018); (2)
‘dune gullies’ (Fig. 1c; e.g. Diniega et al. 2010;
Hansen et al. 2011, 2013; Dundas et al. 2012,
2015;Harrison et al. 2015); and (3)‘linear dune
gul-lies’ (Fig. 1d; e.g.Costard et al. 2002;Mangold et al.
2003;Reiss & Jaumann 2003;Védie et al. 2008;
Reiss et al. 2010;Dundas et al. 2012;Diniega et al.
2013;Jouannic et al. 2015;Pasquon et al. 2016).
Several mechanisms have been proposed to explain their formation and current activity: (1) liq-uid groundwater release (e.g. Malin & Edgett
2000;Gaidos 2001;Mellon & Phillips 2001;
Gil-more & Phillips 2002;Heldmann & Mellon 2004;
Heldmann et al. 2005, 2007;Malin et al. 2006);
(2) melting of near-surface snow or ice in a warmer recent past (e.g. Costard et al. 2002; Arfstrom &
Hartmann 2005; Berman et al. 2005;Head et al.
2008;Védie et al. 2008;Schon et al. 2009;Williams
et al. 2009;Kneissl et al. 2010;Raack et al. 2012;
Jouannic et al. 2015); (3) melting of surface snow
or ice under current climatic conditions (Christensen
2003;Head et al. 2008); (4) CO2-supported flows
(e.g. Hoffman 2000, 2002; Musselwhite et al.
2001; Stewart & Nimmo 2002; Ishii & Sasaki
2004;Hugenholtz 2008;Di Achille et al. 2008;
Dun-das et al. 2010, 2012; Cedillo-Flores et al. 2011;
Hansen et al. 2011;Diniega et al. 2013;Pilorget &
Forget 2015;Raack et al. 2015); and (5) dry granular
flows (e.g.Treiman 2003;Shinbrot et al. 2004;
Pel-letier et al. 2008;Kolb et al. 2010). So far none of the
proposed mechanisms is able to completely explain all their morphological features, their distribution and their present-day activity.
As mentioned in the previous section‘Stability of liquid water at the surface of Mars’, surface tempera-ture can currently exceed the melting point and poten-tially the boiling point at the surface of Mars. These conditions occur mainly on equator-facing slopes sit-uated on the walls and/or dunes fields of Valles Mar-ineris, and in low topographic basins, pits and craters (where the pressure is higher) from 45° N to 70° S. Within these latitudes active linear dune gullies (e.g.Mangold et al. 2003;Reiss & Jaumann 2003;
Miyamoto et al. 2004;Reiss et al. 2010;Jouannic
et al.2012) and very recent classical gullies (e.g.
Reiss et al. 2004;Raack et al. 2012) can be found,
which strengthens the case for an involvement of liq-uid water. Therefore despite its instability, liqliq-uid waterflows remain a strong candidate for the forma-tion of gullies in the past and present (e.g.Malin &
Edgett 2000;Mangold et al. 2003,2010;Reiss &
Jau-mann 2003;Miyamoto et al. 2004;Heldmann et al.
2005;Mushkin et al. 2010;Reiss et al. 2010;Conway
et al. 2015;Conway & Balme 2016).
Previous experimental investigations
Only a few experiments have been performed which study the transport of sediments by liquid water under low pressure. In these experiments, landforms were created by liquid waterflowing over an inclined sediment surface under Martian pressure rather than under terrestrial pressure (Conway et al. 2011;
Jouannic et al. 2015; Massé et al. 2016; Raack
et al. 2017). These experiments reveal that at low
pressures sand temperature plays a crucial role in the development of landforms and the process of sediment transport by unstable water.
Experiments led byConway et al. (2011)at Mar-tian and terrestrial pressures have shown that water flow over frozen dry sediments (c. 273 K) has a greater runoff length and erosion rate than at higher temperatures owing to the formation of ice lenses. This inhibits water infiltration, liberating more water to transport sediment and leading to a longer and a fasterflow (Conway et al. 2011). If the sub-strate is already wet and frozen, the liquid water does not infiltrate at all (Jouannic et al. 2015). In this case the resulting debris flow morphologies formed during experiments under Martian and ter-restrial pressures are more comparable. For both of these experiments (Conway et al. 2011;Jouannic
et al. 2015) simultaneous freezing and boiling of
theflowing water was observed. Recently, experi-ments under Martian pressures with a relatively warm substrate (≥288 K) have revealed new trans-portation mechanisms involving both wet and dry processes (Massé et al. 2016;Raack et al. 2017). (1) The melting of an ice block at the top of a sand bed between 288 and 293 K and under Martian pres-sure releases liquid water. Massé et al. (2016)
described for thefirst time how boiling water pro-vokes ejection of sand particles while the liquid flow percolates downslope. The combination of these transport mechanisms triggers the formation of arcuate sand ridges perpendicular to the flow direction and dry sand avalanches. For similar con-figuration, but at terrestrial pressure, only water per-colation is observed without sediment transport
(Massé et al. 2016). (2)Raack et al. (2017)described
another newflow processes associated with boiling water. The interaction between boiling water and warm sediment (Ts≈ 297 K) triggered the formation of wet sand pellets that levitate and travel downslope carving an ephemeral sinuous transportation chan-nel. This unusual transport mechanism occurs in par-allel with sand ejection, dry sand avalanches, overlandflow and infiltration. These previous exper-iments (Massé et al. 2016;Raack et al. 2017) demon-strated that boiling liquid water has a much larger sediment transport capacity than stable liquid water. All of these experiments have shown that unstable water can have unexpected effects on the
behaviour of a sediment-laden flow, in terms of sediment transport mechanisms, morphologies and dynamics. In particular they demonstrate that under specific environmental conditions (low pressure, warm sediment) less liquid water is needed to trans-port sediment compared with under‘normal’ terres-trial conditions. These results emphasize that the stability of water needs to be taken into account for orbital data interpretation, scaling laws and numeri-cal modelling of active (and potentially past) water-based Martian surface processes.
The experiments presented here also investigate the role of boiling intensity in the formation of mass wasting morphologies produced by liquid waterflow over a sediment bed at Martian pressure. Among the many potential controlling parameters (atmospheric pressure, water vapour partial pressure, temperature, gravity), we chose to study two of them: (1) the water temperature; and (2) the sand temperature. These two parameters were chosen respectively because the water temperature plays a role in boiling during phreomagmatic eruptions and geysers (Lorenz 2002) and the sand temperature is thought to drive the boiling intensity at a given pres-sure (Cengel & Ghajar 2014). The range of temper-atures (from 278 to 297 K), for both water and sand, is consistent with a minimum value that allows water boiling at a chosen pressure and a maximum value close to the maximum temperatures measured at the surface of Mars. Experiments previously pre-sented byRaack et al. (2017)showed that, at a cons-tant water temperature, an increase in the sand temperature of less than 20 K strongly intensified the physical processes and increased sediment trans-port by a factor of c. 9. The influence of water tem-perature has not yet been investigated. To evaluate the respective importance of the water and sand tem-perature in the interaction of unstable water with loose sediment we performed a systematic explora-tion of both these temperature parameters.
Methods
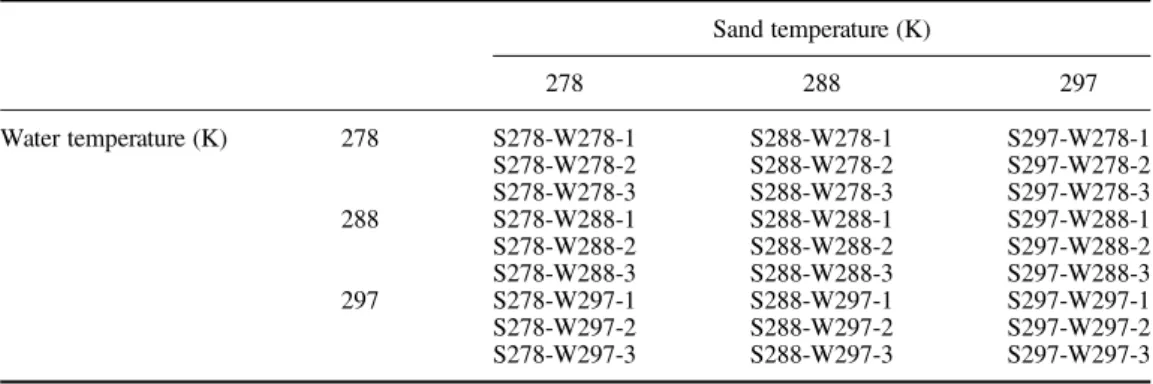
We performed experiments using nine different combinations of water and sand temperatures in trip-licate for a total of 27 experiments. The experimental procedure is similar to those presented by Raack
et al. (2017), whose experimental results are also
included in this work. An overview of the tempera-ture conditions used in the experiments are presented
inTable 1.
Experimental set-up and instrumentation
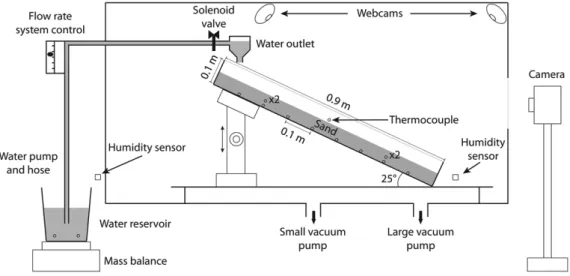
The experiments were performed under Martian-like pressure in a cylindrical low pressure chamber, 2 m in length and 0.9 m in diameter (Fig. 2) at the Open University (Mars Simulation Chamber facility – MSC). The air inside the chamber was evacuated by two vacuums pumps and pressure was recorded every second by a pressure sensor (Pirani gauge). We started each experiment when a pressure of c. 7 mbar was reached. Owing to the production of water vapour inside the chamber as the liquid water was introduced the total pressure increased until it reached a constant value close to an average value. The average pressure for all experiments during the 60 s of waterflow were 9.6 mbar, which is within the range of possible pressures on Mars (between 6.5 and 10 mbar;Hess et al. 1980;Hourdin
et al. 1995;Haberle et al. 2001).
The test bed was placed in a rectangular metallic tray (0.9 m long, 0.4 m wide and 0.1 m deep), which was then set inside the MSC at an angle of 25° (Figs 2b&3). This angle was chosen close to the slope val-ues observed in the source areas of classical gullies
(Pouliquen 1999;Heldmann & Mellon 2004;
Dick-son et al. 2007; Pelletier et al. 2008; Parsons &
Nimmo 2010; Conway et al. 2015). The chosen
25° slope also falls between the slightly shallower slopes of active polar gullies (dark flows within
Table 1. Overview of water and sand temperature configurations for the performed experimental runs including
run identifiers used in the rest of this paper
Sand temperature (K) 278 288 297 Water temperature (K) 278 S278-W278-1 S288-W278-1 S297-W278-1 S278-W278-2 S288-W278-2 S297-W278-2 S278-W278-3 S288-W278-3 S297-W278-3 288 S278-W288-1 S288-W288-1 S297-W288-1 S278-W288-2 S288-W288-2 S297-W288-2 S278-W288-3 S288-W288-3 S297-W288-3 297 S278-W297-1 S288-W297-1 S297-W297-1 S278-W297-2 S288-W297-2 S297-W297-2 S278-W297-3 S288-W297-3 S297-W297-3
existing gullies at c. 15°;Raack et al. 2015) and of active linear dune gullies (c. 10–20°; Reiss et al.
2010; Pasquon et al. 2016) and the steep slopes
around 28–35° of active Recurring Slope Lineae
(McEwen et al. 2011;Ojha et al. 2014; Stillman
et al. 2014, 2016). Furthermore, this angle is less
than the angle of repose of the sand on both Earth and Mars (Kleinhans et al. 2011;Atwood-Stone &
McEwen 2013), which means that the sediments
do not fail with slight vibrations/perturbations. The tray contains black lines at 5 cm from its base and perpendicular lines every 10 cm on the side walls to assist in levelling the sand and to calibrate dis-tances along the tray observed in images/videos.
All of the experiments were performed with a natural aeolianfine silica sand (modal diameter of the grains D50= 2.3 × 10⁻⁴m and minor components of clay and silt), which was also used in previous experi-ments in the MSC at the Open University (Conway
et al. 2011; Jouannic et al. 2015; Massé et al.
2016;Raack et al. 2017). This sediment is a
reason-able analogue for loose sediments on Mars because its grain size is intermediate between coarser sand grains of most Martian dunes (e.g. coarser than c. 210 μm with a mean of larger than c. 430 μm;Edgett
& Christensen 1991) andfiner material observed in
the ripple troughs of Bagnold dunes at Gale Crater (e.g. c. 150 μm;Bridges et al. 2017;Lapotre et al.
Fig. 2. Mars Simulation Chamber (MSC) at the Open University (Milton Keynes, UK). The chamber is 2 m in length and 0.9 m in diameter. (a) Exterior view of the MSC. (b) Interior view of the MSC with relevant experimental apparatus labelled. Note: the sand has been removed for this photograph.
Fig. 3. Diagram of the experimental set-up. The black circles indicate the position of the thermocouples (TC). The ‘×2’ label indicates that there are two thermocouples at different horizontal positions on the tray. These
thermocouples are placed at 10 cm from the right and left border of the tray, respectively. C. HERNY ET AL.
2017;Johnson et al. 2017). We used a sediment bed of c. 5 cm thickness to have a sufficient thickness of sediment so that the base of the tray would not be exposed by theflow and hence would not influence sediment transport. To set the test bed to the desired temperature, the sand was, as necessary, pre-chilled in a freezer.
The water outlet inside the MSC was placed at the top and in the centre of the test bed (c. 8 cm from the upper edge), 1.5 cm above the sediment surface, which was used for practical reasons: this height was the minimum height we could use without dis-rupting the trajectory of the ejected sediment. A res-ervoir of liquid water was placed outside of the chamber at a controlled temperature. The water was transported from the reservoir via a hose and a pump which was used to maintain back-pressure on the solenoid valve. The solenoid valve was controlled from outside the MSC with a switch
(Fig. 3). The flow rate was chosen to be around
11 ml s−1, an intermediate rate between former comparable experiments by Conway et al. (2011)
(c. 80 ml s−1) andMassé et al. (2016)(c. 1–5 ml s−1) and to minimize possible boundary effects (i.e. con-tact with the tray edges) under boiling conditions when erosion rates were high.
Temperature was monitored every second by 15 thermocouples (TCs) within and above the sand bed and in the water reservoir (Figs 2& 3) with the following three configurations:
(1) Eight TCs on thefloor of the tray along the cen-treline. The TCs were placed at 10 cm intervals and were then covered by sand. These TCs monitor the temperature at the interface between the metallic tray and the base of the sand bed.
(2) Four TCs placed at a 2 cm height within the sand bed. The support pillars were located at each corner of the test bed with distances of about 20 cm from the top and bottom and c. 8 cm from the lateral edges of the test bed
(Fig. 2b). We used the average value of these
four TCs to determine the average sand temperature.
(3) One TC placed just above the sand surface (c. 1 cm) at the centre of the right edge of the tray in order to measure air temperature close to the test bed. Furthermore, two other TCs were placed inside the water reservoir, to monitor the water temperature during the experiments. We used two humidity sensors inside and outside the MSC respectively to monitor every 2 s the water vapour content (Fig. 3). Finally every experimental run was recorded with three cameras (Fig. 3): two webcams were placed in the interior of the MSC to record the front and the rear of each experiment, respectively, and one digital camera was placed
outside of the chamber facing the tray through a glass window.
Experimental protocol
The sand, pre-cooled as necessary, was placed in the tilted tray inside the MSC and levelled. The test bed was photographed (at least 40 photos) using multiple observation angles in order to construct a high-resolution orthoimage and digital elevation model (DEM) of the surface by photogrammetry (see the section ‘Mapping and quantification’). After this procedure, the MSC was evacuated. The experiment was started when the pressure reached c. 7 mbar and when the temperatures of the water and the sediment were at the desired values.
The solenoid valve was thereafter opened and the flow rate immediately adjusted so that the flow was as consistent as possible between experiments. The flow rate for experiments at Martian pressure was therefore set at a value around 11 ml s−1(Table 3). The duration of the waterflow was 60 s, leading to a total released volume of water between 610 and 690 ml (Table 3). After the end of the waterflow the MSC was held at low pressure to observe the con-tinuing infiltration of the water under realistic condi-tions. Then the MSC wasfinally decompressed and the test bed was photographed again with the same method as described above. Additional photos of interesting features were acquired at the surface of the test bed and of vertical sections. The cross-sections were cut manually perpendicular to the slope direction. In order to not erase sedimentary structures within the vertical section, the sand was gently removed starting from the bottom of the tray and sections through the saturated material were broken off manually. Depending on the length of the saturated section we made between one and four vertical cross-sections.
Results
General observations
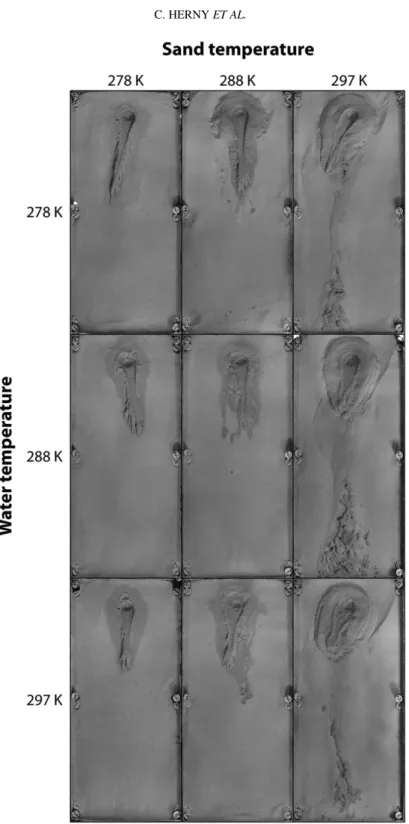
Tables 2and3provides a summary of all parameters
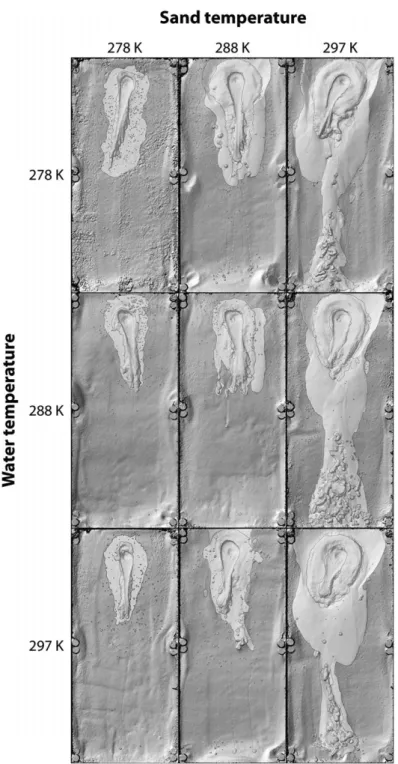
measured and results obtained for the experiments performed in this study. Representative examples of final surface morphologies of each sediment– water temperature combination are shown in
Figure 4.
Videos recorded by the three cameras were care-fully analysed in order to identify the physical pro-cesses, their timing and duration for any given experiment. We identified six distinct sediment transport processes that are detailed below. An over-view of these event timings is given inFigure 5and a quick description of the terminology used and the measurements performed are presented inTable 2.
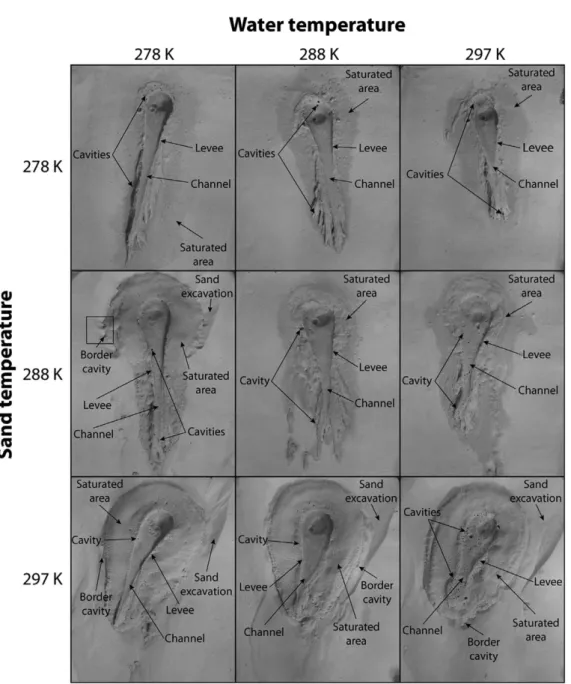
Our results show that there are some physical events and processes that are common to all experiments and hence the resulting sand beds share similar surface features. For different combinations of sediment–water temperatures we also observed physical processes and morphological features specific to these combinations and these will be described in the sections‘Morphological differences observed as a function of sand temperature’ and ‘Morphological differences observed as a function of water temperature’.
For all of the experiments, we observed that the water boiled and persisted for enough time toflow over the surface and percolate into the sand. We made the following important observations: (1) Once the sand was saturated close to the water
outlet, we observed the formation of a feature created by overlandflow of the boiling water
(Figs 4, 5& 6b, Supplementary videos 1, 2,
3, 4 and 5). The sand was eroded upslope by the water with the formation of an alcove, then transported by the waterflow forming a channel that was still apparent at the end of the run, hence the name‘persistent channel’, and accumulation occurred downslope (Fig. 6b). Small levees flanked these channels
(Figs 6b, c & 7). Sediment transport and
accumulation occurred through the deposition of a series of distinct sand lobes that extended incrementally downslope. The lobes gener-ally superposed one another and sometimes
migrated laterally through time (Figs 6b &
7). The beginning of this‘overland flow fea-ture process’ was defined from the moment when the alcove at the top started to form and ended with the last observed deposition of sand transported by the water flow. The presence of cavities (around 2 mm) was observed in the persistent channel post-experiment (Figs 6c & 7), and those visible at the surface of the sand resulted from the burst of gas bubbles (Supplementary video 6). Cavities observed inside the channel are inferred to form by the same process. We found that it was quite common that a cav-ity is present at the end of a sand lobe, since the burst of the gas bubble seemed to stop the sand deposition (Fig. 6b). The construc-tion of this channel-feature ceased synchro-nously with the end of the water release
(Fig. 5).
(2) During all the experiments we observed the formation and the ejection of pellets from the water source area (Figs 5,6a&8, Supplemen-tary videos 1–5). These pellets were saturated bodies of sediment. Their sizes range from about 0.5 to 60 mm with rounded and/or irreg-ular shapes, and were observed to form when the boiling water interacted with the dry sand. The pellets slide and/or rolled down-slope over the surface of the test bed and some-times left a track in the loose sand (Fig. 6a). We defined this event as starting when the water
Table 2. Definition and related observations, measurements and analyses performed for different physical
processes identified in experiments
Physical process Definition of process Measurements, analyses and observations
Overlandflow Direct sediment transportation by
liquid waterflow
Mapping; Volumes of transported material; Length
and width offlow feature; Description of
morphology of overlandflow feature (including
cross sections); Formation speed of overlandflow
Ejection of pellets Saturated bodies of sediment roll/
levitate over the surface
Mapping; Volumes of transported material; Duration of pellet production; Size, speed and trajectory of pellets; Description of morphology of pellets; Modelling of pellet levitation at terrestrial and Martian gravity; Calculations of gas production rate
Dry sand avalanches Transportation of sediment
without involvement of liquid
Mapping; Volume of transported material; Duration of dry avalanches
Percolation Transportation, transformation and
wetting of the surface by liquid water
Mapping; Volume of transported material and changes topographic relief; Description of texture and morphology of wet sand body (including cross-sections)
Sand ejection Ejection of sand grain Determination of grain ejection occurrence with
videos; Duration of grain ejection; Modelling of
sand grain ejection by gasflow at terrestrial and
Martian gravity; Determination sand grain trajectory from high speed camera C. HERNY ET AL.
T able 3. Summary of experimental par ameters, measur ements and calcula tions Run A v er age san d temper atur e (K ± SD) A v er age w ater temper atur e (K ± SD) A v er age air temper atur e (K ± SD) A v er age pr essur e (mbar ± SD) RH (% ± SD) W ater fl ow amount (ml ± 5 ml ) W ater fl ow rat e (ml s − 1) T otal tr ansported v olume (cm 3) Details of tr ans ported v olume (cm 3) Runoff length (cm ± 0.5 cm) Runoff width (cm ± 0.5 cm) W ater vapour density ρ (kg m − 3) Thr eshold v elocity Ut (m s − 1) Δ Pmin (Pa) Ejection velocity Ue (m s − 1) Ov erland flow P ellets Dry avalan ches / salta tion P er cola tion S278-W278-1 278.5 ± 0.1 278.9 ± 0.1 285.5 ± 0.4 8.2 ± 0.5 22.5 ± 2.4 625 10.4 ± 0.4 86.1 ± 27.1 75.0 ± 7.6 0.6 ± 1.0 0.0 10.6 ± 18.4 38.1 7.6 6.9 × 1 0 − 3 6.3 73.4 0.01 S278-W278-2 278.5 ± 0.1 278.5 ± < 0.1 286.8 ± 0.1 8.4 ± 0.8 21.0 ± 3.5 670 11.2 ± 0.5 85.4 ± 20.3 71.1 ± 6.6 0.7 ± 0.9 0.0 13.7 ± 12.8 33.9 9.2 6.9 × 1 0 − 3 6.3 53.4 0.01 S278-W278-3 278.4 ± 0.1 278.7 ± < 0.1 286.1 ± 0.7 8.8 ± 0.7 – 665 11.1 ± 0.5 79.9 ± 7.1 72.7 ± 3.2 0.4 ± 0.2 0.0 6.8 ± 3.7 37.6 10.6 6.9 × 1 0 − 3 6.3 7.2 0.00 S288-W278-1 288.4 ± 0.1 278.4 ± < 0.1 292.8 ± 0.1 9.4 ± 1.4 18.3 ± 5.0 660 11.0 ± 0.5 446.7 ± 8.9 48.4 ± 4.7 35.9 ± 28.0 190.1 ± 28.0 172.3 ± 3.5 35.2 8.7 1.3 × 1 0 − 3 6.0 791.6 0.22 S288-W278-2 288.4 ± 0.1 278.6 ± < 0.1 293.2 ± 0.5 10.0 ± 0.9 16.8 ± 4.7 655 10.9 ± 0.4 379.4 ± 11.7 45.4 ± 4.3 25.2 ± 20.2 168.2 ± 20.2 140.5 ± 4.3 34.7 7.0 1.3 × 1 0 − 2 6.0 731.6 0.20 S288-W278-3 288.1 ± 0.1 278.6 ± < 0.1 292.9 ± 0.1 9.3 ± 1.0 16.2 ± 5.0 650 10.8 ± 0.4 366.0 ± 7.8 47.5 ± 4.6 34.5 ± 20.4 177.2 ± 20.4 106.8 ± 2.4 34.4 7.2 1.3 × 1 0 − 2 6.0 768.5 0.21 S297-W278-1 296.5 ± 0.1 278.5 ± < 0.1 296.5 ± < 0.1 9.8 ± 1.1 – 620 10.3 ± 0.4 566.2 ± 25.5 25.8 ± 3.4 22.1 ± 15.2 292.4 ± 15.2 225.9 ± 8.4 26.1 7.8 2.1 × 1 0 − 2 5.7 1888.2 0.66 S297-W278-2 297.4 ± 0.1 278.7 ± < 0.1 297.4 < 0.1 8.7 ± 2.0 – 630 10.5 ± 0.4 806.6 ± 9.0 27.1 ± 3.1 96.3 ± 14.4 461.0 ± 14.4 222.2 ± 2.1 26.4 6.9 2.2 × 1 0 − 2 5.7 2157.8 0.77 S297-W278-3 296.4 ± < 0.1 278.4 ± < 0.1 295.6 ± 0.3 10.5 ± 1.5 20.8 ± 6.5 625 10.4 ± 0.4 846.9 ± 21.7 39.7 ± 3.2 86.8 ± 14.0 499.7 ± 14.0 220.7 ± 5.4 32.0 7.5 2.1 × 1 0 − 2 5.7 1800.9 0.63 S278-W288-1 276.8 ± 0.1 288.1 ± < 0.1 284.9 ± 0.2 8.9 ± 0.5 23.7 ± 5.2 –– 58.7 ± 2.6 48.4 ± 1.1 0.3 ± 0.1 0.0 9.9 ± 1.4 27.6 10.5 6.2 × 1 0 − 3 6.3 − 96.9 – S278-W288-2 278.2 ± 0.1 288.3 ± < 0.1 286.7 ± 0.1 8.8 ± 1.0 24.1 ± 6.6 670 11.2 ± 0.5 87.9 ± 12.8 76.8 ± 5.0 1.0 ± 0.6 0.0 10.2 ± 7.2 31.9 8.1 6.8 × 1 0 − 3 6.3 − 5.1 – S278-W288-3 278.4 ± 0.1 288.4 ± < 0.1 286.3 ± 0.1 -24.1 ± 6.9 650 10.8 ± 0.4 78.9 ± 27.4 68.5 ± 11.9 0.9 ± 1.3 0.0 9.5 ± 14.2 33.0 10.3 6.9 × 1 0 − 3 6.3 –– S288-W288-1 285.7 ± 0.1 288.2 ± 0.1 291.3 ± 0.1 9.5 ± 1.3 21.6 ± 6.5 650 10.8 ± 0.4 92.8 ± 7.7 29.4 ± 6.5 15.7 ± 10.5 32.4 ± 10.5 15.3 ± 3.4 29.1 9.0 1.1 × 1 0 − 2 6.1 503.0 0.13 S288-W288-2 288.9 ± 0.1 288.4 ± < 0.1 292.5 ± 0.1 10.0 ± 1.4 25.0 ± 8.2 660 11.0 ± 0.5 240.2 ± 42.9 40.2 ± 5.4 17.3 ± 10.7 121.8 ± 10.7 60.9 ± 13.6 27.7 7.4 1.3 × 1 0 − 2 6.0 788.0 0.22 S288-W288-3 288.1 ± 0.1 288.5 ± < 0.1 291.1 ± 0.1 9.7 ± 0.8 27.1 ± 7.2 665 11.1 ± 0.5 109.8 ± 34.1 50.7 ± 9.7 12.8 ± 8.7 18.5 ± 8.7 27.9 ± 16.3 33.5 8.6 1.3 × 1 0 − 2 6.0 728.5 0.20 S297-W288-1 296.0 ± 0.1 288.3 ± < 0.1 295.7 ± 0.2 10.1 ± 1.2 28.5 ± 9.3 660 11.0 ± 0.5 1011.5 ± 8.8 24.5 ± 5.2 204.2 ± 28.6 489.9 ± 28.6 293.0 ± 2.1 23.0 8.8 2.0 × 1 0 − 2 5.7 1772.7 0.61 S297-W288-2 296.1 ± 0.1 288.1 ± < 0.1 296.2 ± 0.2 9.7 ± 1.7 27.0 ± 8.3 670 11.2 ± 0.5 899.7 ± 17.5 26.9 ± 5.5 111.3 ± 17.7 551.6 ± 17.7 209.9 ± 3.9 22.0 8.7 2.0 × 1 0 − 2 5.7 1829.6 0.63 S297-W288-3 297.9 ± 0.1 288.4 ± < 0.1 298.2 ± 0.1 10.6 ± 1.7 26.2 ± 6.5 610 10.2 ± 0.4 1048.4 ± 8.5 21.2 ± 5.0 226.3 ± 30.2 528.5 ± 30.2 272.5 ± 1.7 20.8 8.3 2.3 × 1 0 − 2 5.7 2059.8 0.75 S278-W297-1 280.3 ± 0.1 296.3 ± < 0.1 287.9 ± 0.3 8.6 ± 1.6 28.1 ± 6.6 670 11.2 ± 0.5 74.7 ± 6.9 57.8 ± 2.4 0.7 ± 0.2 2.2 ± 0.3 14.0 ± 3.9 27.8 10.9 7.8 × 1 0 − 3 6.2 151.6 0.03 S278-W297-2 278.8 ± 0.1 295.8 ± < 0.1 286.0 ± 0.3 8.7 ± 1.2 29.2 ± 7.6 655 10.9 ± 0.4 72.2 ± 35.9 61.3 ± 14.3 0.7 ± 1.2 4.7 ± 3.8 5.4 ± 16.6 32.2 10.0 7.1 × 1 0 − 3 6.3 42.2 0.00 S278-W297-3 277.8 ± 0.2 297.4 ± < 0.1 285.5 ± 0.4 8.7 ± 0.9 32.4 ± 6.1 660 11.0 ± 0.5 57.5 ± 3.4 49.3 ± 1.1 0.3 ± 0.1 0.0 7.9 ± 2.1 29.8 7.5 6.6 × 1 0 − 3 6.3 − 19.2 – S288-W297-1 288.2 ± 0.1 296.4 ± < 0.1 291.6 ± 0.2 10.1 ± 1.0 32.7 ± 11.2 660 11.0 ± 0.5 133.2 ± 29.9 43.9 ± 6.8 12.2 ± 7.7 21.3 ± 7.7 55.8 ± 16.5 30.2 7.3 1.3 × 1 0 − 2 6.0 699.4 0.19 S288-W297-2 288.4 ± 0.1 296.3 ± < 0.1 292.5 ± 0.2 10.2 ± 1.5 29.5 ± 10.4 645 10.8 ± 0.4 173.6 ± 9.0 51.0 ± 7.7 15.2 ± 8.1 36.5 ± 8.1 70.9 ± 4.6 31.9 8.8 1.3 × 1 0 − 2 6.0 711.6 0.20 S288-W297-3 288.5 ± 0.1 296.4 ± < 0.1 293.1 ± 0.2 10.9 ± 1.2 26.1 ± 9.8 650 10.8 ± 0.4 162.8 ± 3.7 41.3 ± 6.5 19.4 ± 11.8 27.3 ± 11.8 74.8 ± 2.4 29.8 8.8 1.3 × 1 0 − 2 6.0 652.7 0.18 S297-W297-1 298.6 ± 0.1 301.7 ± < 0.1 300.4 ± 0.6 –– 690 11.5 ± 0.5 815.3 ± 26.0 24.0 ± 5.6 131.0 ± 21.5 393.5 ± 21.5 266.8 ± 6.9 21.6 8.2 2.4 × 1 0 − 2 –– – S297-W297-2 296.7 ± 0.1 296.6 ± < 0.1 296.6 ± 0.1 11.1 ± 1.7 28.0 ± 12.5 680 11.3 ± 0.5 649.1 ± 6.7 29.7 ± 5.1 46.2 ± 18.4 351.9 ± 18.4 221.3 ± 2.0 24.1 6.8 2.1 × 1 0 − 2 5.7 1793.0 0.80 S297-W297-3 297.8 ± 0.1 298.0 ± < 0.1 297.6 ± 0.2 10.1 ± 1.7 34.7 ± 12.8 680 11.3 ± 0.5 763.1 ± 6.7 22.2 ± 5.3 66.7 ± 19.1 522.4 ± 19.1 151.8 ± 1.5 21.6 7.8 2.2 × 1 0 − 2 5.7 2091.2 0.96 Temperatures, pressures and relative humidities (%RH) are presented as mean values and standard deviations (std) for the 60 s o f liquid water release . The details of error calculations for the reported volumes are given in the section ‘Mapping and quanti fi cation ’. The errors on water fl ow rate are calculated with the method of standard method of error propagation considering an incertitude of 2 s on the time. The details of the last four columns are given in the section ‘Sand grain ejection ’.
Fig. 4. Mosaic of typical morphological results obtained after the waterflowed on the sand test bed as a function of sediment and water temperature. Orthoimages obtained by photogrammetry of the surface. The width of the test bed is about 40 cm. The top of the slope is located at the top of the image. The selected orthoimages correspond to the following runs: S278-W278-1; S288-W278-2; S297-W278-2; S278-W288-3; S288-W288-3; S297-W288-1; S278-W297-3; S288-W297-3; S297-W297-3 (from left to right and top to bottom).
first interacts with the sand and as ending when the last pellets come to a stop in the videos. These pellets are produced over the whole duration of the water release, but we generally observed that the peak in pellet production occurred in thefirst seconds of the experiments
(Fig. 5). We defined the ‘peak pellet’ event in
Figure 5 as starting at the production of the
first pellet and ending when the production of pellets becomes sporadic with fewer than two pellets every c. 5 s.
(3) For some experiments we observed the for-mation of an ephemeral channel carved
into the dry sand by pellets moving down-slope (Figs 4, 5& 8, Supplementary videos 1 (right), 2 (right), 5 (right), 7 and 8). This channel was not visible or was poorly visi-ble at the end of the experiments because it was generally backfilled with pellets and dry sand (Fig. 8). When this event occurred it was synchronous with the peak pellet event.
(4) Avalanches of dry sand were observed under certain conditions (Figs 4,5&8, Supplemen-tary videos 1 (right), 2 (right), 4, 5 (right), 9). We defined the duration of this event as
Fig. 5. Sequence of events as a function of sand temperature (grey labels at the top of each panel) and water temperature (black labels on y-axis). The length and position of the bars represent the average time from the triplicates for one Ts/Twconfiguration. Dashed line indicates that the event is still active at the end for at least one triplicate. In this case, the unbroken line corresponds to the mean end time of the event or of the end of the video recording. The vertical black bar indicates the end of the peak period of pellet production.
being from thefirst avalanche to end of the last one in the videos.
(5) As the water was released we sometimes observed the ejection of individual sand grains at the saturated-dry boundary (Fig. 5, Sup-plementary videos 1 (right), 2 (right), 4, 5 (right), 9 and 10). We defined the beginning and the end of the ejection event by simply not-ing thefirst and the last (respectively) observa-tions of sand ejection in the videos.
(6) For all the combinations of water and sand temperatures (but not for all the experimental runs), we observed the excavation of the dry sand around the water outlet creating a depression (Figs 5 & 7, Supplementary videos 1 (right), 2 (right), 4, 5 and 9). For
most of these observations the excavation is clearly associated with dry sand ejection and granular avalanches. However, for three experiments (runs S278-W278-2, S278-W278-3 and S278-W288-3) no dry sand ejection could be identified from direct obser-vation or from the video data. We attribute this inconsistency to natural variations in the sand compaction between experiments. We defined the start of this event as being when the water released interacted with the dry sand and the end when the edges of the depression excavated are not expanding any-more in the videos.
(7) Around the overland flow feature, the water continued to percolate even after the end of
Fig. 6. Morphological features shared by all the experiments. (a) Rounded pellets (run S288-W278-2). They can create a track in the dry and loose sediments by rolling/sliding. The location of this image is outlined by the white box inFigure 8. (b) Persistent channel created by transport of the sand from the erosion area, situated mainly at the water outlet, to the accumulation area (run S278-W288-3). Levees are formedflanking the channel at the transition between these two areas. Accumulation of lobes of sand layers downflow, which often have cavities at their termini. The deposits are surrounded by a darker zone of saturated sand. The visible part of the ruler is about 10 cm long. (c) Water source area with gas cavities breaking the surface at the head of the persistent channel (run S278-W288-3). The infiltration of the water creates a darker saturated zone around the outlet and around the leveed channel. The visible part of the ruler is about 10 cm long. (d) Vertical cross-section of the test bed. (1) near the surface, the channel cross-section is elevated above the surface by the superposition of lobes (run S278-W297-3). The boiling water has created cavities in the sand. (2) The saturated zone observed at the surface is also visible at depth in the cross-section of the test bed. The visible part of the ruler is about 15 cm long.
water release and a saturated zone of wet sand formed at the surface (Figs 4,6c, d&7, Sup-plementary video 5). This percolation is visible via a darkening of the sand. Vertically cut channel cross-sections all showed the same
features (Fig. 6d): (a) near the surface there was a high porosity owing to the cavities formed by bubbles produced by the boiling water; and (b) below down to the base, the sand was wet owing to water percolation.
Fig. 7. Persistent channel morphologies as a function of sediment and water temperature with annotations. Orthoimages are obtained by photogrammetry. The width of the images is about 25 cm. The black box indicates the position of the zoomed image inFigure 10b. The selected orthoimages correspond to the following runs:
S278-W278-1; S278-W288-3; S278-W297-1; S288-W278-2; S288-W288-3; S288-W297-3; S297-W278-2; S297-W288-1; S297-W297-3 (from left to right and top to bottom).
Fig. 8. A series of annotated images highlighting the morphological influence of the pellets as a function of sediment and water temperature. Orthoimages are obtained by photogrammetry. The width of the images is about 40 cm. Zoomed images in the white box and the black box are shown inFigures 6a&10a, respectively. The selected orthoimages correspond to the following runs: S278-W278-1; S278-W288-3; S278-W297-1; S288-W278-2; S288-W288-3; S288-W297-3; S297-W278-2; S297-W288-1; S297-W297-3 (from left to right and top to bottom).
Morphological differences observed
as a function of sand temperature
Here we describe how the morphology and the phys-ical processes change owing to sand temperature. We describe only features common to all water tem-peratures for any given sand temperature. The
description of the sequence of events is comple-mented by video screenshots at the different sand temperatures which are presented inFigure 9.
At a low sand temperature (c. 278 K), millimetre-size rounded pellets are ejected as the liquid water is released (Figs 5& 9a[1–3]). They slide for c. 1 s and then stop or roll downslope (Supplementary
Fig. 9. Screenshots of videos for three sand and water temperature configurations at different times during the runs: [1] t = 2 s, [2] t = 5 s, [3] t = 14 s, [4] t = 60 s and [5] t = 92 s. The arrows indicate the events of interest that are occurring at the time of the screenshots: red arrows indicate pellet movements; yellow arrows indicate dry sand ejection; green arrows indicate sand excavation around the outlet; blue arrows indicate the formation of the persistent channel; light blue arrows indicate dry sand avalanches; black arrows indicate the channel carved by pellet-movement and purple arrows indicate the debris fan. For frame [1] an inset is included detailing the water outlet to highlight any sand ejection. (a) Ts= 278 K and Tw= 288 K (run S278-W288-3). (b) Ts= 288 K and Tw= 288 K (run S288-W288-2). (c) Ts= 297 K and Tw= 288 K (run S297-W288-2).
videos 1 (left), 2 (left), 5 (left) and 6), sometimes leaving tracks on the dry sand bed (Figs 6a&8). The pellets numbered in the hundreds during the 60 s of waterflow. Usually sand grain ejection did not occur at this sand temperature. We observed this process for a few seconds only in one run
(Fig. 5, run S278-W297-2).
Sometimes (infive out of nine runs), a depres-sion was formed by the transport of dry sand around the water outlet. This event is rapidly over-printed by overlandflow and the extension of the
saturated zone (Fig. 7and Supplementary video 5 (left)).
A straight channel, constructed by transport of sediment by overlandflow, started to form at the beginning of the water release and its formation stopped when the water valve was closed (Figs 5
&9a[1–4], Supplementary videos 1 (left), 2 (left), 5 (left) and 6).
During all the experiments water percolated into the surrounding sand, forming a darker saturated zone of wet sand around the channel but with
Fig. 10. Images of unusual morphological features observed following the experimental runs. (a) Centimetre-sized pellets present in a debris fan which have afluffy sand texture at their base. The location of this image is shown by the black box inFigure 8(run S297-W278-2). (b) Cavities produced by sand ejection owing to intense gas release at the boundary between water saturated sediment and dry sediment. The location of this image is shown by the black box inFigure 7(run S288-W278-2). (c) Erosional area at the water outlet for a run at Ts= 278 K and Tw= 288 K (run S278-W288-2). (d) Erosional area at the water outlet for a run at Ts= 288 K and Tw= 288 K (run S288-W288-3). The black dashed line indicates the boundary between two different textures of saturated sand. The inner saturated zone had afluffier texture than the outer saturated zone. (e) Erosional area at the water outlet for a run at Ts= 297 K and Tw= 288 K (run S297-W288-2). The area where water had infiltrated had a fluffy texture.
no other obvious surface changes (Figs 6, 7 &
10c, Supplementary videos 1 (left), 2 (left), 5 (left) and 6).
For experiments performed at a high sand tem-perature (c. 297 K), we found additional processes and features. Pellets were also formed at the begin-ning of these experiments, when the water interacted with the dry sand (Figs 5&9c[1–4]). However, the range of sizes was larger than at 278 K, from milli-metre to centimilli-metre scale (0.5–60 mm), with irregu-lar shapes and a fluffy texture at the base of the larger ones which developed during their formation and sliding (Fig. 10a). They slid and/or rolled downslope with a low direct contact with the surface of the test bed (Supplementary videos 1 (right), 2 (right), 5 (right)). The number of large pellets form-ing in the first few seconds of the water released was higher than at 278 K. These pellets carved a depression in the sand as they slid and rolled down-slope, leading to the formation of a transportation channel about 5 cm wide with a curvilinear shape
(Raack et al. 2017). As the pellets reached the
bot-tom of the tray, the ephemeral channel was back-filled after a few seconds by more pellets and avalanching dry sand (Supplementary video 7). The duration of the pellet peak is similar at Ts= 278 and 297 K, but in the last case the amount of transported sediment is greater (see the section ‘Transported volume of sediment’). At the end of these experiments we counted several hundred pel-lets on the sand test bed.
As boiling water interacted with the sand bed, we also observed the ejection of dry sand grains. In the first second the ejected sand was continuous and intense (Supplementary videos 1 (right), 2 (right), 5 (right)). This stopped when the sand at the water outlet was saturated. The ejection process persisted after the end of the water release for tens of seconds
(Fig. 5, Supplementary video 9). The ejection was
therefore observed locally at the border between the saturated sand and the dry sand (Fig. 9c[4–5]), Supplementary video 9), sometimes leaving deep cavities (Figs 7&10b). Both the production of pel-lets and the sand ejection triggered avalanches of the dry sand. These avalanches extended downslope, covering the ephemeral channel and the previously deposited pellets. The avalanches continued to occur after the end of the water release, for several seconds or even minutes (Figs 5&9c[5], Supple-mentary video 9). We observed a greater lateral extension of the excavation of the sand around the source area (Fig. 5) than for Ts= 278 K. The intense ejection of sand grains and avalanches favoured the growth of the depression that was not later over-printed by the overlandflow and/or water percola-tion (Fig. 7). When the sand at the water outlet started to become saturated, the intensity of sand ejection reduced and a persistent channel was formed
by overlandflow. These processes occurred about 20 s later than for the experiments at a sand temper-ature of 278 K (Figs 5 & 9c [3], Supplementary video 5 (right)). Finally, as at Ts= 278 K, some of the water percolated into the sand and a saturated zone demarking the limit of water infiltration grew around the persistent channel. However, the texture of the wet sand appeared to befluffier than it was at a colder sand temperature (Figs 7&10e). In addi-tion, the imprint of the saturated zone was topo-graphically highlighted by the removal of some of the loose dry sand around it.
The experiments at intermediate sand tempera-ture (Ts= 288 K) displayed similar processes and morphology to the experiments at the other two sand temperatures. The pellets formed during these experiments had irregular shapes with sizes ranging from 0.5 to 30 mm. They formed in a limited amount (about 100) compared with the experiments at Ts= 297 K (several hundreds). The centimetre-sized pel-lets slid over the sand but only over a very short dura-tion (<1 s) and did not reach the bottom of the tray. The sand ejection had a shorter duration than at higher temperature (except at water temperatures Tw= 278 K). The avalanches of dry sand were smaller than at a sand temperature of 297 K. The excavation of the depression around the outlet was overprinted by the overlandflow and water percola-tion (Fig. 7, Supplementary video 4). The persistent channel formed by the overlandflow started to form a few seconds after the beginning of the experiment
(Fig. 5). The saturated zone around the persistent
channel either had thefluffy, high-relief appearance of ones formed at higher temperature (at Tw= 278 K) or an intermediate morphology. In some experiments we observed that the saturated zone displayed two different textures and topographic expressions depending on its radial position
(Fig. 10d). The wet sand in contact with the
persis-tent channel (inner saturated zone) was rough, with a sand texture looking less‘cohesive’ than at colder temperatures and in some placesfluffy. The outer saturated zone of wet sand, in contrast, showed no unusual texture, similar to the saturated zone in the colder experiments.
Morphological differences observed as a
function of water temperature
If we compare experiments performed at different water temperatures yet with the same sand tempera-ture, only slight differences can be found. As in the preceding section, we describe how the morphology and the physical processes change and we describe only features common to all sand temperatures for any given water temperature. An increase in water temperature tends to decrease the runout length of
the overland water channel (Fig. 4and the section ‘Overland flow feature’).
At a sand temperature of 278 K, we noted no sig-nificant influence of water temperature on the sequence or duration of events. At Tw= 298 K, dry sand ejection occurred for a few seconds at the beginning of one of the experiments (Fig. 5, run S278-W297-2) and hence may not be representative. However, at a sand temperature of 288 K, water temperature affected both physical processes and surface morphologies. The duration of the dry sand avalanches and the sand ejection tended to increase between Tw= 297 K and Tw= 278 K (Fig. 5). Ava-lanche events occurred at least 60 s later at Tw= 288 K compared with Tw= 297 K, and at Tw= 278 K compared with Tw= 288 K, and the ejection of the sand grains had a duration of up to two times longer at Tw= 278 K than at higher tempera-tures. The observed surface morphology of the over-land flow and the water saturated zones was also different depending on the water temperature. Fea-tures at Tw= 288 K and Tw= 297 K were similar
(Fig. 7), both having a saturated area characterized
by a rough inner part with a darker colour andfluffier sand texture and an outer part with only an albedo difference, few pellets and small sand avalanches
(Fig. 5). At Tw= 278 K, the saturated area had a
con-vex topographic surface and afluffy texture. These resembled the saturated area observed at Ts= 297 K (Fig. 7). The top of the saturated area was also surrounded by a sand excavation hole (Fig. 7). For runs at Tw= 278 K, we observed a depression created by the ejection of sand grains at the boundary of the saturated area, a feature which was not present at higher temperature. Finally, avalanches were more numerous and larger at Tw= 278 K than at higher temperature.
At sand temperature of 297 K we did not inventory any morphological changes which can unambiguously be attributed to changes in water temperature alone. Although the duration of the ejec-tion and avalanches seemed to follow a similar trend to experiments at Tw= 288 K (the duration increased as the water temperature decreased), some of the vid-eos were stopped before the end of these events (runs S297-W297-3 and S297-W288-2, Fig. 5), so this observation remains ambiguous.
Analysis methods
Mapping and quanti
fication
Photos of the test bed acquired before and after the experiments were used to produce orthophotos and DEMs. The photos were processed with Agisoft PhotoScan Professional software, which produces 3D models of a scene using multiview photogram-metry, otherwise known as‘structure-from-motion’
(Westoby et al. 2012). We produced orthophotos
with 0.2 mm spatial resolution and DEMs at 1 mm spatial resolution of the sediment beds. To ensure the resulting models were at the correct scale, to reduce distortion and so that before-after pairs were correctly coregistered, we included 12 black and white targets, 2.7 cm in diameter, with known rela-tive positions in the processing (Figs 2b&3).
The obtained data were then exported to ArcGIS software and three types of measurements were per-formed (Table 2): (1) mapping of the spatial domains of the differentflow processes; (2) volume measure-ments of erosion and deposition (transported mate-rial); and (3) manual measurements, including length and width of the channel (Table 3). Each of these is described in more detail below.
(1) We mapped the area affected by the different flow processes at the end of the experiments using the orthophotos, DEM and a relief-shaded version of the DEM (termed as hill-shade model henceforth) with reference to the processes visible in the videos. Following
Raack et al. (2017)the extent of the processes
was identified (Fig. 11) in line with the descrip-tion of processes given in the secdescrip-tion‘General observations’ (Fig. 5,Table 2): (a) in blue, the overlandflow feature; (b) in red, pellets that form with liquid water contact and move downslope by rolling/sliding; (c) in yellow, dry processes including sand ejection and dry avalanches; and (d) in green, areas where sub-strate was affected by water percolation. (2) Based on our manual mapping of the surface
expression of each transport mechanism, we made an estimate of the volume of sediment transported by each of these mechanisms
(Tables 2 & 3). To calculate the volume of
sand eroded and deposited, we combined the region mapping with the calculation of the ele-vation changes between DEMs before and after the experiments (Fig. 12). This method of estimating the volume relies on the assump-tion that thefinal morphology is representative of the cumulative transport via these processes throughout the experiments. However, these processes superpose in space and time, mean-ing the volumes of these particular transport processes we calculate from our mapping remain relatively crude estimates. For exam-ple, we observed that pellets deposited early in the experiment could be superposed by dry avalanches, and erosion could be performed by both pellet ejection and dry avalanches/ ejection and overland flow, yet finally was mapped as overland flow. We followed the methods employed byRaack et al. (2017)to place reasonable uncertainties on our estimated
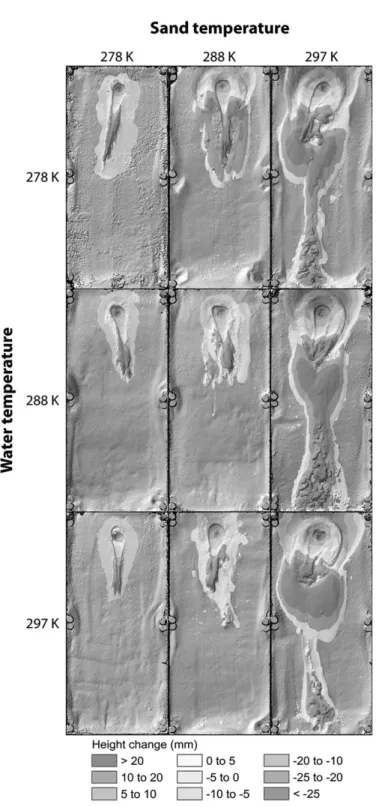
Fig. 11. Mosaic of morphological maps obtained after the waterflowed on the sand test bed as a function of sediment and water temperature. The mapping highlights the area affected by different transport processes (blue = overlandflow, green = percolation, red = pellets, yellow = dry avalanches/ejection). The maps are overlain on a hillshaded relief model generated from digital elevation models (1 mm/pix) obtained by photogrammetry. The width of the test bed is about 40 cm. The top of the slope is located at the top of the image. S278-W278-1; S288-W278-2; S297-W278-2; S278-W288-3; S288-W288-3; S297-W288-1; S278-W297-3; S288-W297-3; S297-W297-3 (from left to right and top to bottom).
Fig. 12. Mosaic of the elevation difference between start and end of experiments as a function of sediment and water temperature. The elevation differences are overlain onto a hillshade relief model derived from the DEMs (1 mm/pix) obtained by photogrammetry. The width of the test bed is about 40 cm. The top of the slope is located at the top of the image. S278-W278-1; S288-W278-2; S297-W278-2; S278-W288-3; S288-W288-3; S297-W288-1;
S278-W297-3; S288-W297-3; S297-W297-3 (from left to right and top to bottom). C. HERNY ET AL.
volumes. The total errors for eroded, deposited and the resulting transported volume (Table 3) were calculated with the‘measurement error’ which was scaled by their respective surface areas. To give a more precise classification of the transported material into our chosen trans-port mechanisms (overlandflow, percolation, pellets and dry avalanches/ejection) we also calculated the ‘superposition error’ and the ‘interpolation error’. These errors had no influ-ence on the total error of each experiment (‘measurement error’), but appeared in the sub-division for each transport mechanism (Raack
et al. 2017).
The‘measurement error’ ranged from 0.1 to 22.6 cm3(with a median value of 2.1) for indi-vidual transport mechanisms, and from 2.6 to 42.9 cm3 (with a median value of 9.0) for total error. For each experiment we performed volume calculations on undisturbed surfaces (not affected by flows, pellets and/or ava-lanches) on afixed area of c. 46 cm2to esti-mate our measurement error. The resulting volumes were scaled to the areas of the trans-portation mechanisms or the total area, as appropriate. This approach was used because many factors influence the errors in DEMs (e.g. quality of photos, misplacement of tar-gets, light differences, etc.), which are individ-ually hard to estimate, vary from experiment to experiment and influence the calculation of volumes.
The‘superposition error’ ranged from 7.7 to 30.2 cm3 (with a median value of 16.4) and was calculated as follows. From our observa-tions for experiments at intermediate (288 K) and warm (297 K) sediment temperatures, we found that the area which was mapped as over-landflow was also affected and eroded by pel-let ejection and dry avalanches/ejection during the first seconds of water released. During experiments at low sediment temperatures (278 K) this effect was not observed. There-fore to avoid an overestimation of the overland flow erosion volume for the experiments at 288 and 297 K sand temperature, we made an adjustment to our usual calculations. Instead of using the‘before’ DEM for volume calcula-tions (volume = difference between ‘before’ and ‘after’ DEMs), we used an interpolated ‘natural neighbour’ surface DEM fitted to ele-vations extracted from the‘after’ DEM within a 2 mm buffer outside the digitized boundary of the overlandflow. Using this new surface meant that we did not include the material eroded via pellet ejection and dry ava-lanches/ejection earlier in the experiment. We assigned this volume to the overland
flow category, but this left us with a remnant volume which had no assigned process. We observed in the videos that this material was transported by pellet ejection and dry ava-lanches/ejection; therefore we partitioned it arbitrarily 50–50% to both of these mecha-nisms. We do not know the exact partitioning so therefore we assume this 50% remnant vol-ume to be the worst-case uncertainty on the volume partitioning.
The‘interpolation error’ ranged from 3.1 to 7.8 cm3(with a median value of 5.2). As a sec-ond step, we calculated the uncertainty on using the natural neighbour method to estimate the original basal surface (as described in the ‘superposition error’ above). For this, we used the above-described methods to calculate the volumes for overlandflow for cold experi-ments (278 K), using both the interpolated and ‘before’ basal surface, but this time we knew that this zone was not affected by other mech-anisms. The difference between these calcula-tions was taken as the‘interpolation error’. The gathered values were averaged for experiments with the three different water temperatures. We then scaled this uncertainty for the area of overlandflow for intermediate and warm experiments.
(3) We used the DEM and orthophotos to mea-sure the linear dimensions of pertinent fea-tures, as follows. The length of the overland flow feature (Table 3) was defined as the max-imum linear distance between the uppermost sediment disturbance and the lowermost sedi-ment disturbance caused by direct entrainsedi-ment by liquid water. The width of the overland flow feature (Table 3) was defined as the max-imum linear distance between the outer edges of the levees resulting from overland flow taken perpendicular to the length measure-ment. The uncertainty on these measurements is c. 0.5 cm. Finally the average sizes of pel-lets were estimated by averaging their maxi-mum and the minimaxi-mum dimensions in plan view. The uncertainty is estimated to be c. 0.5 mm.
Speeds
The influence of the temperatures on the dynamics of the physical processes was investigated by comput-ing the speeds of formation or displacement of key morphological features. The speed of formation of the overland flow feature was estimated using its measured length (see the section ‘Mapping and quantification’) and the duration of the formation of this feature (see the section ‘General observa-tions’). The estimated error on the duration was
1 s. For this calculation, the error on the speed was determined by error propagation of the errors on length and duration.
We also determined the speed of single pellets using the video by taking advantage of the gradua-tions on the side walls of the tray (at 10 cm intervals). The mean propagation speed of the pellets was calcu-lated by identifying the time at which the pellet reached the position 10 cm from the top of the tray to the position where it stopped.
Analysis results
Transported volume of sediment
We identified four different transport processes in our experiments which are also shown in our map-ping: (1) overlandflow; (2) ejection of single sand grains; (3) formation of pellets; and (4) dry ava-lanches (Tables 2 and 3 and Fig. 11). We found that the total volume transported (Figs 12 & 13) did not vary systematically with water temperature
(Fig. 13a). However for Ts= 288 K the total
trans-ported volume decreased significantly (about two times less) between Tw= 278 K and the higher tem-peratures. This trend was not observed for Ts= 278 K or 297 K. This decrease could be linked with changes of the observed process dynamics
(Fig. 7) of these experiments (Ts= 288 K and Tw=
278 K). We observed at Ts= 288 K and Tw= 278 K that the dry processes (sand ejection and ava-lanches) were more frequent and had a longer dura-tion than at higher water temperature (Fig. 5and Supplementary video 4) providing an explanation for the increase in sediment transport.
In contrast, wefind that the total transported vol-ume of sediment (Figs 12 & 13) systematically increased as the temperature of sand increased
(Fig. 13b). The transported volume was about 9
times higher at 297 K compared with at 278 K, as was observed previously byRaack et al. (2017). At low sand temperature (278 K) most of the sediment was transported by entrainment of the sand by the flowing boiling water (c. 98%), while a limited amount (c. 2%) was transported in the form of wet sand pellets (Table 3). Sand ejection and avalanches were either not observed or transported negligible volumes. At higher temperatures, the balance of pro-cesses shifted (about 95% of sediments are trans-ported by pellets and dry processes), as discussed previously (see the section‘Morphological differ-ences observed as a function of sand temperature’), and this shift increased the amount of sediment transported. The absolute (and relative) volume of sediment transported directly by boiling water decreased as the sand temperature increased
(Fig. 13c). This can easily be accounted for:
first, the duration of the overland flow decreases
with increasing temperature (Fig. 4). Second, the fre-quency of pellet production and dry avalanches increases with increased sand temperature. These two classes of sediment transport have an ‘exponential-like’ increase in volume with sand tem-perature (Fig. 13b). Together they constitute about 93–97% of the total transported volume at Ts= 297 K (Table 3). Therefore, the rapidly increasing trend of transported volume with sand temperature can almost entirely be accounted for by an increase in the intensity of pellet production and dry pro-cesses. The substantial increase in the volume of sediment transported can be attributed to the enhancement in the intensity of boiling experienced by the liquid water. This boiling intensity depends primarily on the sand temperature, rather than on the water temperature (Fig. 13b).
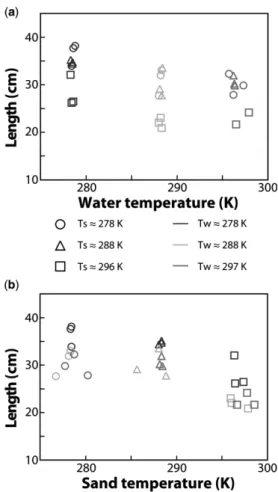
Overland
flow feature
Increases in both water temperature and sand tem-perature tended to decrease the overall length of the overlandflow feature (Figs 7&14). The length of the overland flow feature changed very little between water temperatures of 288 and 297 K and increased at 278 K (Fig. 14a). This increase may be linked to a slightly higher flow propagation speed for runs at Tw= 278 K compared with the other two (on average, 0.59 ± 0.01 cm s−1at Tw= 278 K and about 0.49 ± 0.01 cm s−1 at Tw= 288 and 297 K; Fig. 15a). The reason for this higher speed, and therefore the longer length, could be that there is less water available at the surface at water temperatures≥288 K. Our hypothesis is that the water percolates faster into the sand at warmer temperatures, decreasing the availability of water at the surface and/or that water needs first to change phase to cool down to reach the boiling point (latent heat), diminishing the amount available water (see more details in the section ‘Sand and water temperature’).
The lengths of the overland flow feature were similar at Ts= 278 and 288 K and decreased at Ts= 297 K (Fig. 14b). Theflow propagation speeds were similar for all sand temperatures and did not show any trend (Fig. 15b). The shorter length of the overlandflow feature at 297 K can be attributed to the later start of channel formation compared with experiments performed at lower sand temperatures (about 20 s later;Fig. 5). We think that this later start is due to the increased intensity of sand ejec-tion and pellet producejec-tion that inhibits/retards the saturation of the sand at the source area and so the initiation of the overlandflow feature. The decrease in the transported volume by overland flow with increasing sand temperature is also linked to the reduction in the length of the overlandflow feature
(Fig. 13c).
Percolation
The saturated area of sand formed by percolation of the liquid water can have different surface charac-teristics (Fig. 10). At low sand temperature the water percolated into the sand, as revealed by the
change of colour of the wet sand compared with its surroundings, with change in relief (Fig. 10c), while at a sand temperature of 297 K the surface of the saturated area had a fluffier sand texture and the boundary of the saturated area had topo-graphic relief (Fig. 10e). We attribute this difference
Fig. 13. Transported sediment volume v. temperature. The error values are presented inTable 3for clarity (theyfit within the points). (a) Total volume v. water temperature. (b) Total volume v. sand temperature. (c) Transported volume v. sand temperature, split into the different transport processes described in the section‘Mapping and quantification’.