HAL Id: hal-01791450
https://hal.archives-ouvertes.fr/hal-01791450
Submitted on 17 May 2018HAL is a multi-disciplinary open access archive for the deposit and dissemination of sci-entific research documents, whether they are pub-lished or not. The documents may come from teaching and research institutions in France or abroad, or from public or private research centers.
L’archive ouverte pluridisciplinaire HAL, est destinée au dépôt et à la diffusion de documents scientifiques de niveau recherche, publiés ou non, émanant des établissements d’enseignement et de recherche français ou étrangers, des laboratoires publics ou privés.
Distributed under a Creative Commons Attribution - NonCommercial - ShareAlike| 4.0 International License
Simulation of nanosecond IR laser annealing of cerium
gadolinium oxide
Mariana Mariño, Philippe Breuil, Mathilde Rieu, D. Jamon, Jean-Michel
Rampnoux, Jean-Paul Viricelle, Florence Garrelie
To cite this version:
Mariana Mariño, Philippe Breuil, Mathilde Rieu, D. Jamon, Jean-Michel Rampnoux, et al.. Simula-tion of nanosecond IR laser annealing of cerium gadolinium oxide. Journal of the European Ceramic Society, Elsevier, 2018, 38 (11), pp.3875 - 3880. �10.1016/j.jeurceramsoc.2018.04.035�. �hal-01791450�
Simulation of nanosecond IR laser annealing of cerium gadolinium oxide
Mariana Mariño
a, Philippe Breuil
a, Mathilde Rieu
a,*, Damien Jamon
b, Jean-Michel Rampnoux
c, Jean-Paul Viricelle
a, Florence Garrelie
ba
École Nationale Supérieure des Mines, SPIN-EMSE, CNRS:UMR5307, LGF, F-42023
Saint-Étienne, France
b
Univ Lyon, UJM-Saint-Etienne, CNRS, Institut d’Optique Graduate School, Laboratoire Hubert
Curien UMR 5516, F-42023, SAINT-ETIENNE, France
c
Laboratoire Onde et Matière d'Aquitaine (LOMA), UMR 5798, CNRS-Université de Bordeaux,
Talence, France
*
Corresponding author
Mathilde Rieu: rieu@emse.fr, Tel.: +33 4 77 42 02 82
Abstract
Laser induced densification of ceramic oxide has shown great promises. However to control
this process in regards of the final properties of the material, it is necessary to understand
phenomena occurring during laser matter interaction, especially heat diffusion through the
material. A thermal simulation of cerium gadolinium oxide (CGO) submitted to infrared laser
pulses is presented. In order to determine the temperature profile during laser treatment,
optical properties of CGO must be known; for this purpose, ellipsometry measurements were
performed in order to obtain absorption coefficient and reflectivity. Finally, a thermal model
based on heat equation was developed. Experimental observations of irradiated CGO surfaces
were in agreement with the simulation results, in particular at maximum temperature when
the material reaches fusion.
1. Introduction
In Single Chamber Solid Oxide Fuel Cell (SC-SOFC), as the generation of the open circuit voltage (OCV) depends mainly on the electrocatalytic activity and selectivity of the electrodes, and not only on a dense electrolyte as in conventional SOFC, it is possible to operate without a gastight electrolyte [1,2]. It allows to use simple and conventional processing methods to prepare the electrolyte. For example, screen-printing, a simple and low-cost deposition technique can be used to prepare a thin and porous layer, because in such a case a dense electrolyte is not required [2–4]. However, some authors [2,3,5] have indicated that the porosity related to the electrolyte may allow the transport of the hydrogen produced locally at the anode to the cathode, which can generate an OCV drop and a decrease of cell performances. To prevent hydrogen transportation, it is thus recommended to have a dense electrolyte or at least a diffusion barrier layer, while at the same time preserving the porosity of the electrodes [2,3,5].
Solid oxide electrolytes based on cerium gadolinium oxide (CGO) materials are considered to be the most promising candidate materials for use in single-chamber solid oxide fuel cells, because they offer considerably high ionic conductivity at intermediate operating temperatures (450–700◦C) [6,7]. Nevertheless, the achievement of dense materials requires sintering temperatures above 1400◦C [8– 10]. Densification of the electrolyte by conventional heat treatment is obviously possible, but this also leads to an undesired densification of the support material (most often anode). To solve this difficulty, Mariño et al [5] proposed to selectively densify the electrolyte in anode supported SC-SOFC by a laser treatment, using either a pulsed nanosecond ultraviolet (UV) laser or an infrared (IR) laser.
Laser annealing is a technique that allows localized modifications to the materials without affecting the entire structure [10,11]. This technique has been employed successfully to treat ceramic materials with an increasing interest in their densification [12–18] and it has been demonstrated that pulsed laser irradiation offers an attractive alternative to conventional thermal annealing for oxides densification [11,12].
The changes induced on the surface of a material treated by a laser strongly depend on the amount of energy absorbed by the material. To obtain the desired results, it is important to figure out the surface temperature and its distribution within the material. However, the in situ measure of the temperature remains still difficult during a laser treatment with a pulsed laser [13,14]. For a better understanding and control of the laser annealing process , this work proposes a numerical simulation of laser-mater interaction based on previous experiments made by Mariño et al concerning local densification of CGO electrolyte in SOFC [5]. Here, we will only focus on results obtained with a pulsed IR laser. Furthermore,
a measurement of the optical properties of CGO material as a function of temperature is presented, necessary to implement realistic simulation of material properties.
2. Thermal modelling
The temperature distribution in a material, induced by the absorption of a laser irradiation can be described by the heat equation which depends on the optical and thermal parameters of the medium[15]. If the thermal diffusivity length (defined hereafter) is negligible with respect to the laser beam diameter [14,16], a one dimensional model can be used and the heat equation can be expressed by the equation (1). The heat radial diffusion is then neglected. In this case, the differential equation (1) is a model of the temperature.
𝜌(𝑇)𝐶
𝑝(𝑇)
𝜕𝑇(𝑥,𝑡) 𝜕𝑡−
𝜕 𝜕𝑥(𝜅(𝑇)
𝜕𝑇(𝑥,𝑡) 𝜕𝑥) = 𝑄(𝑥, 𝑡)
(1)
The left part of the equation represents the temporal and spatial distribution of the temperature. The temporal distribution of the temperature is determined by the density of the material ρ(T) and the heat capacity Cp(T), while the spatial evolution depends on the thermal conductivity κ(T) and also
determines the heat diffusion in the material [15–17]. Values used in this work for cerium gadolinium oxide (CGO) are presented in table 1.
The right part of equation (1), Q(x,t), corresponds to the laser energy absorbed by the material. It depends on the optical properties of the material like the absorption coefficient (𝛼) and the reflectivity (R), the laser fluence (F) and the time dependence of the laser pulse q(t) [15,18]. If the absorption coefficient 𝛼 is constant (and then not dependent on the temperature), the integrated form of the Beer-Lambert law may be used as in equation (2).
𝑄(𝑥, 𝑡) = F(1 − 𝑅)𝑞(𝑡)𝛼exp(−αx) [W m
-3]
(2)
Thermal simulations based on previous equations were carried out using an IR pulsed laser on a CGO surface. The induced temperature profile after laser pulse irradiation was calculated using COMSOL Multiphysics software, which uses a finite element method. This software has a database of equations to model different phenomena. In this case, the heat transfer in solids module was used.
We remind here that the thermal diffusivity length 𝑙𝜏 is defined qualitatively by equation (3).
is the laser pulse duration. D is the thermal diffusivity of the material which depends on the thermal conductivity κ, the heat capacity Cp and the density of the material ρ, reported in equation (4).
𝐷 =
𝜌𝐶𝜅𝑝
(4)
Table 1. Physical properties of CGO used for simulations
Properties Values [Reference]
Cps [J.kg-1.K-1] 350 [19]
𝜅 [W.m-1.K-1] 2.52 [19]
D [m2.s-1] 1.0 x 10⁻⁶ [19]
ρ [kg.m-3] 7220 (provider)
The program solves the macroscopic thermal equation (1) at each node of the grid and generates the temperature profile inside the volume of the structure.
Several steps and conditions were determined to carry out this simulation:
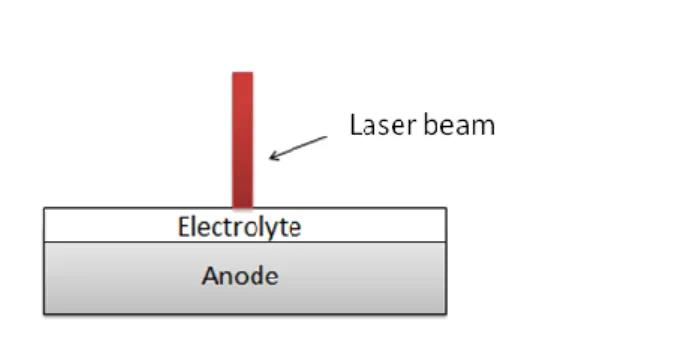
a. The geometry of the 1D model is simple (Fig. 1) as we consider only 1D diffusion in CGO electrolyte. The thickness of the CGO layer is around 20 μm in depth and it is assumed that the heat diffusion is limited in the electrolyte layer and no thermal effect reach the anode. b. The time profile of the laser pulse q(t) (5) is described by a normalized Gaussian function [15]
depending on laser characteristics.
𝑞(𝑡) =
1√2𝜋∗𝑡𝑠
𝑒𝑥𝑝 (−
(𝑡−𝑡𝑜)2
2𝑡𝑠2
)
(5)
where 𝑡𝑠=2√2𝑙𝑛2𝜏 and 𝑡𝑜 = 3 ∗ 𝑡𝑠. is the laser pulse duration, this parameter being specific to the
used laser.
c. Meshing: This procedure is a very important step for the reliability of the simulation results. The meshing functionality allows the geometric model to be discretized into small units of simple shapes, called mesh elements. After several simulation tests with different meshing sizes, we have checked that the maximum meshing size that we can use has to be lower than the optical adsorption depth, which is defined as the reverse of the adsorption coefficient . In such conditions, meshing size has minor effects on simulation results.
d. Heat source is defined by equation (2), thereby it is necessary to determine optical properties of CGO (α and R).
e. Limit conditions have to be defined. The initial temperature of the sample is the ambient temperature, set at 20 ° C. The lower edge (bulk of material) is considered as adiabatic according to equation (6) where n is the normal vector at the surface.
−𝑛. (−κ∇𝑇) = 0 (6)
On the upper surface (in contact with air), heat is lost by the combined action of natural convection and thermal radiation according to equation (7).
−𝑛. (−κ∇𝑇) = ℎ(𝑇 − 𝑇∞) + 𝜀𝜎(𝑇4− 𝑇∞4) (7)
where T∞ is the ambient temperature (20°C) , h is the convective exchange coefficient (10 W.m-2.K-1), σ the Stefan-Boltzman constant (5.67 x 10⁻⁸ W.m-2.K-4) and ε the emissivity of the
material (0.8). These values have been extracted from the literature for cerium dioxide [20] because no values were found for CGO. We observed from various calculations that convection and thermal radiation do not have a significant influence on the results.
f. Concerning the solver: the time step (dt) of calculation must be imperatively less than the laser pulse duration (τ) for the calculation convergence.
The simulation was first developed for a single laser pulse. Then, simulations presented at the end of this paper consider consecutive laser pulses on CGO surface.
3. Experimental procedure
3.1. Laser annealing of CGO samples
3.1.1. CGO Samples Preparation
Half cells “electrolyte/anode” were prepared to perform laser annealing tests on CGO layers. All the materials used for cells preparation are commercial powders purchased from Fuel Cell Materials. The experimental procedure used to prepare half cells is described in detail elsewhere [3,5]. Anode support was prepared by uniaxial pressing at 250 MPa to obtain a 22 mm diameter disc. The powder mixture was composed of NiO (60 wt%) and CGO (40 wt%), where CGO refers to Ce0.9Gd0.1O1.95 composition.
Then, CGO electrolyte was deposited by screen-printing. The ink was prepared by mixing 63 wt% of CGO powder and 33 wt% of a binder (ESL V400). Eight drops of a solvent (ESL T404) were added per gram of powder. Two layers of electrolyte ink were deposited with a drying step at 120◦C for each
layer, providing a porous electrolyte with a thickness around 20 µm. The assembly was annealed at 1350°C during 3h. Finally, surface of CGO electrolyte was irradiated by the laser as shown in figure 1.
Fig. 1. Schematic representation of laser annealing procedure 3.1.2. Laser annealing
An infrared ytterbium doped fiber laser, YLIA M20EG (λ= 1064 nm (1.16eV), τ= 100 ns, frequency = 25 kHz, 80 µm diameter laser spot size on the sample) was used. Experimental tests were also previously made by an UV laser [5]. Irradiations of the electrolyte surface were performed in air, with series of pulses between 1 and 10 at various fluences. The surface microstructure was analyzed by scanning electron microscopy (FEG-SEM, Jeol JSM 6500 F). .
3.2. Optical characterization of CGO samples
Optical measurements were carried out on bulk samples of CGO annealed at 1350 ° C during 3h. The sample preparation was identical to the anode preparation explained in previous part but in this case, only using CGO powder. The surface sample was polished using a polishing cloth and a commercial colloidal solution of 1 μm particle size diamond to obtain a reflective surface.
Surface sample was analyzed by spectroscopic ellipsometry using an ellipsometer (UVISEL) equipped with a heating cell. Optical measurements were taken between 0.6 to 4.8 eV (258 to 2000 nm) with a step of 0.05 eV. To evaluate the evolution of optical properties as a function of temperature, experiments were carried out between 25 to 600 °C with 21 measuring points. The atmosphere in the heating cell was ambient air.
The samples were preheated to remove possible impurities adsorbed by the material. The measurements were made at an angle of incidence of 70° and the spot size illuminated by the light source was 1 mm in diameter.
The optical properties extracted from raw data of the ellipsometric experiments were the refractive index (n) and the extinction coefficient (k). The absorption coefficient was calculated using the equation (8).
𝛼 =4𝜋k𝜆 (8)
where k is extinction coefficient and λ the wavelength.
The reflection coefficient R (9) of the material is deduced from the Fresnel relation
𝑅 = (𝑁 −1
𝑁 +1) 2
(9)
where N = n + jk is the complex refractive index
4. Results and discussions
4.1. Optical properties of CGO
Figure 2 shows the absorption coefficient (α) regarding to the photon energy and the sample temperature derived from values of n and k obtained by ellipsometry. Blue curves represent colder temperatures starting at 25°C. The highest temperature was around 578°C (black curve). These refractive index values can be compared with those found in the literature [21,22]. The evolution of the measured absorption coefficient is similar to that measured by Ruiz-Trejo [21]. For example, a large increase of α begins around 3.5 eV. Moreover, at 4.8 eV, our measured absorption coefficient is around 4.3 x 105 cm-1, which is closed to ≈ 4 x 105 cm-1 obtained by Ruiz-Trejo.
A zoom in figure 2 shows that the absorption coefficient (α) in the IR laser region has a low dependence on temperature. For the energy at 1.15 eV (1078 nm) closed to our laser wavelength used for the densification, the mean value of the refractive index is 2.329 ± 0.003 which represents a small variation of about 0.1%, for the entire temperature range. It is therefore considered that the refractive index does not depend on the temperature in the zone of interest (IR laser), and we will use the corresponding value of adsorption coefficient α=5.1 x 103 cm-1.
Fig. 2. Absorption coefficient of CGO at different temperatures as a function of photon energy. (Blue curves represent colder temperatures starting at 25°C and the highest temperature
was around 578°C is the black curve. Inset corresponds to IR domain)
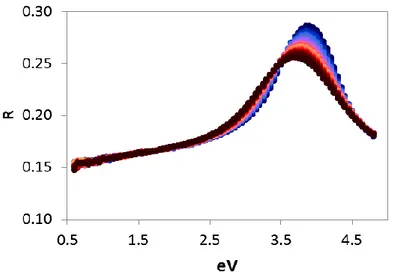
Figure 3 shows the evolution of reflectivity as a function of temperature and photon energy. It is found that the highest reflectivity, around 0.28, is for energies of about 4 eV (309 nm). For the energy of concern in this work (1.16 eV, 1064 nm), the reflectivity is about 0.16. This parameter is also considered to be constant as a function of temperature for the simulation.
The non-dependency of and R with temperature simplifies the simulation, regarding the equation (2). Indeed, it can be considered that the adsorbed IR laser energy do not depend on material temperature. This would not have been the case in the UV domain where and R have significant variations as a function of temperature. In such a case, expressions of the absorption and reflection coefficients should have been written to express the variation as a function of temperature [15].
Fig. 3. Reflectivity of CGO at different temperatures as a function of photon energy. (Blue curves represent colder temperatures starting at 25°C and the highest temperature was around
578°C is the black curve)
4.2. Simulated temperature of laser-annealed CGO samples
As exposed previously, the 1D temperature model is based on the assumption that the thermal diffusivity length 𝑙𝜏 (eq. 3) is negligible with respect to the laser beam diameter. Considering thermal
diffusivity of CGO (D= 10-6m2.s-1, table 1) and laser pulse duration ( = 10-7s), the calculated value of
length 𝑙𝜏 is 632nm. Regarding the laser beam diameter of 80µm, the hypothesis to apply a 1D
simulation is fully acceptable.
4.2.1. Single pulse annealing
Preliminarily, simulations were performed only for a single laser pulse, with a duration of 100 ns. Laser-annealing simulations were carried out by varying the laser fluence. We remind that the fluence is defined as the ratio of laser pulse energy over the irradiated area. The investigated range was from 0.4 J.cm-2 up to 3.5 J.cm-2. Figure 4 represents the evolution of the surface temperature as a function of
time for the various fluences. The simulation was evaluated over a time of 40µs, which corresponds to the period between two pulses of the IR laser.
Fig. 4. CGO surface temperature as a function of time with a pulse (100ns) of the IR laser (left: whole simulation duration, 4.10-5 s, right: zoom on the first microsecond)
As a first result, it can be observed that the surface temperature of the sample increases significantly when the fluence increases. From a fluence close to 2 J.cm-2, the maximum temperature begins to
exceed the melting temperature of the CGO (2600 °C [23,24]) and above 2.5 cm-2, it can reach
vaporization (3500°C [24]). Therefore, for fluences above 2 J.cm-2, it should be necessary to consider
phase changes in the model.
For all experiments, it is found that the sample does not have time to return to ambient temperature at the end of the simulation period, which is explained by the low thermal conductivity of CGO [17]. If a second pulse is applied, the initial temperature of the sample will be no longer the ambient temperature. Therefore, the surface temperature during the second pulse will be higher. This phenomenon will be simulated in the last part of this paper.
Figure 5 shows the maximum temperature reached by CGO as a function of depth in the electrolyte coating. These temperatures were reached for a time of 2.2 × 10⁻⁷ s, as seen in figure 4.
The figure 5 points out that fusion or even vaporization temperature of CGO material is reached with highest laser fluences and it can concern the first 2 μm of the layer.
In order to confirm this result, SEM observations have been made on samples treated with such high fluences. Figure 6 shows the SEM image of the CGO layer exposed to a fluence of 3.5 J.cm-2. It reveals
that CGO surface appears to have been melted. However, the modifications are not homogeneous, which is probably due to inhomogeneity in the laser beam or in the material, or also to the possible vaporization of some part of the material. Below 2.5 J.cm-2, no surface modification was observed, in
Fig. 5. Temperature profile at 2.2 x 10⁻⁷ s of CGO layer treated with a single pulse of an IR laser
Fig. 6. SEM micrographs of CGO treated with a single pulse of an IR laser with 3.5 J.cm-2
4.2.2 Multi pulses annealing
Only single laser pulse annealing was considered in the previous part of the paper. A simulation with consecutive pulses has been developed to be more suitable with experimental developments of laser annealing.
In order to simulate successive pulses during laser annealing, the Gaussian function q(t) defining the temporal profile of the pulse must be repeated periodically over time. As mentioned before, the corresponding time between two successive pulses of the IR laser is 4.10-5 s.
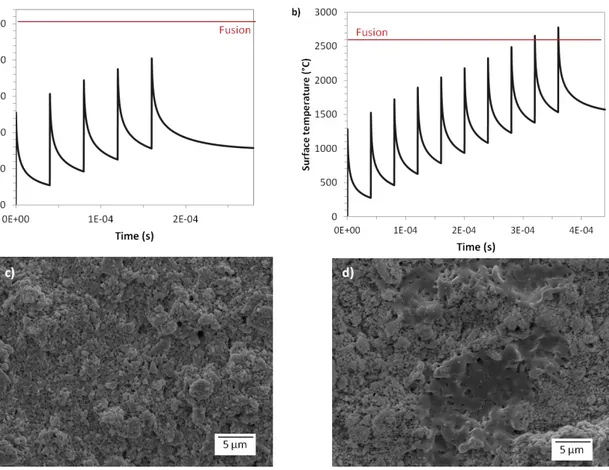
Figure 7 shows the results obtained with 5 and 10 laser pulses with a fluence of 0.9 J.cm-2. These results
show the accumulation of heat in the material between each laser pulse. CGO does not return to the initial temperature, so that the maximum surface temperature for successive pulses continuously increases.
The simulation results are consistent with microscopic surface observations. With a single laser pulse at 0.9 J.cm-2, the maximum temperature is close to 1400°C (Figure 4), while with 5 pulses the
temperature reaches 2025°C (Figure 7a). These temperatures are lower than the melting temperature and no surface change is observed (Figure 7c). However, with 10 pulses, the maximum temperature reached in the simulation is 2523°C (Figure 7b), a value very close to the melting temperature. Indeed, some surface changes are observed (Figure 7.d) indicating melting of the surface in a consistent way with simulation results.
Fig. 7. CGO samples annealed by the IR laser with a laser fluence of 0.9 J.cm-2: Thermal simulation
results with a) 5 laser pulses, b) 10 laser pulses, and SEM micrographs of CGO surface treated by c) 5 laser pulses, d) 10 laser pulses
5. Conclusions
The objective of this paper was to bring a comprehensive and quantitative simulation of laser matter interaction which can be used for localized thermal annealing of material, like for SOFC electrolyte in this paper. The numerical resolution of heat equation adapted to thermal and optical properties of the considered material (CGO) allowed the simulation of the temperature profile over time and material depth, depending on the fluence of an IR pulsed laser. Experimental observations by SEM of CGO surface modifications were consistent with the simulation results, regarding maximum temperature leading to the fusion of the considered material. The optical properties of CGO material were reported as a function of temperature. The additional improvement of the present simulation taking into account phase changes (fusion, vaporization) is under way to simulate more accurately real phenomena occurring during laser annealing at high fluences.
Acknowledgements
This work was supported by the LABEX MANUTECH-SISE (ANR-10-LABX-0075) of Université de Lyon, within the program "Investissements d'Avenir" (ANR-11-IDEX-0007) operated by the French National Research Agency (ANR). This work was also performed within the framework of the EQUIPEX MANUTECH-USD (ANR-10-EQPX-36-01) operated by the French National Research Agency (ANR).
References
[1] M. Kuhn, T.W. Napporn, Single-Chamber Solid Oxide Fuel Cell Technology – From its Origins to Today’s State of the Art, Energies. 3 (2010) 57–134.
[2] T. Suzuki, P. Jasinski, V. Petrovsky, H.U. Anderson, F. Dogan, Performance of a Porous Electrolyte in Single-Chamber SOFCs, J. Electrochem. Soc. 152 (2005) A527.
[3] D. Rembelski, M. Rieu, L. Combemale, J.P. Viricelle, In situ reduction and evaluation of anode supported single chamber solid oxide fuel cells, J. Power Sources. 242 (2013) 811–816.
[4] J.-P. Viricelle, S. Udroiu, G. Gadacz, M. Pijolat, C. Pijolat, Development of Single Chamber Solid Oxide Fuel Cells (SCFC), Fuel Cells. 10 (2010) 683–692.
[5] M. Mariño, M. Rieu, J. Viricelle, F. Garrelie, Laser induced densification of cerium gadolinium oxide:Application to single-chamber solid oxide fuel cells, Appl. Surf. Sci. 374 (2015) 370–374.
[6] M. Morales, S. Piñol, M. Segarra, Intermediate temperature single-chamber methane fed SOFC based on Gd doped ceria electrolyte and La0.5Sr0.5CoO3-δ as cathode, J. Power Sources. 194 (2009) 961–966.
[7] M.G. Chourashiya, S.R. Bharadwaj, L.D. Jadhav, Synthesis and characterization of electrolyte-grade 10%Gd-doped ceria thin film/ceramic substrate structures for solid oxide fuel cells, Thin Solid Films. 519 (2010) 650–657.
[8] C. Kleinlogel, L.J. Gauckler, Sintering and properties of nanosized ceria solid solutions, Solid State Ionics. 135 (2000) 567–573.
[9] J. Van herle, T. Horita, T. Kawada, N. Sakai, H. Yokokawa, M. Dokiya, Low temperature fabrication of (Y, Gd, Sm)-doped ceria electrolyte, Solid State Ionics. 86-88 (1996) 1255–1258.
[10] J. Ma, T.S. Zhang, L.B. Kong, P. Hing, S.H. Chan, Ce0.8Gd0.2O2-δ ceramics derived from commercial submicron-sized CeO2 and Gd2O3 powders for use as electrolytes in solid oxide fuel cells, J. Power Sources. 132 (2004) 71–76.
[11] C.S. Sandu, V.S. Teodorescu, C. Ghica, B. Canut, M.G. Blanchin, J. a. Roger, A. Brioude, T. Bret, P. Hoffmann, C. Garapon, Densification and crystallization of SnO2:Sb sol-gel films using excimer laser annealing, Appl. Surf. Sci. 208-209 (2003) 382–387.
[12] E.D. Tsagarakis, C. Lew, M.O. Thompson, E.P. Giannelis, Nanocrystalline barium titanate films on flexible plastic substrates via pulsed laser annealing, Appl. Phys. Lett. 89 (2006) 23–25.
[13] Y.-R. Chen, C.-H. Chang, L.-S. Chao, Modeling and experimental analysis in excimer-laser crystallization of a-Si films, J. Cryst. Growth. 303 (2007) 199–202.
[14] I.A. Palani, N.J. Vasa, M. Singaperumal, Crystallization and ablation in annealing of amorphous-Si thin film on glass and crystalline-amorphous-Si substrates irradiated by third harmonics of Nd3+:YAG laser, Mater. Sci. Semicond. Process. 11 (2008) 107–116.
[15] I. Theodorakos, I. Zergioti, V. Vamvakas, D. Tsoukalas, Y.S. Raptis, Picosecond and nanosecond laser annealing and simulation of amorphous silicon thin films for solar cell applications, J. Appl. Phys. 115 (2014) 043108.
[16] D. Bäuerle, Laser Processing and Chemistry, 3rd edition, 2000.
[17] F. Brygo, Etude de l’interaction laser - matière appliquée à la décontamination de peintures, PhD thesis, Université de Bourgogne, 2005.
[18] A.N. Samant, N.B. Dahotre, Laser machining of structural ceramics-A review, J. Eur. Ceram. Soc. 29 (2009) 969–993.
[19] V. Mangalaraja, S. Ananthakumar, M. Paulraj, K. Uma, M. López, P. Camurri, E. Avila, Electrical and thermal properties of 10 mol% Gd3+ doped ceria electrolytes synthesized through citrate combustion technique, Process. Appl. Ceram. 3 (2009) 137–143.
[20] J. Huang, Y. Li, G. Song, X. Zhang, Y. Sun, X. He, S. Du, Highly enhanced infrared spectral emissivity of porous CeO2 coating, Mater. Lett. 85 (2012) 57–60.
[21] E. Ruiz-Trejo, The optical band gap of Gd-doped CeO2 thin films as function of temperature and composition, J. Phys. Chem. Solids. 74 (2013) 605–610.
[22] T. Suzuki, I. Kosacki, V. Petrovsky, H.U. Anderson, Optical properties of undoped and Gd-doped CeO2 nanocrystalline thin films, J. Appl. Phys. 91 (2002) 2308–2314.
[23] R.J.M. Konings, O. Beneš, A. Kovács, D. Manara, D. Sedmidubský, L. Gorokhov, V.S. Iorish, V. Yungman, E. Shenyavskaya, E. Osina, The Thermodynamic Properties of the f-Elements and their Compounds: Part 2. The Lanthanide and Actinide Oxides, J. Phys. Chem. Ref. Data 43. 43 (2014) 013101.
[24] Y.A. Kotov, V. V. Osipov, M.G. Ivanov, O.M. Samatov, V. V. Platonov, V. V. Lisenkov, A.M. Murzakayev, A.I. Medvedev, E.I. Azarkevich, A.K. Shtolz, O.R. Timoshenkova, Properties of YSZ and CeGdO nanopowders prepared by target evaporation with a pulse-repetitive CO2-laser, Rev. Adv. Mater. Sci. 5 (2003) 171–177.