HAL Id: dumas-01102590
https://dumas.ccsd.cnrs.fr/dumas-01102590
Submitted on 13 Jan 2015HAL is a multi-disciplinary open access archive for the deposit and dissemination of sci-entific research documents, whether they are pub-lished or not. The documents may come from teaching and research institutions in France or abroad, or from public or private research centers.
L’archive ouverte pluridisciplinaire HAL, est destinée au dépôt et à la diffusion de documents scientifiques de niveau recherche, publiés ou non, émanant des établissements d’enseignement et de recherche français ou étrangers, des laboratoires publics ou privés.
Are Intuitive Decisions Always Disadvantageous? A
study of response time in decision-making under risk
Manon Lecomte
To cite this version:
Manon Lecomte. Are Intuitive Decisions Always Disadvantageous? A study of response time in decision-making under risk. Economics and Finance. 2014. �dumas-01102590�
Université Paris 1 – UFR 02 Sciences Economiques
Université Paris 5 – Paris Descartes
Master 2 Recherche “Economics and Psychology”
Master Thesis
Are Intuitive Decisions
Always Disadvantageous?
A study of response time in decision‐making under risk
Written and presented by Manon LECOMTE
Supervisor: Louis Levy‐Garboua
Jury members: Franck Zenasni and Jean Christophe Vergnaud
June 2014
WARNING
« L’université de Paris 1 Panthéon-Sorbonne n’entend donner aucune
approbation, ni désapprobation aux opinions émises dans ce mémoire ; elles
doivent être considérées comme propre à leur auteur »
TABLE OF CONTENTS ACKNOWLEDGMENTS ... III ABSTRACT ... IV 1) INTRODUCTION ... 1 2) THEORETICAL BACKGROUND ... 2 2.1)WHAT IS INTUITION? ... 2
2.2)DUAL PROCESS THEORIES ... 4
2.3)INTUITION AND HEURISTICS ... 5
2.4)INTUITIVE THINKING IN DECISION-MAKING ... 6
2.5)INTUITION AND RESPONSE TIME ... 7
3) HYPOTHESES AND OVERVIEW OF THE STUDY ... 8
4) EXPERIMENTAL DESIGN ... 9
4.1)SAMPLE AND PROCEDURE ... 9
4.2)REMUNERATION TREATMENTS ... 13
4.3)COMPLEMENTARY MEASURES ... 14
5) ANALYSIS AND RESULTS ... 15
5.1)GENERAL DESCRIPTIVE STATISTICS AND SAMPLE DESCRIPTION ... 15
5.2)ANALYSIS AND DETERMINANTS OF RESPONSE TIME ... 16
5.3)PREDICTION OF RESPONSE TIME ... 19
5.4)RELATIONSHIP BETWEEN GAINS AND INTUITIVE THINKING ... 20
6) DISCUSSION ... 23
7) CONCLUSION ... 26
BIBLIOGRAPHY ... 28 ANNEXES ... I
ACKNOWLEDGMENTS
I would like to express my deepest appreciation and thanks to my advisor Professor Louis LEVY-GARBOUA for introducing me to the topic and for the priceless comments and remarks during the course of this master thesis. I would also like to thank Professor Jonathan VAKSMANN and Marco GAZEL for sharing their time and expertise as well as their brilliant ideas and advice.
A special thanks to fellow students Luc SEARLE, Simon CANTAREL, and Matthieu PLONQUET, who very patiently helped, supported and encouraged me during this entire process. Words cannot express how grateful I am for all the help you brought me.
Finally, I would like to thank my mom, who even from far away supported me and continued to give me precious motherly advice that helped me through stressful times. I will always be grateful for your love.
ABSTRACT
Intuition is a fast expanding topic in today's economic and psychological literature.
However, no consensus has been reached concerning its value in decision making. To
investigate the relevance of intuitive choices in decision-making under risk, we
conducted an experiment on 154 French high-school students from 3 different
academies in the Ile-de-France department. Using response time as a proxy for
intuition, we found that on average decisions made intuitively yielded results as
1) INTRODUCTION
“Listen to your intuition. It will tell you everything you need to know.” Anthony J. D'Angelo
When it comes to decision-making, most people automatically assume that careful and systematic analyses lead to better choices and outcomes than do intuitive decisions. In our everyday lives, when facing a choice, we are often advised to take our time, to think about it. Who hasn’t heard a well-meaning parent or friend pronounce a phrase such as “you should sleep on it” or “you should never rush a decision”? There seems to be a universal view suggesting that time is always positively correlated with the quality of the decisions one makes. It is a notion inculcated since childhood by parents and the educational system alike. Children, then teenagers, are often encouraged to slow down their decision process, to avoid making rushed decisions. But are slower decisions always more profitable than faster ones?
Every day, every single one of us is confronted with hundreds of decisions. Some are trivial, like picking the color of a shirt to wear or deciding which route to take to go to work, and other are more important, like making a significant investment or deciding of the course of a medical treatment. But most of the time we do not even realize we are making decisions. We do not think about them, we do not rationalize or ponder them, we just make them instinctively, intuitively. And in the vast majority of cases, they are satisfying.
Dozens of examples are included in literature and across many domains in which extremely beneficial decisions are made quickly, intuitively, and which could only be explained or rationalized a posteriori. But the same literature also highlights the systematic biases of such instinctive decisions. (e.g. Kahneman, 2011) This dichotomy piqued our interest and pushed us to further examine the subject.
This paper attempts to tackle the question of response time in decision-making under risk. It aims to further investigate the relationship between the amount of time spent by an individual on a choice and its yielded result. By doing so, we hope to make a small contribution in answering the question: Are slower decision always superior to faster ones? With this in mind, we will first strive to give the reader an overview of the mechanisms, role and value of intuition in decision making in the available literature. Subsequently, we will expose and discuss our own findings, gathered via an original study conducted by our research team on French teenagers.
2) THEORETICAL BACKGROUND
2.1) What is intuition?
We know it by many names: gut feeling, hunch, a sixth sense or even a burst of genius. Intuition is a complex concept that plays a role in nearly every domain of our lives. It is often described in layman’s terms as an inexplicable feeling of doing the right thing or making the right decision. The Oxford dictionary defines it as “the ability to understand something instinctively, without the need for conscious reasoning”.
However, in the literature, the definition of intuition is not as straightforward, and a consensus is still to be reached. Indeed, intuition has been given countless definitions, and even within a same field, the lack of a universal description is still a cause of debates (Epstein, 2008). In fact, Winerman (2005) reports that depending on the author, intuition can be considered in turn, as a process, a brain structure or even a source of knowledge.
If intuitive thinking constitutes a prized subject for research in psychology and in economics today, its development started a long time ago. Indeed, back in 1923, the famous psychiatrist
and father of analytical psychology Carl Jung was already working on intuition. Jung was describing it as an unconscious perception of realities. But the concept also started to interest science rather early. In 1989, A.C. Ross had already discovered that at neurological level, intuitive thinking was activating the right hemisphere of the brain while rational and factual thinking were activating the other hemisphere.
Many authors gave their own definition of intuition. In 1994, Damasio described it as a “sort of rapid cognitive process in which we come to a particular conclusion without being aware of all the immediate logical step (…) a rapid cognition with the required knowledge partially swept under the carpet1”. He also added that the quality of intuition was dependent of past reasoning, previous classification of the event, previous link with emotion of the event and reflection on the outcomes of our past intuitions.
Bolte and Goschke (2005) defined it “as the ability to make above-chance judgments about properties of a stimulus on the basis of information that is activated in memory but not consciously retrieved. Intuition is thus not some special or even mysterious capacity, but is rather based on preexisting knowledge that may guide decisions and judgments without being accessible to conscious awareness”2.
To summarize, intuition is a fast and subconscious process that will compress our previous experience and knowledge in a matter of seconds. (Isenberg, 1984 and Seebo, 1993) It should not be opposed to reason, as it does not constitute a random guessing process but a tool allowing us to synthesize past experiences and data into a single picture (Khatri, 2000). It is a form of intelligence at a level inaccessible with our rational thought (Parikh, 1994).
1 Damasio, 2008, preface 2 Bolte and Goschke, 2005, p 1248
2.2) Dual process theories
Many researchers split the processes of thinking into two main categories. Several models of Dual process can be found in literature. Each model has its own specificities, but they all advocate for a two-system view distinguishing intuition from reasoning. (e.g. Betsch and Glöckner, 2008; Evans, 2006; Gilovich, Griffin and Kahneman, 2002 ; Kahneman, 2003 ; Sloman, 2002). These two types of cognitive processes are labeled under different names by different authors. We can cite here the famous System 1 and System 2 coined by Stanovich and West (2000) or the Intuitive and Analytic processes used by Betsch (2008). No matter their labels, in most models the two cognitive systems are distinctively separated. While the first system is operating in an automatic, rapid, implicit, effortless, associative and emotionally charged manner, on the other hand, the second system is slower, rule-based, deliberately controlled and needs the use of more efforts. (Kahneman, 2003).
In addition, Glöckner and Betsch (2010) describe the Intuitive process as autonomous, unconscious, not easily accessible by introspection, and able to process several pieces of information at once. Concerning the Analytic process, they described it as a step-by-step conscious procedure. Furthermore, a major part of the most influential Dual process theory models claim that both modes of thinking are operating together and are complementary in forming judgments and decisions. They posit that the Intuitive process is responsible for a context-dependent representation of the information, while the Analytic process is responsible for a more detailed and deliberate assessment of the information. However, the initial response produced by the Intuitive process is not always followed by the assessment of the Analytic process (Kahneman, 2003; Stanovich, 2004; Sloman, 2002) and to this day, none of the Dual process theory models clearly determined to what extent and in which cases one or the other occurs (Thompson, Turner and Pennycook, 2011).
2.3) Intuition and heuristics
A number of extremely influent approaches such as the one of Gilovich, Griffin and Kahneman (2002) tend to tightly associate or even equate intuition and heuristic processing (Betsch and Glöckner, 2008). These approaches advocate that individuals often apply simple rules and readily accessible information in order to form judgments and make decisions when they are facing a complex problem. (Gigerenzer, 1991). Different types of heuristics, representing different information-processing shortcuts, are reported in the literature. They all have in common a selective process of information and a reduction of the cognitive efforts one needs to produce. We could cite here a few examples such as Tversky and Kahneman’s Availability heuristic (1973), which makes the decision-maker estimates the probability or the likelihood of an event based on his readily available knowledge rather than by careful examination and analysis of the situation; Gigerenzer and Goldstein’s Recognition heuristic (1996), which makes the individual attribute a higher value to an object he recognizes than to one he does not; or even Jacoby and Brooks’ Fluency heuristic (1984) which makes the decision-maker attribute a higher value to an object if it can be easily and smoothly processed.
According to Kahneman and Tversky (1982), the main goal of the use of heuristics is to drastically reduce one’s cognitive efforts. And even if they can sometimes lead to biases or non-optimal decisions, in most cases, they allow for satisfactory, relevant and advantageous decisions and judgments. (Gigerenzer, 1991)
Another stream of the literature, including authors such as Betsch (2005) or Betsch and Glöckner (2010), support a different view concerning intuition and heuristic. They argue that heuristics do not enclose the full potential of intuitive thinking and that many of them are mere over-simplification of the concept. They claim that intuitive thinking is far more elaborated than what Tversky and Kahneman (1973) defined as the reduction of a complex
judgment to a simpler one. Furthermore, they argue that “intuition is capable of dealing with complex tasks through extensive information processing without noticeable effort.”3
2.4) Intuitive thinking in Decision-making
Intuitive thinking, and its role and relevance in decision-making, is a booming field amongst researchers. (e.g. Burke and Miller, 1999 ; Glöckner & Betsch, 2008; Khatri and NG, 2000 ; Miller and Ireland, 2005) Yet, in a large body of work, intuitive actions are viewed as irrational (Prietula and Simon, 1989). But this assumption has recently started to be questioned in the literature (Khatri 2000; Kahneman 2003). The value of intuitive thinking has become a hot topic especially in the field of strategic decision making (e.g. Betsch and Glöckner, 2010; Dijksterhuis, 2004; Miller and Ireland, 2005). Authors such as Simon (1984), and Khatri (2000) argue that when it comes to decision-making, both rational and intuitive processes have to be taken into account. Furthermore, other researchers add that under certain conditions, intuitive decisions can be more effective than reasoned ones (Damasio, 1994; Mikels et all, 2011).
Recently, authors such as Kahneman (2003), Slovic et al (2002) or Mikels et al (2011) have highlighted the potential positive effect of intuition judgment on decision-making. In a series of experiments on the role of conscious and unconscious thought in decision making, Dijksterhuis (2004) established that participants who were not given any time to make a decision (unconscious thinkers) were making more favorable choices than participants who were given a few minutes to make their decision (conscious thinkers).
In 2013, Rubinstein conducted a study involving some of Game theory’s most classic problems such as “count the Fs “ or “The Wason experiment”. On this occasion, he observed that participants with an answer time shorter than the median tended to make more mistakes
than slower participants. However, when it came to the comparing pairs of alternatives, this effect was inversed and individuals with response times under the median tended to make less mistakes and violated transitivity less than others.
2.5) Intuition and response time
Speed is one of the few critical features used by researchers to differentiate intuitive from analytic decisions (Bolte and Goschke, 2005). Authors such as Evans and Curtis-Holmes (2005) or Tsujii and Watanabe (2010) consider that rapid responses from participants are more likely to be based on intuition as opposed to slow responses, as they would not have had time to be contaminated by the analytic process.
In the literature of economic decisions, only a small proportion of studies are reporting response times as they are usually conducted on small samples (Rubinstein, 2007). Rubinstein (2007) posits that analytic choices, which involve greater cognitive processing, will result in significantly extended response time compared to intuitive choices. However, he also introduces the notion of “reasonless” which he defines as “an action, which is likely an outcome of a process involving little or no reasoning.”4 Yet, he does not delimit a threshold to enable the systematic consideration of choices as one or the other, but does it in an intuitive manner instead.
Furthermore, not all experiments rely on the same methods when it comes to measuring intuitive thinking using response time. Indeed, while some experiments simply record participants response time (e.g. Piovesan and Wengström, 2008), others use manipulations such as time pressure to force participants to rely on intuition (e.g. Austin, 2009; Evans, Dillon and Rand, 2014).
3) HYPOTHESES AND OVERVIEW OF THE STUDY
If more and more authors adhere to the idea that decisions made intuitively can be adapted and even satisfying under certain circumstances, a cleavage still exists. This scission is even greater when it comes to tasks that have not already been mastered by the individual. Our question is the following: Can decisions made intuitively lead to outcomes as satisfying, or even more so, than decisions made analytically, even when it comes to an elaborated and novel task?
The main goal of this research is to observe if intuitive choices can lead to advantageous outcomes in decisions under risk.
Grounding ourselves on the previously exposed literature, we hypothesize that slower analytic responses should not yield more advantageous outcomes than faster intuitive choices. Furthermore, we also hypothesize that after a period of “learning”, when participants had some time to familiarize themselves with the task, faster intuitive answers should be more profitable than answers with a slower response time.
The experiment detailed in this paper was originally conceived to investigate learning under risk. Initially conceived by Professor Louis Levy-Garboua, this study conducted on adolescents originally aimed to investigate the determinants and evolution of choices in multiple series of binary lotteries. The fact that the experiment was carried out on teenagers in their first year of high-school could raise the question of its generalization to a larger population. However, several studies showed that not only adults and teenagers have approximately the same cognitive skills (Jacobs and Klaczynski, 2005; Reyna and Farley, 2006), but also that, like adults, adolescents understand and “use the full range of probability values” (Fischhoff et al., 2000). Furthermore, research failed to prove deficiencies in teenagers’ decision making under risk (Shulman and Cauffman, 2014).
4) EXPERIMENTAL DESIGN
4.1) Sample and procedure
This experiment was conducted in the laboratory of the “Maison des Sciences Economiques de Paris”. 9 sessions were implemented over the course of 3 days. 3 academies participated in the study, namely Paris, Versailles and Creteil. Participants were students currently enrolled in class of “seconde” of one of the aforementioned academies. Each day was dedicated to a different academy. Each session required 20 participants and lasted between 50 minutes and 1 hour. In sessions where the 20 participants requirement was not met, virtual players were included to bridge the gap. Evidently, data from virtual players were not added to the analysis.
Overall, 154 subjects aged between 14 and 18 years partook in the experiment. (about 92% of them were either 15 or 16 years old.) 56 participants belonged to the Academy of Creteil, 56 to the Academy of Paris and 42 to the Academy of Versailles.
The experiment was constructed around 3 main stages detailed thereafter:
First stage: Holt and Laury’s task
Firstly, we measured risk aversion using an adaptation of Holt and Laury’s (2002) lotteries. It consisted in 10 binary choices. In each row, there is an increase in the possibility to receive a larger payoff. This particular task was selected for two main reasons. First, the task is rather easy to implement and to adapt to a younger public. Second, it is a well-established measure of risk aversion (Lönnqvist et al 2010) used by many researchers in the literature. Several articles attest of the validity of this measure by finding comparable proportions of risk-averse, risk-neutral and risk-loving individuals as with Holt and Laury’s task (e.g. Harrison et al 2007; Dohmen et al 2011).
Participants were informed that after the completion of the task in its entirety, one of their choices would be randomly selected and that the result would constitute their payoff. In order to separate this phase from the next one and to avoid any influence of previously acquired gains on the rest of the experiment, participants were playing for fixed amounts of candy. Nevertheless, the repartition of payoffs and probabilities strictly respected the original version’s (currency payoff) and was known by participants. (See Annex 1 for a visual representation of the task proposed.)
Second stage: Binary Lotteries selection
Once the Holt and Laury’s task was completed, the subjects had to respond to 96 pairs of lotteries, each presented independently. For each pair, the subject had to select one of the two lotteries presented. Once the choice made, the selected lottery was automatically drawn and the participant informed of his outcome. The outcome was presented in the form of points that were cumulated throughout the exercise. The more points they won, the more likely they were to obtain a higher recompense at the end of the task. Participants were unaware of the overall number of choices they had to make.
There were a total of 8 categories of lotteries, presented chronologically to the subjects. The latter four were built in a similar fashion to the former four, with slight variations in the gains and/or probabilities. Each independent category had a total of twelve choices. Subjects were not told of the repartition of the categories and within each one, the order of the lotteries was random.
Part of the lotteries presented was constructed on the model of decision under risk developed by Kahneman and Tversky: Prospect Theory. In a their famous article dating from 1979, Kahneman and Tversky described different choice problems in which decision makers systematically violate Expected Utility axioms. Using simple experiments, they demonstrated that under certain circumstances, people systematically violate predictions of Expected Utility
theory. Their model predicts that, under some conditions, individual may in fact choose the dominated option. They observe for example, that people overweight outcomes they consider as certain or that risk aversion in the positive domain is accompanied by risk seeking in the negative domain. Barberis (2013) judges that even after over 30 years of existence, prospect theory is still one of, if not the best available description of how individuals evaluate risk in an experimental setting. Furthermore, Kachelmeier and Shehata (1992) and Post and al (2008) found that prospect theory still provides an accurate description of individuals behavior even under high financial incentives.
Following this model, lotteries testing for effects such as: Certainty effect (as in the Allais lotteries, 1953), Isolation effect and Reflection effect, were included to the experiment.
Categories were built as follows: Category 1: A risky option versus a certain or almost certain one (probability ≥ 0.9).
Category 2: A risky option versus a slightly less risky option
Category 3: A conflation of the two aforementioned categories, in which it is harder to maximize gain expectancy.
Category 4: A mirror version of category 3, framed in terms of loss. (Here, the same lotteries are used, with gains replaced by losses.)
Categories 5, 6, 7 and 8 were built on the same models as the first four, with slight changes in probabilities and/or gains. All the lotteries used in this experiment are presented in the annexes. (Cf. Annex 2)
Third stage: Personality Test
After finishing the binary choices task, participants were asked to complete a Big-Five personality test, which determines five main personality traits.
Personality was defined by Michel, Shoda and Smith (2004) as the individual differences amongst people in pattern of behavior, emotion and cognition.
The Five-Factor Model of personality (FFM or Big-Five) was selected as it is one of the most widely used and recognized models in the literature (John & Srivastava, 1999; Pervin, 1994). FFM is a hierarchical organization of personality traits divided in 5 basic bipolar dimensions: Openness to experience, Agreeableness, Conscientiousness, Extraversion and Neuroticism. Authors such as Lauriola and Levin (2001) or Studer and Clark (2011) found links between personality traits and decision-making under risk.
Furthermore, the Big-Five has been associated with learning, and in particular with the way of learning (Busato et al, 1998; Zhang, 2003) but it also has been recognized as a determinant of the motivation to learn. (Komarraju and Karau, 2005; Major, Turner and Fletcher, 2006) Those findings motivated our choice to include a personality test to the design.
Participants were presented a computerized version of the questionnaire from Barbot (2012) called The Brief Big Five (BB5). This questionnaire was selected as it uses the FFM hierarchy and is targeted for teenagers.
Participants were presented with different characteristics and instructed to rate the extent to which each one applied to them using a 7 points Likert scale ranging from “I strongly disagree” to “I strongly agree”
Forth stage: Short survey
After the completion of the BB5, participants were required to fill a short questionnaire about a number of personal information including their age, gender or favorite topic in school.
4.2) Remuneration Treatments
Three different remuneration treatments were implemented. They consisted in a difference in the mode or in the amount of the incentive for the second stage of the experiment. Stage 1 and 3 remained the same for all treatments. Subjects were assigned to one of the three treatments and were informed about the nature, amount and modalities of the incentive of each phase of the experiment in a clear manner. The three treatments were constructed to reflect the academic evaluation system, and are detailed thereafter:
1. Tournament: In this setting, subjects were ranked from first to last, relative to the points they obtained during the experiment. Participants were informed of their current rank on several occasions during the experiment. Subject were informed that in any case, they would acquire one of the two available prizes, which was a 10€ or a 30€ gift card. The higher was the rank, the higher was the probability of obtaining the best prize. The subject ranked the first had the highest probability (95%) of winning the best recompense (a 30€ gift card). The twentieth had no chance of obtaining the said card, earning the 10€ card instead. Participants were informed of their rank after every 12th choice, and of their final rank at the end of the task. This setting provided a benchmark for the point grading system in the following two treatments.
2. High Incentive/Grades: In this setting, participants were given grades ranging from 0/20 to 19/20 based on the points they obtained throughout the session. Several participants could get the same grade. Subject knew they were participating for a chance to win either a 10€ gift card or a 30€ gift card. An increase in points supposed a linear increase in the probability of earning the best recompense. As in the previous treatment, participants were informed of their overall score every 12th choice and were given a final grade at the end of the task.
3. Low Incentive/Grades: In this treatment, the incentive system was rigorously the same as in the High Incentive/Grade treatment. Only the amount of the possible prizes changed. Here, subjects were given a chance to win either a 15€ gift card or a 25€ gift card.
4.3) Complementary Measures
Feedback and counterfactual
In the three remuneration treatments, for each of the 96 binary choices of the second phase, subjects received a feedback informing them of the outcome of the lottery they had selected. Additionally, for half of the choices, participants were also informed of the counterfactual (what the forgone option would have yielded if selected). For each subject, counterfactuals were randomly delivered either during the first or the second half of the task (for all the first or all the last 48 choices). The aim was to observe whether the type of feedback had an influence on the learning process of the exercise. Indeed, Stobart (2008) argues that feedback is “seen as a key to moving learning forward” and Hattie (1999) demonstrates that the most useful type of feedback comes in the form of computer-assisted instructional feedback. Furthermore, Van der Kleij & al. (2012) distinguish computer-based assessment in contrast to more traditional means: a computer environment gives the ability to provide feedback while the test is being issued. Hattie & Timperley (2007) state that in a CBA environment, an immediate solution is provided to the potential discrepancies between the subject’s present state and the desired learning outcome, which is not a characteristic inherent to more traditional environments “feedback is one of the most important influences on learning and achievement”.
Response time
Unbeknownst to the subjects, all choices of phase 2 were timed. For each choice, two recordings were made. The first one recorded the number of seconds between the apparition of the lottery choice on the participant’s screen and the selection of one of the two options presented. The second one was recording the number of seconds between the apparition of the lottery choice on the participant’s screen and the moment the participant manually sent his answer to the server.
Satisfaction
During the second phase, every twelfth choice and after being informed of their grade or rank, participants were asked to report their level of satisfaction concerning the global outcome of the previous sequence. The rating was made on a 10 points Likert scale ranging from “Not satisfied at all” to “Completely Satisfied”. Furthermore, at the end of the task and using the same scale, subjects were asked to rate their level of satisfaction concerning their global performance on all of the 96 choices made.
Additionally, they were asked to rate their perceived difficulty of the task using a 7 points Likert scale ranging from “Not difficult at all” to “Very difficult”.
5) ANALYSIS AND RESULTS
5.1) General descriptive statistics and sample description
Our sample was composed of 154 subjects aged between 14 and 18 (92,2 % of the sample was between 15 and 16 years old). 53.25 % of participants were females and 46.75% were males. The repartition of subjects by academy was also balanced: 36.36% were from the Academy of Creteil, 36.36% were from the Academy of Paris and 27.27% from Academy of
Versailles. Participants were divided into the three remuneration treatments the following way: (C.f. Table 1)
Table 1:
Tournament Grade/ H. Incentive Grade/ L. Incentive Total
N 49 53 52 154
Female 28 25 29 82
Male 21 28 23 72
Mean Age 15.46 15.34 15.44 15.41
Table 1 shows the distribution of participants over treatments
Concerning the measure of risk aversion effectuated and calculated with the Holt and Laury’s task, A first analysis showed that 81.72%, of our sample could be considered as Risk-Averse, 11,83% could be considered as Risk-Neutral and 6,45% as Risk-Seeking. Furthermore, we observed that on average, male participants made fewer safer choices than female participants, but this finding was only significant at p< .1. These figures seem to be coherent in regard to the available literature. (Cf. Dohmen et al, 2011; Holt and Laury, 2002). However, it is important to point that 39.69% of our sample did not meet the “one switch or less” coherence criterion for the Holt and Laury’s task.
Results of the BB5 did not reveal any significant gender difference. We will not present a detailed analysis of those results in this paper, as they will not be extensively used as an explanatory variable.
5.2) Analysis and determinants of response time
During the second phase of the experiment, each participant was asked to effectuate 96 binary choices of lotteries. This brings the total amount of choices collected to 14784.
To effectuate the following analyses, we opted to define response time (RT) as the number of seconds between the apparition of the lottery on the participant’s screen and the selection of
one of the two options. The overall average RT by lottery is of 5.68 seconds (SD = 5.06 and median = 4.34)
To obtain the following results, we used the log of the variable coding for the response time in order to obtain a normalized distribution.
Graphic 1:
Distribution of the Log of Response Time
The average log-transformed reaction time was 1.50 (SD = .66). It appears that male participants answered slightly faster their female counterparts (M = 1.52 ; SD = .66 for females and M =1.48 ; SD = .66 for males). This result is significant at p < .01.
Another significant time difference is observed between academies. With an average log-transformed RT of 1.46 (SD = .70), it appears that on average, participants from Creteil were responding faster than participants from Paris, who had a mean of 1,55 (SD = .63) and from Versailles, who had an average of 1,49 (SD = .63). These results are significant at p < .01 and p < .05 respectively. In addition, Participants from Versailles were responding significantly faster than participants from Paris. (p < .01)
We also observed significant differences between categories of lotteries. For example, it appears that overall, lottery choices of category 7 were answered faster than lottery choices of any other categories (p < .01). (See Table 2 for other differences and level of significance)
However, No significant difference in RT was found between the different risk attitudes. Table 2
Table 2 depicts the t-Test of response time over categories. Each number represents a different category.
Legend: ***= p < 0.01; **= p < 0.05; *= p < 0.1
Concerning treatments, we found that choices made in the Tournament setting (M = 1.48 ; SD = .64) and in the Low-Incentive Grade setting (M = 1.47 ; SD = .67) were significantly faster than the ones made in the High-incentive Grade setting (M = 1.55; SD = .66) at p < .01. However, no significant difference was found between the Tournament and the Low-Incentive Grade treatment.
Another finding was that lotteries framed in terms of losses were on average answered slower than lotteries framed in terms of gains. Indeed, the mean log-transformed RT for gain-framed lotteries was of 1.48 (SD = .66) while it was of 1.55 (SD = .66) for the loss-framed ones. (p < .01. )
Furthermore, we observed that the second half of the 96 lotteries (the last 48 lotteries presented to the subject) were answered faster (M = 1.39; SD = .64) than the first half (M = 1.61; SD = .66). This difference is also significant at p < .01.
However, we did not found any significant difference in RT between regular feedbacks and counterfactuals.
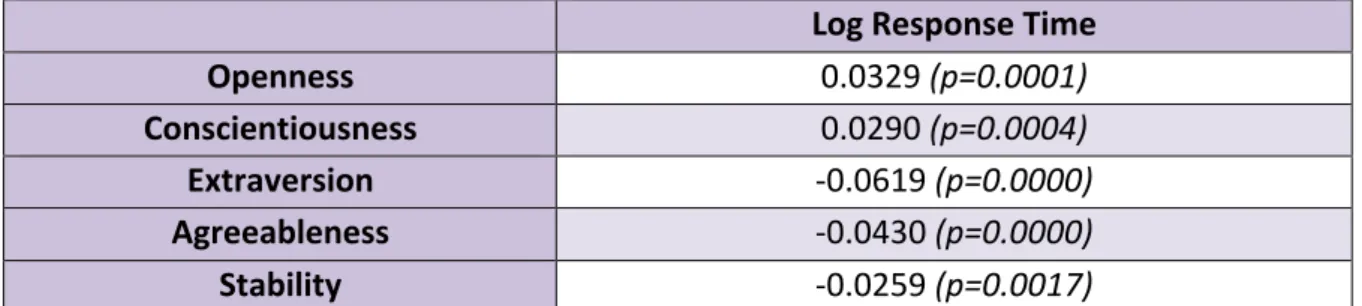
Finally, concerning the five traits of personality, we observed significant and positive correlations between the log-transformed RT and openness as well as conscientiousness, and
significant negative correlations between RT and Extraversion, agreeableness and stability. The results of these correlations are reported in Table 3. It is important to note that although significant, the correlations observed are extremely weak.
Table 3 Log Response Time Openness 0.0329 (p=0.0001) Conscientiousness 0.0290 (p=0.0004) Extraversion ‐0.0619 (p=0.0000) Agreeableness ‐0.0430 (p=0.0000) Stability ‐0.0259 (p=0.0017)
Table 3 depicts the correlations between Log of response time and the score of the 5 personality traits observed with the BB5.
5.3) Prediction of Response Time
In order to investigate further the determinants of RT, we proceeded to a simple OLS regression described by the following model:
Log Response Time =
ᵦ
0 +ᵦ
1(Creteil) +ᵦ
2(Versailles) +ᵦ
3(Age) +ᵦ
4(Agreeableness) +ᵦ
5(Conscientiousness) +ᵦ
6(Extraversion) +ᵦ
7(Openness) +ᵦ
8(Stability) +ᵦ
9(Sex) +ᵦ
10(GainFramed) +ᵦ
11(Tournament) +ᵦ
12(Low_Incentive) +ᵦ
13(SecondHalf) + uWhere:
- Creteil and Versailles are dummy variables coding 1 for the academies in question and are compared to Paris.
- The 5 variables detailing the personality traits are coding the scores obtained on the BB5 test for each of the traits.
- The variable Sex is a dummy variable coding 1 for Female.
- GainFramed is a dummy variable coding 1 when lotteries are framed in terms of gains . - Tournament and Low_Incentive are dummy variables representing the different treatments and are compared to the High Incentive/Grade treatment.
- SecondHalf is a dummy variable coding 1 for choices presented during the second half of phase 2 (from choice 49 to choice 96).
The complete output of the aforementioned regression can be found in Annex 3 of this document, and the main results observed are the following:
First, we observe that belonging to the academies of Creteil or Versailles (in contrast to the academy of Paris), predicts a shorter response time (p < .001).
Second, regarding personality traits, we found that scoring higher on Agreeableness or on Extraversion forecasts a reduced response time (p< .001), while a higher score on Openness or Conscientiousness has the opposite effect (p< .001). Yet, the score obtained for Stability does not seem to significantly predict RT.
Thirdly, Being a female (as opposed to male) foretell a longer response time (p< .001). However, age does not seem to be a significant predictor.
Furthermore, choices framed in terms of gains have a reduced RT compared to choices presented in terms of losses (p< .001). In addition, choices presented during the second half of the task as opposed to the first half are also found to be quicker (p< .001).
Finally, in comparison to the High Incentive/Grades treatment, the Tournament and Low Incentive/Grades settings appear to be predicting a shorter response time (p< .001).
5.4) Relationship between gains and Intuitive thinking
In order to investigate on our main question, we needed to determine a threshold defining under which time-criterion an answer could be considered as Intuitive. Searching the literature, we did not find any fixed threshold to help us define what could be considered as an intuitive response. In fact, the time limit under which a response can be consider as intuitive
vary greatly amongst authors and/or tasks. For example, authors such as Evans, Dillon and Rand (2014) use a 10 seconds threshold , Finucane et al. (2000) use a 5 seconds threshold, Shulman and Cauffman (2014) decided on 2.5 seconds and Rubinstein (2007) makes the classification intuitively depending on the case.
Basing ourselves on different studies, the nature of our task and the analysis of our data, we decided to fix our threshold at 4 seconds. Following this definition, we found that 44.64 percent of all observed choices were made intuitively (in 4 seconds or under). The remaining 55.36 percent of choices (made in more than 4 seconds) were then considered as analytic.
Our analysis yielded the following results:
Firstly, we observe that on average, choices made in 4 seconds or less returned a greater outcome than choices made in more than 4 seconds. As presented in Graphic 2, intuitive choices returned on average 191,21 points (SD = 407,94) while analytic choices yielded on average 138,32 points (SD = 422,652) and this difference is significant (z = -8.360, p = 0.0000).
Graphic 2:
Secondly, to go a little more into details, concerning lotteries presented in the first half of the task, we observed a statistically significant difference between the mean gains per lottery earned when the answer is given intuitively (M = 187.56 ; SD= 394.492) and when the answer is given analytically (M = 143.5071; SD = 413.978 ) with z = -4.299 and p = 0.0000. An even greater difference was observed for choices made during the second half of the exercise, where intuitive choices yielded on average 193.85 points (SD=417.40) and choices over 4 seconds returned on average 131.58 points (SD = 433.64). Again, this difference is statistically significant (z = -7.300, p = 0.000).
Furthermore, it also appears that not only are intuitive responses yielding higher outcomes than analytic ones when lotteries are framed in terms of gains (M = 324.14, SD = 309.36 and M = 303.42, SD=311.68 respectively ; z = -4.150 , p= 0.0000), but they also return smaller losses when lotteries are framed in terms of losses (M = -275.85, SD = 367.01 for answers given in 4 seconds and under; and M = -301.47, SD = 360.12 for choices made in more than 4 seconds; z = -2.321 , p= 0.0203)
When we decompose further those scores, we observe that concerning choices framed in terms of gains presented during the first half of the exercise, there is no significant difference in average gain per lottery between choices made analytically and choices made intuitively. However, the difference is significant when those lotteries are presented in the second half. Indeed, On average, when presented during the second half of the task, choices framed in terms of gains yielded 332.80 points (SD = 310.14) when answered intuitively, against 309.364 points (SD = 317.33) when answered in over 4 seconds. This difference is significant (z = -3.589, p = 0.0003).
Additionally, we observe the opposite pattern with lotteries framed in terms of losses. In fact, when presented during the first half of the task, choices made under 4 seconds returned a significantly more advantageous average than analytic choices (M= -239.27, SD = 359.09 and
M= -288.86 , SD =362.13 respectively; z = -2.304, p = 0.0212). However, the difference observed is not significant when these choices are introduced during the second half of the exercise.
Finally, when looking at each category of lotteries separately, it appears that a beneficial influence of intuitive responses as opposed to analytic responses can be observed for half of them. It is the case for categories 2, 4, 6 and 7. Yet, even if the differences are not significant for the other categories, we still observe more advantageous averages when choices are made under 4 seconds for almost all the categories.
Table 4
Response Time < 4 sec Response Time > 4 sec Difference
Mean SD Mean SD Z p Category 1 411.6501 292.7339 411.992 289.2931 ‐0.051 0.9596 Category 2 256.8327 307.2707 208.4059 279.9659 ‐3.134 0.0017 Category 3 282.2 303.4859 271.2211 320.4373 ‐1.558 0.1193 Category 4 ‐239.2676 359.0923 ‐288.8603 362.1283 ‐2.304 0.0212 Category 5 385.6182 312.7597 373.7687 326.9436 ‐1.601 0.1095 Category 6 276.957 303.5128 247.9384 297.5112 ‐2.298 0.0216 Category 7 334.8214 306.002 305.8631 313.6785 ‐2.247 0.0247 Category 8 ‐303.0907 370.6688 ‐316.7624 357.2596 ‐1.372 0.1701 Mean gains per choice and differences between “Intuitive” and “Analytic” responses for each category
6) DISCUSSION
In the previous section we described in details all the observed results of our study. We will now aim to provide the reader with possible explanations for those results.
To start, concerning the determinants and predictors of response time, we could explain the fact that choices framed in terms of losses are answered slower than choices framed in terms of gains with the help of prospect theory. Indeed, the latter posits that the decision-maker places more emphasis on a loss than on a gain of the same magnitude. If we follow this theory, participants might give more importance to an eventual loss than an eventual gain and spend more time reflecting on the choices framed in terms of losses in hope to avoid making mistakes.
Secondly, the difference in response time observed between the High Incentive/Grades treatment and the Low Incentive/Grades treatment could be explained by the fact that a higher incentive motivates participants to be more meticulous in choosing their answers and are therefore slower. Furthermore, a possible explanation for difference between the High Incentive/Grades treatment and the Tournament treatment could come from the possibility that subjects in the Tournament setting felt less in control regarding the issue of the experiment, as others’ results were also determining their own. The lack of control inherent to this competitive setting might have played a negative role in participants’ engagement.
Thirdly, the first idea coming to mind to explain the observed differences in time responses between the different categories of lotteries is of course a disparity in the difficulty of the different categories. However, we found that some of the most difficult categories were paired with some of the lowest response time.
Moreover, the fact that response time was on average shorter for choices presented during the second half of the task than for choices presented during the first half could be indicating a form of learning or an habituation effect.
Additionally, concerning the traits of personality, people scoring higher in the dimension of extraversion are often described as dynamic and action oriented, while individuals with a
higher score of agreeableness are often very optimistic. These characteristics could help explaining their shorter response time. In contrast, individuals scoring higher on openness are usually perceived as curious and investigative, while people with a high score of conscientiousness are often described as analytic and in need of control. These attributes can offer an explanation for their slower response time.
However, it is important to remember the weakness of the correlations observed between the 5 personality traits and response time. Additionally, we should note that the R-squared of the OLS regression was very low (r-sq. = 0.045)
Finally, we cannot rationally explain the difference found between academies and we will not risk ourselves to produce ungrounded speculations.
Concerning the relationship between gains and intuitive responses, our observations showed that overall and on average, intuitive choices were returning outcomes more profitable than analytic choices. Furthermore, we observed that if on average faster answers yielded results more advantageous than slower answers in both half of the task, this difference was even greater during the second half. These findings seem to indicate a form of learning throughout the task, and are in line with our hypothesis. However, those results are marred by the fact that the progression is only observed in the gain domain, and that the opposite effect happens in the loss domain.
Yet, another very interesting finding was that intuitive choices yielded advantageous results when lotteries were framed in terms of gains, but also when they were framed in terms of losses.
Finally, as we stated previously, we could have imputed the profitable results returned by intuitive choices to a discrepancy of difficulty and expected values of the different lotteries, but the lottery by lottery analysis tend to show against that theory. Indeed, intuitive responses
were found to yield significantly more profitable results than analytic ones even for the hardest categories. Furthermore, it is important to note that slower answers never yielded significantly more profitable outcomes than faster ones in any cases.
7) CONCLUSION
In the beginning of this paper, we assumed that analytic responses would not yield significantly more advantageous outcomes than faster intuitive choices. Moreover, we hypothesized that after a period of “learning”, intuitive answers would start to return more profitable outcomes than reflective ones.
In practice, our results turned out better than our expectations. Indeed, not only intuitive choices yielded more advantageous outcomes on average than analytic choices from the start, but furthermore, as subjects gained experience, the gap widened, indicating a form of learning.
However, when refining our analysis, we observed that this pattern was not applicable to every category of lotteries, and in particular to the ones framed in terms on losses. This discovery moderates our results.
To conclude, although response time is an increasingly studied topic in the field of decision-making, many facets are still to be explored. The experiment conducted by our research team was a far-reaching project that yielded a tremendous amount of results, and only a fraction of the observations could be exploited in this paper. Further investigation of the data and follow-up experiments could reveal to be extremely interesting. We could for example focus more deeply on the relationship between the five factors of personality and intuitive thinking, or between intuitive thinking and learning. We previously stated the importance of the link between intuition and knowledge and expertise. Focusing on the relationship between these
variables could allow us to examine the relevance of intuition in learning processes as opposes to reflection.
All of these interrogations deserve to be further investigated, but for now, to the question: «Are slower decision always superior to faster ones?», I believe we can safely answer no.
BIBLIOGRAPHY
Albert, D., & Steinberg, L. (2011). Judgment and decision making in adolescence. Journal of Research on Adolescence, 21(1), 211-224.
Barbot, B. (2012): BB5 : Test de personnalité pour Adolescents.
Barberis, N. (2013). Thirty Years of Prospect Theory in Economics: A Review and Assessment. Nber
working paper series
Betsch, T. (2005). Preference theory—An affect-based approach to recurrent decision-making. In T. Betsch & S. Haberstroh (Eds.),The routines of decision making (pp. 39–65). Mahwah, NJ: Erlbaum. Bolte, A., & Goschke, T. (2005). On the speed of intuition: Intuitive judgments of semantic coherence
under different response deadlines. Memory & Cognition, 33(7), 1248-1255.
Betsch, T., & Glöckner, A. (2010). Intuition in judgment and decision making: Extensive thinking without effort. Psychological Inquiry, 21(4), 279-294.
Burke, L. A., & Miller, M. K. (1999). Taking the mystery out of intuitive decision making. The
Academy of Management Executive, 13(4), 91-99.
Busato, V. V., Prins, F. J., Elshout, J. J., & Hamaker, C. (1998). The relation between learning styles, the Big Five personality traits and achievement motivation in higher education. Personality and
Individual Differences, 26(1), 129-140.
Damasio, A. (2008). Descartes' error: Emotion, reason and the human brain. Random House.
Dijksterhuis, A. (2004). Think different: the merits of unconscious thought in preference development and decision making. Journal of personality and social psychology, 87(5), 586.
Dohmen, T., Falk, A., Huffman, D., Sunde, U., Schupp, J., & Wagner, G. G. (2011). Individual risk attitudes: Measurement, determinants, and behavioral consequences. Journal of the European
Economic Association, 9(3), 522-550.
Evans, J. St. B. T. (2006). The heuristic–analytic theory of reasoning: Extension and evaluation. Psychonomic Bulletin and Review, 13, 378–395.
Evans, J. S. B. T. (2008). Dual-processing accounts of reasoning, judg- ment, and social cognition.
Annual Review of Psychology, 59, 255–278.
Evans, J. St. B. T., & Curtis-Holmes, J. (2005). Rapid responding increases belief bias: Evidence for the dual-process theory of reasoning. Thinking & Reasoning, 11, 382–389.
Evans, A. M., Dillon, K. D., & Rand, D. G. (2014). Reaction Times and Reflection in Social Dilemmas: Extreme Responses are Fast, But Not Intuitive. (May 14, 2014).
Epstein, S. (2008). Intuition from the perspective of cognitive- experiential self-theory. In H. Plessner, C. Betsch, & T. Betsch (Eds.), Intuition in judgment and decision-making (pp. 23–37). New York, NY: Erlbaum.
Fischhoff, B., Parker, A., Bruine de Bruin, W., Downs, J., Palmgren, C., et al. (2000). Teen expectations for significant life events. Public Opinion Quarterly, 64, 189–205.
Fischhoff, B. (2008). Assessing adolescent decision-making competence.Developmental review, 28(1), 12-28.
Furby, L., & Beyth-Marom, R. (1992). Risk taking in adolescence: A decision-making perspective. Developmental Review, 12, 1–44.
Gilovich, T., Griffin, D., & Kahneman, D. (Eds.). (2002). Heuristics and biases: The psychology of
intuitive judgment. Cambridge, UK: Cambridge University Press.
Gigerenzer, Gerd (1991). "How to Make Cognitive Illusions Disappear: Beyond "Heuristics and Biases"".European Review of Social Psychology 2: 83–115.
Gigerenzer, G.; Goldstein D., G. (1996). "Reasoning the fast and frugal way: Models of bounded rationality".Psychological Review 103: 650–669.
Glöckner, A., & Betsch, T. (2008a). Modelling option and strategy choices with connectionist networks: Towards an integrative model of automatic and deliberate decision making. Judgment and Decision
Making, 3, 215–228.
Harrison, G. W., M. I. Lau, and E. E. Rutstrom (2007): Estimating Risk Attitudes in Denmark: A Field Experiment, Scandanavian Journal of Economics, 109(2), 341–368.
Hattie, J. (1999). Influences on student learning. Inaugural lecture given on August, 2, 1999.
Hattie, J., & Timperley, H. (2007). The power of feedback. Review of educational research, 77(1), 81-112.
Holt, C. A., & Laury, S. K. (2002). Risk aversion and incentive effects.American economic
review, 92(5), 1644-1655.
Isenberg, D. How senior managers think? Harvard Business Review, 1984, Dec./Jan., 81–90.
Jacobs, J. E., & Klaczynski, P. (Eds.). (2005). The development of judgment and decision making in children and adults. Mahwah, NJ: Erlbaum.
Jacoby, Larry; Brooks, Lee (1984). Nonanalytic cognition: Memory, perception and concept formation. John, O. P., & Srivastava, S. (1999). The Big 5 trait taxonomy: History, measurement, and theoretical
perspectives. In L. A. Pervin & O. P. John (Eds.), Handbook of personality: Theory and research (2nd ed., pp. 102-138). New York: Guilford.
Jung, C. G. (1923). Psychological types: or the psychology of individuation
Kachelmeier, S. J., & Shehata, M. (1992). Examining risk preferences under high monetary incentives: Experimental evidence from the People's Republic of China. The American Economic Review, 1120-1141.
Kahneman, D. (2003). A perspective on judgment and choice: mapping bounded rationality. American
psychologist, 58(9), 697.
Kahneman, D. (2011). Thinking, fast and slow. Macmillan.
Kahneman, D., & Tversky, A. (1979). Prospect theory: An analysis of decision under risk. Econometrica: Journal of the Econometric Society, 263-291.
Khatri, N., & Ng, H. A. (2000). The role of intuition in strategic decision making.Human
Relations, 53(1), 57-86.
Kleinmuntz, B. Why we still use our heads instead of formulas: Toward an integrative approach.
Psychological Bulletin, 1990, 107(3), 296–3
Komarraju, M., & Karau, S. J. (2005). The relationship between the big five personality traits and academic motivation. Personality and individual differences, 39(3), 557-567.
Lauriola, M., & Levin, I. P. (2001). Personality traits and risky decision-making in a controlled experimental task: An exploratory study. Personality and Individual Differences, 31(2), 215-226. Lönnqvist, J. E., Verkasalo, M., Walkowitz, G., & Wichardt, P. (2010). Measuring individual risk
attitudes in the lab: Task or ask? An empirical comparison. An Empirical Comparison (May 22, 2010). Major, D. A., Turner, J. E., & Fletcher, T. D. (2006). Linking proactive personality and the Big Five to
motivation to learn and development activity.Journal of Applied Psychology, 91(4), 927.
Michel, W., Shoda, Y., & Smith, R. E. (2004). Introduction to personality: Toward an integration. New York: John Wiley
Mikels, J. A., Maglio, S. J., Reed, A. E., & Kaplowitz, L. J. (2011). Should I go with my gut? Investigating the benefits of emotion-focused decision making.Emotion, 11(4), 743.
Miller, C. C., & Ireland, R. D. (2005). Intuition in strategic decision making: friend or foe in the fast-paced 21st century?. The Academy of Management Executive, 19(1), 19-30.
Parikh, J. (1994). Intuition: The new frontier of management. Oxford: Blackwell Business Pervin, L. A. (1994). A critical analysis of current trait theory. Psychological Inquiry, 5, 103-113. Piovesan, M., & Wengström, E. (2009). Fast or fair? A study of response times. Economics
Letters, 105(2), 193-196.
Post, T., Van den Assem, M. J., Baltussen, G., & Thaler, R. H. (2008). Deal or no deal? Decision making under risk in a large-payoff game show. The American economic review, 38-71.
Prietula, M.J. & Simon, H.A. The experts in your midst. Harvard Business Review, 1989, 67(1), 120–4. Reyna, V. F., & Farley, F. (2006). Risk and rationality in adolescent decision making: Implications for
theory, practice, and public policy. Psychology in the Public Interest, 7, 1–44.
Ross, A. C. (1989). Brain hemispheric functions and the Native American.Journal of American Indian
Education, 21(3), 72-76.
Rubinstein, A. (2007). Instinctive and Cognitive Reasoning: A Study of Response Times*. The
Economic Journal, 117(523), 1243-1259.
Seebo, T.C., II The value of experience and intuition. Financial Management, 1993, 22(1), 27.
Shulman, E. P., & Cauffman, E. (2014). Deciding in the dark: Age differences in intuitive risk judgment. Developmental psychology, 50(1), 167.
Simon, H.A. Making management decisions: The role of intuition and emotion. Academy of
Sloman, S. A. (2002). Two systems of reasoning. In G. D. Griffin & D. Kahneman (Eds.), Heuristics and biases: The psychology of intuitive judgment (pp. 379–396). New York, NY: Cambridge University Press
Slovic, P., Finucane, M., Peters, E., & MacGregor, D. G. (2002). The affect heuristic. In T. Gilovich, D. Griffin, & D. Kahneman (Eds.), Heuristics and biases: The psychology of intuitive judgment. (pp. 397–420). New York: Cambridge University Press.
Stanovich, K. E. (2004). The robot’s rebellion: Finding meaning in the age of Darwin. Chicago, ILL: The University of Chicago Press
Stanovich, K. E., & West, R. F. (2000). Individual differences in reason- ing: Implications for the rationality debate. Behavioral and Brain Sciences, 23, 645–665.
Stobart, G. (2008). Testing times: The uses and abuses of assessment. Routledge.
Studer, B., & Clark, L. (2011). Place your bets: psychophysiological correlates of decision-making under risk. Cognitive, Affective, & Behavioral Neuroscience,11(2), 144-158.
Thompson, V. A., Prowse Turner, J. A., & Pennycook, G. (2011). Intuition, reason, and metacognition. Cognitive psychology, 63(3), 107-140.
Tsujii, T., & Watanabe, S. (2010). Neural correlates of belief-bias reasoning under time-pressure: A near-infrared spectroscopystudy. NeuroImage, 50, 1320–1326.
Tversky, A; Kahneman (1973). "Availability: A heuristic for judging frequency and probability". Cognitive Psychology 5 (1): 207–233
Van der Kleij, F. M., Eggen, T. J., Timmers, C. F., & Veldkamp, B. P. (2012). Effects of feedback in a computer-based assessment for learning. Computers & Education, 58(1), 263-272.
Winerman, L. (2005). Intuition [Special issue]. APA Monitor on Psychology, 36(3).
Zhang, L. F. (2003). Does the big five predict learning approaches?. Personality and Individual
ANNEXES
Notes:
Annex 3: OLS Regression of the log-transformed Response Time
lnTimeAnswer is the log-transformed variable of response time. The second regression is the same as the first one with the option robust.
Creteil and Versailles are dummies and are compared to Paris; Con is an abbreviation for Conscientiousness, Lotgain is a dummy equal to 1 when lotteries are framed in terms of gain; Tournament and Low_Incit are dummies equal to 1 in the tournament setting and in the Low Incentive/Grade treatments respectively. They are compared the High_Incentive Treatment. Secpart is a dummy equal to 1 when lotteries belong to the second half of the experiment (the last 48 lotteries presented).