Ray-tracing modelling of the diffraction by half-planes
and slits based on the energy flow lines concept
A. Billon
aand J.-J. Embrechts
ba
Laboratoire d’´
Etude des Ph´enom`enes de Transfert et de l’Instantan´eit´e : Agro-industrie et
Bˆatiment, Bˆatiment Fourier Avenue Michel Cr´epeau F-17042 La Rochelle Cedex 1
b
University of Liege - Acoustics Labo, Campus du Sart-Tilman, B28, B-4000 Liege 1, Belgium
Geometrical acoustics models are currently the most popular prediction tools in room-acoustics due to their low computing load. However, they seldom take into account the diffraction occurring at free edges or apertures. Moreover, the existing diffraction models implemented in geometrical acoustics algorithms are either limited to specularly reflected paths or either present excessive complexity. Recently, a diffraction model based on an ap-proximation of the far-field direction of the Poynting’s vector has been implemented in an acoustic ray-tracing software. This model can handle both diffuse and specular reflections and sets no limit in terms of order of reflec-tion or diffraction by half-planes. Results for single and double diffraction problems are presented here. Moreover, this model is developed to handle diffraction occurring at slits and comparisons with experimental results are shown.
1
Introduction
Geometrical acoustics models are very popular in room-acoustics due to their relatively low computation time com-pared to the more computationally intensive methods solving the wave equation [1]. However, they only model the prop-agation of the acoustic intensity and neglect the phase infor-mation of the waves. These assumptions imply that di ffrac-tion occurring at free edges is not modeled, limiting their ap-plications. To handle these phenomena, two models extend-ing geometrical acoustics are particularly popular in room acoustics: the uniform theory of diffraction (UTD) [2, 3] and the Biot-Tolstoy-Medwin model (BTM) [4, 5, 6].
To apply these coherent diffraction models, the propaga-tion paths must be found. If only specular reflecpropaga-tions are considered, each diffracting edge becomes a sound source and its images onto the room’s surfaces can be recursively constructed similarly to the classical source image method [7, 8]. The number of images to evaluate grows then expo-nentially with the order of reflection, restricting the practical application to low reflection orders[9, 10]. Another method consists in the detection of propagation paths including the specularly reflected and the diffracted paths, by tracing from the sound source beams [11, 12] or frustrums [13, 14]. These paths are then used to propagate the energy from the source to the receiver. In all wave based methods, the diffracted paths are only associated with specular reflections and the contributions of diffuse reflections are totally neglected.
Another approach is to model diffraction based on the ray-tracing method [15, 16] which can take into account both specular and diffuse reflections [1, 17]. In this case, the problem is that the probability for a sound ray to intersect a diffracting edge is extremely weak (theoretically 0). The de-tection of the diffracting edge therefore implies the definition of virtual surfaces extending them in space such as they be-come visible by the propagating sound rays [18, 19, 20, 21]. Moreover, these algorithms imply the development of energy based diffraction models.
In Ref. [18], the sound rays crossing the virtual surface are redirected randomly. This model obtains good agreement with measurements with a limited computation load but its physical basis seems dubious. For the three other models, each ray detecting the diffracting edge results in the emission of several tens of diffracted rays according to some defined directivity patterns implying a greater computation load. In the first model [19], the energy carried by the diffracted rays is evaluated using the Keller’s geometrical theory of di ffrac-tion [22]. The directivity pattern is derived from the uncer-tainty relation for the second model [20] and from a shifted screen model for the third one [21].
Recently, Hesse and Ulanowski [23] have introduced a diffraction model based on the direction of the energy flow
lines [24] behind an infinite half-plane and a slit to evaluate the light scattering created by ice crystals. In this model, the rays are deflected in the shadow zone depending on the dis-tance between the ray and the edge, similarly to Refs. [20] and [21] . However, the rays are not split up and the number of traced rays remains constant along a simulation. For an in-finite half-plane, this model has been extended to obliquely incident rays and applied to acoustical problems [25], show-ing a good agreement with the UTD.
In this paper, the diffraction model based on the energy flow lines is briefly presented and applied to single and dou-ble diffraction prodou-blems in Section 2. In Section 3, the diffrac-tion model for slits developed by Hesse and Ulanowski [23] is extended to obliquely incident rays model and some results are presented.
2
Di
ffraction by half-planes
2.1
Di
ffraction model
The problem under consideration is the diffraction of plane waves by a half-plane. Let’s define θ the angle between the incoming wave vector and the diffracting edge (Fig. 1):
cos θ= ~r · ~e
|~r| × |~e|, (1) where ~r is the ray direction and ~e the edge direction whose orientation is chosen so that 0 < θ ≤ π/2.
Let’s now define the angle α between the incoming waves and the half-plane such as (Fig. 1):
cos α= − ~r · ~IE
|~r| × | ~IE|, (2) where I is the intersection point between the ray and the transparent plane including the half-plane and E the projec-tion of I on the edge.
For waves propagating in the plane perpendicular to the half-plane(θ= π/2) and incident perpendicularly to the half-plane (α= π/2), Hesse and Ulanowski [23] proposed an em-pirical expression based on numerical simulations of the far field deflection angle of the energy flow lines given through the direction of the time-averaged Poynting’s vector [24] be-hind the half-plane:
φ(d) = − arctan λ
4π2d, (3)
where d= | ~IE|is the distance between the considered ray and the diffracting edge and λ is the wavelength. In this model, the edge is assumed to be infinite and both the source and the receptor are located far enough from the half-plane as
Figure 1: Plane wave incident over a half-plane. ~r is the incident wave vector and ~s the deflected one. ~e is the edge line direction. — ~IE— is the shortest distance between the intersection point I and the edge. In this particular example,
~e is collinear to ~y and ~IEto ~z. α is the incidence angle (comprised between 0 and π) in respect to the half-plane and
θ is the incidence angle (defined between 0 and π/2) in respect to the edge line. φ is the deflection angle.
assumed in the geometrical theory of diffraction [22] or the uniform theory of diffraction [2, 3].
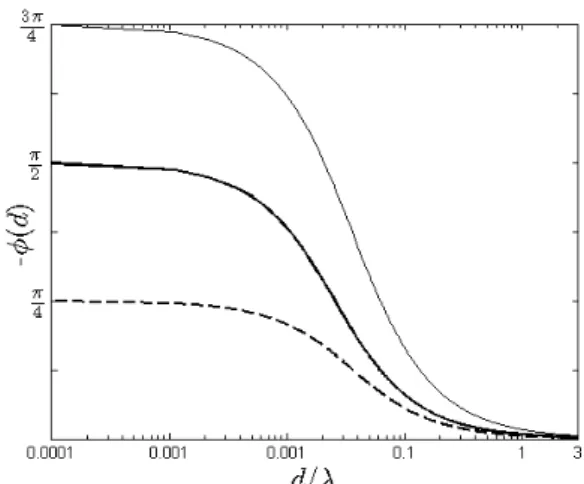
For oblique incident rays (α , π/2 and θ , π/2), the following expression can be obtained [25]:
φ(d) = −2π − απ arctan λ
4π2dsin α. (4)
Fig. 2 presents the obtained deflection angle computed with Eq. 4 for θ= π/2 as function of the edge-ray distance for an incidence angle α=π/4, π/2 and 3π/4. Note that for α=π/2, Eq. 4 reduces to Eq. 3. For θ , π, the direction of the deflected ray is the solution of the intersection of the di ffrac-tion cone [22] and the deflecffrac-tion cone [25]. In acoustics, the Poynting’s vector can be interpreted as the acoustic intensity vector [27] and the link with the acoustic ray-tracing algo-rithm is therefore straightforward. Eq. 4 is very intuitive both in geometrical optics [24] and in acoustics [27]: the closer of the diffracting edge the rays travel, the greater their deflec-tion angle. The proposed concept deals only with energetic quantity and cannot thus predict the phase jump occurring at the edge. On the other hand, the predicted field is continu-ous at the shadow boundary. This diffraction model has been shown to be very computationally efficient [25].
2.2
Single di
ffraction configuration
The ray-tracing results are compared with those obtained using the UTD for a half-plane equivalent to a sound bar-rier in Fig. 3. The sound source is an omnidirectional point source with a sound power level of 100dB and three frequen-cies (125, 500 and 2000Hz) are considered. The sound pres-sure level (SPL) is computed behind the half-plane using 107
rays. The receptors are spherical with 0.5m diameter and located every 2m. The computation time is about 60s on a computer fitted with a 2.4GHz Pentium 4 with 2Gb of RAM. The ray tracing’s results are in a good agreement with those obtained with the UTD with a mean discrepancy lower than 1dB (Fig. 4). The proposed diffraction model tends to slightly underestimate the sound pressure level compared to
Figure 2: Evolution of the deflection angle -φ(d) obtained using Eq. 4 as a function of the edge-ray distance d/λ for incidence angles equal to θ= π/2 and α=π/4 (thin line), π/2
(bold line) and 3π/4 (dashed line).
Figure 3: (a) Cross-section of the studied configuration and (b) top-view of the studied configuration. (•) Source location, (dashed line) locations of the sound receptors.
Figure 4: Evolution of the sound pressure level (SPL) behind the half-plane at (a) 125Hz, (b) 500Hz and (c) 2000Hz: (•) uniform theory of diffraction, (thick line)
Figure 5: Sketch of the simulated Y-shaped barrier. S indicates the sound source location and R the sound
receptor.
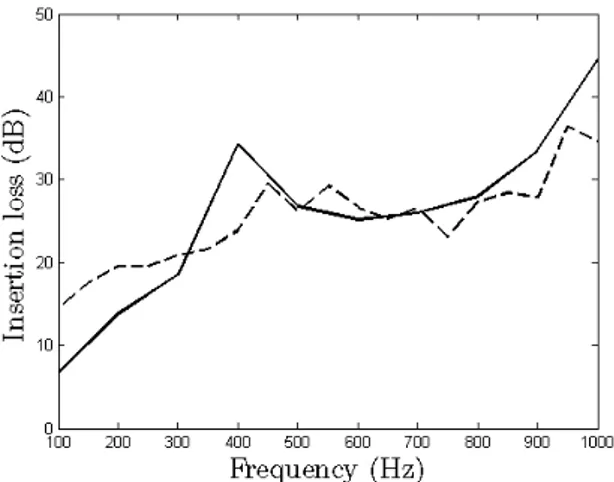
Figure 6: Insertion loss at the receptor as a function of the frequency: (thick line) numerical data [28], (dashed line)
ray-tracing results.
the UTD. This underestimation is partly due to the empirical expression of Eq. 4 and partly to the sampling issue asso-ciated with the ray-tracing algorithm. The deviation is thus greater closer to the half-plane, deeper in the shadow zone and at higher frequencies. This corresponds to the greatest deflection angles which are associated with the shortest pass-ing distances (Fig. 2).
2.3
Double di
ffraction configuration
In this section, an application to a double diffraction prob-lem is presented. A Y-shaped barrier (Fig. 5) is considered and comparison with numerical data obtained with the bound-ary element method [28] is carried out within the frequency range from 100Hz to 1000Hz. The ground and the barrier are assumed perfectly rigid (without scattering or absorption). For the ray-tracing simulations, 107rays are emitted and the sound receptor is a 0.5m diameter sphere. In this configura-tion, there are two virtual surfaces that extend each branch of the barrier.
Despite neglecting the interference effects, the ray-tracing is globally in good agreement with the reference data (Fig. 6). It tends to overestimate the insertion loss below 300Hz and cannot predict an insertion loss peak occurring at 400Hz. In fact, this peak must be due to interference effects which are not taken into account by the proposed model. On the other hand, the agreement is very good above 500Hz.
Figure 7: Plane waves incident on a slit of width s propagating in a plane perpendicular to the diffracting edges
(θ= π/2). α is the incidence angle and φ is the deflection angle.
3
Di
ffraction by slits
3.1
Di
ffraction model
The problem under consideration is the diffraction of plane waves propagating in a plane perpendicular to the edges of a slit (Fig. 7) which can be solved using the Kirchhoff’s diffrac-tion theory [24]. For perpendicular incident waves (α= π/2 and θ= π/2), Hesse and Ulanowski [23] proposed an empir-ical expression of the far field deflection angle of the energy flow lines behind the slit:
φ(d) = − arctan " λ 4π2 1 d − 1 s − d !# , (5)
where s is the slit width, d the distance between the consid-ered ray and the lower edge (Fig. 7). Similarly to the previ-ous model, it is assumed that the slit is infinite and both the source and the receiver are situated in the far-field. Comput-ing the angular energy density derived from Eq. 5, Hesse et al.[23] found a good agreement with the Fraunhofer di ffrac-tion pattern [24] apart from neglecting the interference ef-fects.
For obliquely incident rays (α , π/2 and θ , π/2),the evaluation of the deflection angle must be separated in two parts. For d ≤ s/2, the following expression is obtained:
φ(d) = −2π − απ arctan " λ 4π2sin α 1 d − 1 s − d !# , (6) and, for d > s/2, we can write:
φ(z) = −2απarctan " λ 4π2sin α 1 d − 1 s − d !# . (7)
3.2
Numerical results
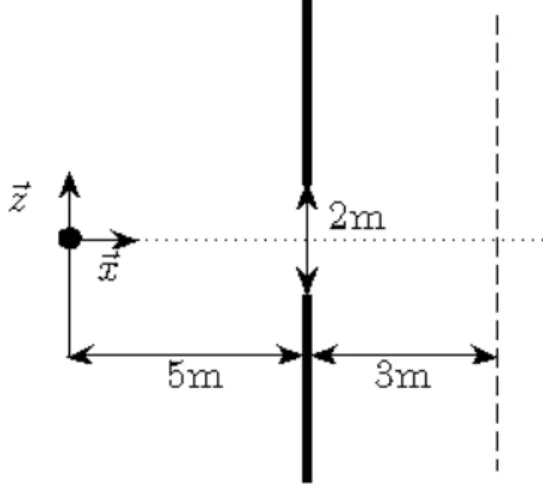
The studied configuration, a 2m wide lit, is presented in Fig. 8. The sound source is an omnidirectional point source with a sound power level of 100dB. It is located 5m away from the center of the slit. Three frequencies (125, 500 and 2000Hz) are considered. The sound pressure level (SPL) is computed behind the slit with 107 rays. The receptors are
Figure 8: Cross-section of the studied configuration of the studied configuration. (•) Source location, (dashed line)
locations of the sound receivers.
Figure 9: Evolution of the sound pressure level (SPL) evaluated using 107rays 3m behind a 2m wide slit included
between z= 4m and 6m (indicated by the arrows at 125Hz (thick line), 500Hz (thin line) and 2000Hz (dashed line).
computation time is about 60s on a computer fitted with a 2.4GHz Pentium 4 with 2Gb of RAM.
The obtained results are physically consistent (Fig. ??): sound energy reaches the shadow zones behind the slit. More-over, the lower the frequency, the more energy reaches the shadow zones. This increase of energy deflected into the shadow zones is associated with a slight decrease of the sound level computed into the lighted zone. However, the sound levels computed into the shadow zones are not exactly sym-metric for the two sides of the slit. This discrepancy increases deeper into the shadow zones and with the frequency. It can be associated with under-sampling issues as previously shown for the half-plane configuration [25].
4
Conclusion
The ray-tracing method is a geometrical acoustics model approximating the propagation of sound waves by rays car-rying only energy information. This method is very popular in room acoustics and auralization due to its low computa-tion load. However, diffraction effects are seldom modeled, restricting its application.
In this paper, a diffraction model developed to predict the scattering of light by ice crystals is adapted to an acoustic ray-tracing software. To simulate diffraction by half-planes and slits, the rays passing in the vicinity of the diffracting edges are deflected in the shadow zone depending on the ray-edge distance and on the frequency. The deflection law is based on an approximation of the far field direction of the time-averaged Poynting’s vector. This model assumes that the edge is infinite and that the source and the receiver are far enough from the diffracting edge. This model is com-putationally efficient. For the slit, this model has been here extended to obliquely incident rays.
For the half-plane configuration, the agreement with the uniform theory of diffraction is good, with mean discrepan-cies lower than 1dB. They are due to the approximated de-flection law, on the one hand, and to sampling issues, on the other hand. In fact, the deflection of the rays occurs mainly within the first wavelength over the half-plane. In this de-flecting zone, the number of rays must be great enough to completely cover the shadow zone, without discontinuities. So, the obtained predictions are more reliable at lower fre-quencies for a given number of rays. In addition, a config-uration composed of a Y-shaped barrier on a rigid flat ground was also investigated, this geometry presenting a double di ffrac-tion phenomenon. Despite neglecting the interference ef-fects, a fair agreement is found between ray-tracing and bound-ary elements method results for frequencies ranging between 100Hz and 1000Hz.
For the slit, the obtained results seem physically consis-tent. More energy reaches the shadow zones behind the slit for lower frequencies. Similarly to the half-plane configura-tion, under-sampling issues can be highlighted as the sound levels computed are not exactly symmetric in respect to the slit center, particularly deep into the shadow zones and at high frequencies. Further work must be done to experimen-tally validate the diffraction model for slits.
Acknowledgments
Alexis Billon wishes to thank the Fonds de la Recherche Scientifique(FNRS-FRS) for providing financial support to this work (Grant 2.4.534.09.F).
References
[1] H. Kuttruff, Room acoustics 4th ed., Taylor & Francis, London (2000).
[2] G. Kouyoumjian, P. Pathak, ”A uniform geometrical theory of diffraction for an edge in a perfectly conduct-ing surface”, Proc. IEEE 62(11), 1448-1461 (1974).
[3] D. McNamara, C. Pistorius, J. Malherbe, Introduction to the uniform geometrical theory of diffraction, Artec House, Boston (1990).
[4] M. Biot, I.Tolstoy, ”Formulation of wave propagation in infinite media by normal coordinates with an applica-tion to diffraction”, J. Acoust. Soc. Am. 29(3), 381-391 (1957).
[5] H. Medwin, ”Shadowing by finite noise barriers”, J. Acoust. Soc. Am. 69(4), 1060-1064 (1981).
[6] U. Svensson, R. Fred, J. Vanderkooy, ”An analytic secondary source model of edge diffraction impulse responses”, J. Acoust. Soc. Am. 106(5), 2331-2344 (1999).
[7] J. Allen, D. Berkley, ”Image method for efficiently simulating small-room acoustics”, J. Acoust. Soc. Am. 65(4), 943-950 (1979).
[8] J. Borish, ”Extension of the image model to arbi-trary polyhedra”, J. Acoust. Soc. Am. 75(6), 1827-1836 (1984).
[9] V. Pulkki, T. Lokki, L. Savojia, ”Implementation and visualization of edge diffraction with image-source method”, Preprint 5603 in 112th AES Convention (2002).
[10] D. Schroeder and A. Pohl, ”Real-time hybrid simula-tion method including edge”, Proc. EAA Symposium on Auralization, 1-6 (2009).
[11] N. Tsingos, T. Funkhouser, A. Ngan, I. Carlbom, ”Modeling acoustics in virtual environments using the uniform theory of diffraction”, SIGGRAPH 01, 545-552 (2001).
[12] T. Funkhouser, N. Tsingos, I. Carlbom, G. Elko, J. West, G. Pingali, P. Min, A. Ngan ,”A beam trac-ing method for interactive architectural acoustics”, J. Acoust. Soc. Am. 115(2), 739-756 (2004).
[13] A. Chandak, C. Lauterbach, M. Taylor, Z. Ren, D. Manocha, ”Adfrustum: Adaptive frustum tracing for interactive sound propagation”, IEEE T. Vis. Comput. Gr. 14(6), 1707-1722 (2008).
[14] M. Taylor, A. Chandak, Z. Ren, C. Lauterbach, D. Manocha ”Fast edge-diffraction for sound propaga-tion in complex virtual environments”, Proc. EAA Sym-posium on Auralization,1-6 (2009).
[15] A. Krokstad, S. Strom, S. Sorsdal, ”Calculating the acoustical room response by the use of a ray tracing technique”, J. Sound Vib. 8(1), 118-125 (1968).
[16] A. Kulowski, ”Algorithmic representation of the ray tracing technique”, J. Sound Vib. 18(6), 449-469 (1985).
[17] M. Hodgson, ”Evidence of diffuse surface reflections in rooms”, J. Acoust. Soc. Am. 89(2), 765-771 (1991).
[18] S. Dance, B. Shield, ”Modelling of sound fields in en-closed spaces with absorbent room surfaces part iii. bar-riers”, Appl. Acoust. 61(4), 385-397 (2000).
[19] G. Benedetto, R. Spagnolo, ”A study of barriers in enclosures by a ray-tracing computer model”, Appl. Acoust. 17(3), 183-199 (1984).
[20] U. Stephenson, ”An energetic approach for the simu-lation of diffraction with ray tracing based on the un-certainty relation”,Acta Acustica united with Acustica 96(3), 516-535 (2010).
[21] U. Stephenson, ”An analytically derived sound particle diffraction model”, Acta Acustica united with Acustica 96(6), 1051-1068 (2010).
[22] J. Keller, ”Geometrical theory of diffraction”, J. Opt. Soc. Am. 52(2), 116-130 (1962).
[23] E. Hesse, Z. Ulanowski, ”Scattering from long prisms computed using ray tracing combined with diffraction facets”, J. Quant. Spectrosc. Ra. 79-80(1), 721-732 (2003).
[24] M. Born, E. Wolf,Principles of optics 3rd ed., Perga-mon Press, New York (1965).
[25] A. Billon, J.-J. Embrechts, ”Ray-tracing modelling of the diffraction by half-planes based on the energy flow lines concept”, Forum Acusticum, 1-6 (2011).
[26] A. Sommerfeld, Optics. Lecture on theoretical physics: IV, Academic Press, New York (1964).
[27] A. Pierce, Acoustics: An introduction to its physi-cal principles and applications, Acoustiphysi-cal Society of America, Woodbury (1989).
[28] H. Kim, J. Kim, H. Kang, B. Kim, S. Kim, ” Sound diffraction by multiple wedges and thin screens”, Appl. Acoust. 66(9), 1102-1119 (2005)s.