P
rovincial
S
Patial
P
lanning
H
andbook
Ministry of Land Management, Urban Planning and Construction
General Department of Land Management
June 2016
P
rovincial
S
Patial
P
lanning
H
andbook
Ministry of Land Management, Urban Planning and Construction
General Department of Land Management
June 2016
Supported by GIZ Land Rights Programme II
Dr. Franz-Volker Müller
born August 3, 1950
deceased March 22, 2015
for his outstanding support to land management
and land rights recognition in Cambodia.
F
orewordThe Kingdom of Cambodia is home to an increasing population of more than 15 million people. Whereas a majority of the population live mainly from agriculture, the relation of our society to our land has changed considerably in the recent past. The urban population increases relatively faster than the population in rural areas, which strengthens the challenges of job creation, provi-sion of public services and the construction of a Cambodian urban identity.
Transport infrastructures have quickly improved, accessing and connecting not only the capital but many areas throughout the country, fueling economic growth and creating a polycentric web of urban centers. Dynamic domestic and cross-border migration flows challenge local and national governance and transform the relations of people and land-based resources. While we recognize that past development has affected our forest and other natural resources, we strive to preserve the environment that we all depend upon and maintain it according to the principles of sustain-able watershed management.
The many uses and functions of land are governed by different ministries and addressed in sector policies and plans. To strike a balance between the often competing uses and functions and to provide for a sustainable territorial development is the purpose of spatial planning. Therefore the Royal Government of Cambodia through the Council of Ministers approved the National Policy on Spatial Planning (April 08, 2011) and mandated the National Committee for Land Management and Urban Planning (NCLMUP) - with the MLMUPC as its secretariat - as the lead agency to imple-ment spatial planning in Cambodia.
Whereas NCLMUP and the respective sub-national committees are established, it is clear that existing experiences on spatial planning are still limited in the country. It is for this very reason that the MLMUPC embarked on the formulation of sub-national spatial planning handbooks that provide an overall direction, specific procedures as well as practical knowledge and advice based on spatial planning processes that have been piloted across the country in cooperation with GIZ. These handbooks form a common basis for planners to follow, draw and exchange upon. They are a considerable contribution to an enabling framework for participatory spatial planning and thus for the sustainable territorial development of Cambodia’s future.
Senior Minister
Minister of Land Management, Urban Planning and Construction, and
P
reFaceSpatial Planning is at its infancy in Cambodia but is now embedded in a comprehensive legal and policy framework that envisions that the country’s entire territory shall be used, organized, developed and protected by integrative, strategic territorial planning and the harmonization of regionally significant instruments and measures.
Competent authorities that take initiative, arrange, coordinate, and approve Spatial Planning are at work at four administrative levels: National/Regional, Capital/Provincial, Municipal/District/ Khan and the Commune/Sangkat Levels. At sub-national level, Spatial Planning agencies are ar-ticulated to the unified administration as envisaged by the D&D Policy and based on the Laws on Administrative Management of Capital, Provinces, Municipalities, Districts, Khans, and the Law on Administrative Management of Communes/Sangkats.
Based on a number of relevant Sub-decrees, the National Committee for Land Management and Urban Planning has developed planning procedures that include the overall scope and the desired content of each sub-national spatial plan. This series of spatial planning handbook shall inform and complement the official procedures approved at Ministry level. It is conceived as a reference document easy to consult and to provide quick orientation concerning the spatial planning pro-cesses. It is a further step towards guiding and enabling sub-national actors to formulate spatial plans.
H.E. Dr. Pen Sophal
Secretary of State, Ministry of Land Management Urban Planning and Construction, and Secretary-General of the National Committee for land management and Urban Planning
t
able oFc
ontentSForeword i
Preface iii
Table of Contents v
List of Figures vii
List of Tables vii
List of Maps vii
List of Acronyms ix
Overview:
The
Provincial
Spatial
Plan
1
Step 1
Preparation and Launch of the Provincial Spatial Planning Process 4
Task 1.1 Introduction of spatial planning to provincial authorities 4Task 1.2 Establish the provincial spatial planning agencies 5 Task 1.3 Enable the spatial planning agencies 6 Task 1.4 Identification and gathering of stakeholders 7
Step
2
Situation
Analysis
(Diagnosis)
9
Task 2.1 Data collection and database management 9 Task 2.2 Data analysis and maps production 12 A) Administration 13
B) Biophysical Environment 14
C) Land use and land tenure 24
D) Population and Settlements 32
E) Social services provision 36
F) Physical Infrastructures 38
G) Provincial Economic Profile 43 Task 2.3 District level verification, updating and analysis workshops 48 A) Land Use 49
B) Social service accessibility and identification of services provision areas 51
C) Economic structure and update of road infrastructure 51 Task 2.4 Institutional analysis based on SWOT at provincial level 53
Task 2.5 Analysis of the current spatial structure of the provincial territory 55 A) Identification and analysis of land use systems 55
B) Classification and analysis of urban centres 57 C) Identification and analysis of provincial economic structure 59
Step
3
Envision
the
Future
61
Task 3.1 Identify future development scenarios 61
A) Demographic growth scenario 62
B) Land use change scenarios 64
C) Climate change scenarios and vulnerability 65 Task 3.2 Elaborate vision and long term development goals 67
Step 4
Spatial Development Strategies
70
Task 4.1 Spatial development strategies 70
A) Future Land Use and Landscape Functions 71 B) Future Urban Centres and Service Provision 73 C) Future Economic Structure 76 D) Integration of Spatial Development Strategies 77
Task 4.2 Align sector strategies and update sector plans 79
Task 4.3 Internal consultation with provincial authorities 80
Step 5
Implementation, Monitoring, Evaluation and Plan Updating
81
Task 5.1 Implementation and Monitoring 81
Step 6
Finalization of the Planning Process
84
Task 6.1 Final public consultation of all stakeholders 84 Task 6.2 Preparation of final technical report 85 Task 6.3 Public display and endorsement of the plan by the Provincial Council 85 Task 6.4 Approval by the National Committee for Land Management and Urban Planning 87
References
88
Annexes
89
Annex 1 Indications of workshops to be conducted during the spatial planning process 89 Annex 2 List of spatial and non-spatial data required 90 Annex 3 Outline structure for a Provincial Spatial Plan technical report 94
l
iSt oFF
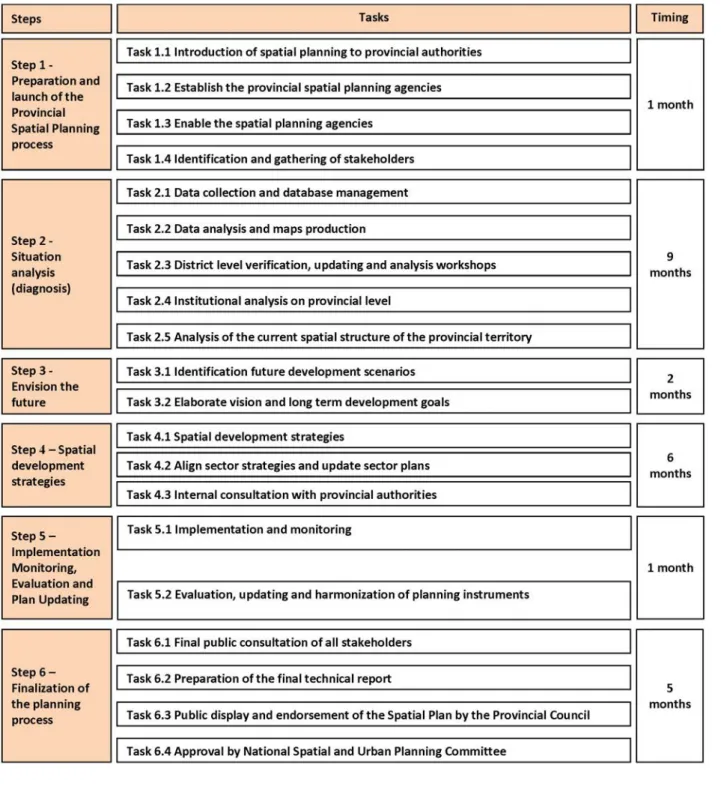
igureSFigure 1 Planning steps for a Provincial Spatial Planning process
Figure 2 Integration of relevant spatial planning data into a spatial planning database Figure 3 Screen shot in the spatial planning database and meta-database file
Figure 4 Ombrothermic diagram for a station located in Kampong Chhnang - yellow areas indicate months with potential drought
Figure 5 Change in rainfall distribution (Battambang station) between 1920-1930 and 1990-2000 showing a clear change in rainfall distribution between 1920-1930 and the 1990-2000 decades
Figure 6 Extreme rainfall analysis (Battambang Station) between 1981 and 2012 showing that extreme precipitation, indicated with most relevant indices, tend to increase and to occur predominantly in October
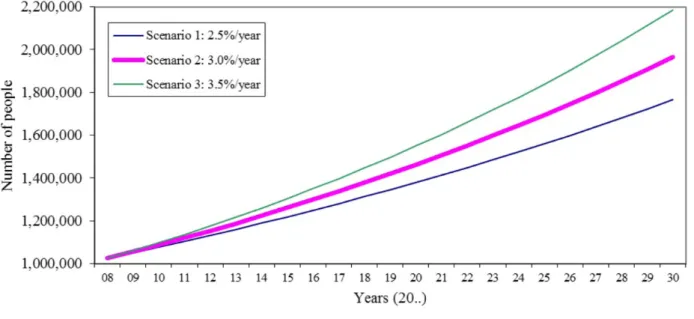
Figure 7 Age pyramid of Kampong Chhnang province population in 1998 (left) and in 2008 (right) Figure 8 Provincial demographic increase scenario, Battambang 2008-2030, based on a demo
graphic growth rate of 3.10%/year between 1998 and 2008
Figure 9 Final presentation of Battambang Provincial Spatial Plan to Provincial Council
l
iSt oFt
ableSTable 1 List of potential stakeholders in provincial spatial planning Table 2 Overall structure of the Spatial Planning Database System
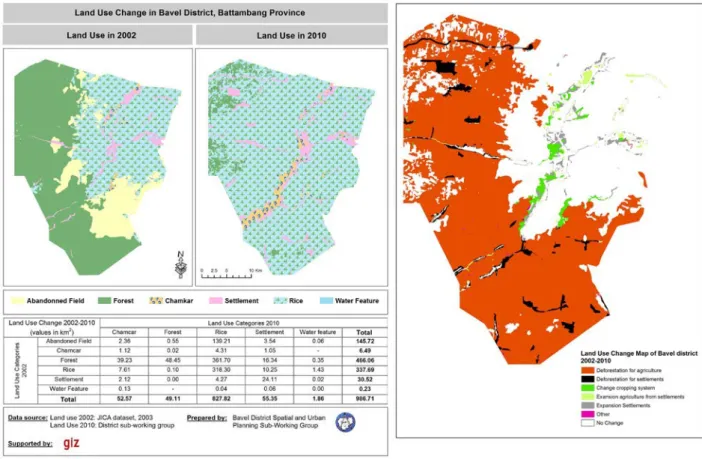
Table 3 Documentation of land use change (referring to land use change map above - Bavel district, Battambang)
Table 4 Classification of urban centres in Battambang province
Table 5 District demographic growth scenario, Battambang 2008-2030 Table 6 Existing and future functions of urban centres in Battambang
l
iSt oFM
aPSMap 1 Name and location of the different administrative units in Battambang Province Map 2 Thiessen Polygons of rainfall area in Siem Reap River watershed
Map 3 Topography in Kampong Chhnang – elevation above sea level (left) and slope (right) Map 4 Distribution of main soil type (left) and their overall fertility (right) in Kampong Chhnang province
Map 5 Main water resources in Kampong Chhnang
Map 6 Ecosystems in Kampong Chhnang: Watershed Areas (left) and GENE-Ecological zones (right)
Map 7 Flooded area in Kampong Chhnang, under three levels of magnitude Map 8 Progression of the 2011 flood in Kampong Chhnang
Map 9 Land Use updating process in Takeo (1999 Land Use Map, left); Updated Google Earth image, middle and Updated 2014 Land Use Map, right)
Map 10 Existing forest cover and the different types of forest management across Kampong Chhnang province
Map 11 Location of the existing fishing grounds and the different types of fisheries management across Kampong Chhnang province
Map 12 Existing protected areas across Kampong Chhnang province
Map 13 Importance of cultivated area size (by commune) in 2012 across Kampong Chhnang province
Map 14 Location of the areas where private land titles have been delivered in Kampong Chhnang province (left) and the economic and three types of social land concessions areas in Kampong Chhnang province (right)
Map 15 Population growth rate by district for the period 1998-2008 in Kampong Chhnang (left) and the net migration rate by district in the same province over the same period of time (right)
Map 17 Location of the different health facilities (left) and accessibility to health centres in Kampong Chhnang province (right)
Map 18 Accessibility to primary schools in Takeo province
Map 19 Transport infrastructure networks in Kampong Chhnang province
Map 20 Location of the different irrigation schemes in Kampong Chhnang province Map 21 Location of the existing electricity network in Battambang
Map 22 Distribution and importance of labour occupation (by key sector and by commune) across Kampong Chhnang province
Map 23 Distribution and importance of labour occupation (by industries and by district) across Battambang province
Map 24 Location of main tourist attractions in Battambang province
Map 25 Land Use in Bavel District 2002 – 2010 (left) and land use changes between 2002 and 2010 (right)
Map 26 Identification of land use system in Takeo province (land use unit – left; land use change – middle and land use system – right)
Map 27 Classification of urban centres in Takeo province
Map 28 Localization of main development poles in Takeo province Map 29 Evolution of forest cover and agrarian expansion in Battambang Map 30 Vulnerability of agricultural production to flood (by commune)
Map 31 Localization of future watershed management measures in Battambang Map 32 Locations of future irrigation developments in Battambang
Map 33 Future polycentric structure of urban centres in Battambang
Map 34 Future location of industrial areas in line with future electricity transmission and internal hydro-power lines and future land use systems
Map 35 Future provincial road system for Battambang with specific type of infrastructure work needed for different section of network (maintenance, rehabilitation, new construction, etc.)
l
iSt oFa
cronyMSCDP Commune Development Plan
CDC Council for Development of Cambodia
CEMAT European Conference of Ministers responsible for Spatial/Regional Planning CMDP Community Managed Development Partners (NGO)
CLUP Commune Land Use Plan
CWG Core Working Group (under Municipal Working Group for Urban Planning) D&D Democratic Development (previously Decentralization and De- concentration) DCLMUP District Committee for Land Management and Urban Planning
DED Deutscher Entwicklungsdienst (German Development Service) DLUMP District Land Use Master Plan
DP Detailed Plan
DSDP District Strategic Development Plan GDP Gross Development Product GIS Geographic Information System
GIZ Deutsche Gesellschaft für Internationale Zusammenarbeit mbH
ISIC International Standard Industrial Classification of All Economic Activities LMUP Land Management and Urban Planning
LMUP-C Land Management and Urban Planning Committee LMUP-WG Land Management and Urban Planning Working Group LUMP Land Use Master Plan
LRP II Land Rights Program II (by GIZ) LUP Land Use Plan
M&E Monitoring and Evaluation
MCLMUP Municipal Committee for Land Management and Urban Planning MIP Municipal Investment Program
MLMUPC Ministry of Land Management, Urban Planning and Construction MLUMP Municipal Land Use Master Plan
MoI Ministry of Interior MoP Ministry of Planning
MPLUP Master Plan and Land Use Plan MRC Mekong River Commission
MSDP Municipal Strategic Development Plan MSLWG Municipal State Land Working Group
NCDD National Committee for Sub-National Democratic Development NCLMUP National Committee for Land Management and Urban Planning NGO Non-Governmental Organization
NIS National Institute of Statistics NSDP National Strategic Development Plan OD Operational District
PCLMUP Provincial Committee for Land Management and Urban Planning
PDLMUPC Provincial Department of Land Management, Urban Planning and Construction PES Payment for Environmental Service
PIP Public Investment Program
PPPS Policies, programs, plans and strategies PSLMC Provincial State Land Management Committee PSP Provincial Spatial Plan
PWG Provincial [Land Management and Urban Planning] Working Group RGC Royal Government of Cambodia
RUPP Royal University of Phnom Penh
SWOT Strengths, Weaknesses, Opportunities and Threats SEIA Social and Environmental Impact Assessment SNEC Supreme National Economic Council
SWOT Strengths, Weaknesses, Opportunities and Threats
VGGT Voluntary Guidelines on the Responsible Governance of Tenure of Land, Fisheries and Forests in the Context of National Food Security
Step 1 Overview Step 2 Step 3 Step 4 Step 5 Step 6
o
verview:
t
HeP
rovincialS
PatialP
lanType of plan The provincial spatial plan (PSP) is a spatial development frame-work based on a vision. It provides strategic directions for the spatial development of the province:
• The vision outlines the long-term aspired territorial develop-ments
• The strategy is linking the aspired territorial developments with the means proposed to achieve them
Role and Function Within the Cambodian planning system,
• the PSP aims to spatially substantiate national level spatially relevant policies, programs, plans and strategies (PPPS), to guide the local level spatial planning and to integrate the two with each other (“vertical integration”);
• it coordinates and integrates provincial sector PPPS with each other and with the aims of spatial planning itself (“horizontal integration”); and it further informs the formulation of the provincial 5-year development plan and the corresponding rolling investment plan.
Scope and Content The PSP aims to determine the envisaged future spatial structure of the province, and assigns corresponding functions to the dif-ferent areas of the provincial territory. Therefore,
• it reviews and considers the characteristics of the province within the region;
• it identifies and analyses existing spatial structures and pat-terns of spatial development;
• it formulates the desired overarching spatial structure of settlements and infrastructure, open space and areas with particular functions, as well as their interrelation, based upon the local need and potential and in compliance with national directions (PPPS);
• it designates functions for the different urban and rural areas and formulates corresponding measures promoting sustain-able development;
• it provides direction, orientation and restrictions to the sub-sequent Land Use Master Planning of districts and municipali-ties within the province; and
• it provides reference to mid-term development planning and investment programming of the province.
Step 1 Overview Step 2 Step 3 Step 4 Step 5 Step 6
Themes addressed in a PSP include
• the envisaged development of the overarching settlement structure within the province, constituted basically by a hier-archy of settlements (high- to low-order centres with specific linkages to their rural surroundings) endowed with social and technical infrastructure and facilities, and by development corridors connecting the centres or development poles; • the envisaged open space and landscape structure,
particu-larly for the provision of habitat and protection of ecosystems (such as forests and watersheds), agriculture and extractive industries, designation of areas for flood control, tourism and recreation;
• the suitable routes for corridors and sites for transport and supply infrastructure, ensuring the circulation and mobility of people and goods needed for economic development and ac-cess to social infrastructure, whilst avoiding or mitigating the fragmentation of ecosystems;
• areas with particular functions, e.g. areas suitable for social or economic land concessions, special economic zones, etc., while ensuring the mitigation of impacts on conflicting land uses (e.g. residential, environmental);
Measures to secure the envisaged spatial development include the prioritization and restriction of uses and functions for certain areas, or the assessment of alternative development options for sites and routes regarding their environmental and social im-pacts.
Time horizon at least 20 years
Scale 1:250,000 to 1:100,000
Planning Process
The planning procedure to design a provincial spatial plan is a sequence of six main steps that take action over the course of approximately 2 years (Figure 1). This is an indicative time-frame, assuming a smooth and un-interrupted process, which requires sufficient capacities and resourc-es. If capacity development measures have to accompany the process, the time needed for the planning would correspondingly increase.
Step 1 Overview Step 2 Step 3 Step 4 Step 5 Step 6
Step 1 Ov erview Step 2 Step 3 Step 4 Step 5 Step 6
S
teP1 P
reParation and launcH oF tHeP
rovincialS
PatialP
lanningP
roceSSTask 1.1 Introduction of spatial planning to provincial authorities
Overview
During a first discussion at provincial level (“small kick-off”, Annex 1), the main provincial au-thorities are introduced to the objectives and scope of the provincial spatial planning and discuss potentials, challenges and requirements for conducting spatial planning in their province.
Who is involved? • Initiation • Provincial Council • MLMUPC (Backstopping) • PDLMUPCC • PCLMUP (Facilitation) • Participants
• Provincial council and board of governors • Provincial technical line departments
• Representative(s) from other province where spatial planning was successfully conducted
Activities/methodology
• Conduct a meeting with provincial authorities to introduce the spatial planning approach (PowerPoint, flipcharts…). This presentation should clearly explain the overall objectives and approach of spatial planning and the added value that spatial planning brings to the existing planning processes.
• A resource person (MLMUPC or external) should be invited to present a case study of spatial planning conducted in other provinces.
• Facilitate a discussion on the potentials, challenges and requirements for conducting spatial planning in the province and the overall scope of such a plan.
• Encourage active participation of all participants (allow sufficient time for debate). • Agree on the next steps (1.2 – 1.4) with a tentative time schedule and responsibilities.
Desired outputs
• Provincial authorities understand the objectives and overall procedure of spatial planning and express commitment and ownership for the process.
• Provincial council gives a green light to pursue the process.
Overall objectives
• Creation of understanding and ownership for the spatial planning process • Identification and involvement of all relevant stakeholders
• Clarification of roles and responsibilities
Step 1 Ov erview Step 2 Step 3 Step 4 Step 5 Step 6
• Agreed list of next steps with indicated responsibilities and tentative time schedule.
Task 1.2 Establish the provincial spatial planning agencies
Overview
A Provincial Committee for Land Management and Urban Planning (PCLMUP) chaired by the Provincial Governor shall initiate and coordinate the planning process. Each line department will be represented in this committee. The PCLMUP shall be assisted by a secretariat (hereafter “pro-vincial working group” (PWG), which is headed by a deputy director of the pro“pro-vincial department of land management, urban planning, construction and cadastre (PDLMUPCC) and is as well composed of representatives from provincial hall, concerned departments and organizations. The provincial council shall decide on the actual composition of the PLUMPC and approve as well the composition of the PWG. (See further Sub-Decree 77, RGC, 2013, in particular Article 03)
The PWG is assigned to design and implement the spatial planning process: collection and analy-sis of all necessary data, maintenance of a spatial planning database, and design of maps, elabo-ration of future spatial planning options and drafting of the spatial planning technical report. It is important that the function of spatial planning as an integrative mechanism is reflected in a cross-sector composition of the PWG. Ideally, the members of the working group are technical staff from the different technical line departments represented in the committee. Optionally, the working group can include members from non-state organizations (private sector, NGOs, etc.). If the PWG is not technically involved in the planning process, a core working group needs to be assigned to carry out this task.
Who is involved? • Initiation • Provincial Council • PDLMUPCCC • PCLMUP • Participants
• Provincial board of governors
• Provincial technical line departments
Activities/methodology
• The assignment of the PWG should go along with assigning roles and responsibilities of the PWG as well as identifying a work plan. The PWG will need an office provided by the provincial administration, ideally located at the PDLMUPCC. This office needs to be equipped with the relevant IT and other office facilities.
• Hint: If properly prepared, this task can be integrated in the small kick-off workshop (Task 1.1) already, as relevant authorities are present there and reassembling them once more will be time-consuming.
Desired outputs
• The provincial spatial planning agencies (PCLMUP and PWG) are officially established: • The provincial council assigns a PCLMUP based on the provisions of Article 03 of
Sub-Decree 77.
• The provincial council approves the assignment of a cross-sector PWG to carry out the technical spatial planning tasks.
Step 1 Ov erview Step 2 Step 3 Step 4 Step 5 Step 6
• Sufficiently equipped office space is identified and provided for the PWG.
Task 1.3 Enable the spatial planning agencies
Overview
How long the planning process will take as well as the quality of the process and the eventual plan, depend to a high degree on the capacity of the concerned spatial planning agencies. A team-building workshop with all members of the PCLMUP and the PWG is a good opportunity to explain in detail the scope and procedures of the provincial spatial planning process and to assess the existing and required capacities in the PWG to carry it out. This includes a discussion and agreement on the roles and tasks of each member.
Who is involved?
• Participants
• PCLMUP & PWG
• Trainer(s) (MLMUPC or external)
Activities/methodology
Possibly in connection with an initial team building workshop for the PWG: • Deliver a detailed introductory training on provincial spatial planning.
• Facilitate a discussion on roles and responsibilities as well as on modes of work.
• Conduct an assessment of existing skills and capacity needs among the members of the PWG, to support the identification of roles and responsibilities as well as for required capacity de-velopment.
• A code of conduct should be agreed, detailing the roles and responsibilities and the working schedule, based also on the capacity assessment.
• The workshop should be used to develop or scrutinize existing work and budget plans, at least for the remainder of the year.
• Hint: One possibility to foster the effectiveness of this task would be to visit a province which already formulated a PSP and to involve their experiences also with regard to the work ar-rangements, planning and budgeting.
Desired outputs
• Improved understanding of scope and procedure of provincial spatial planning, as well as of the roles and tasks of the PWG.
• A work plan is elaborated and agreed by all team members, including roles and tasks of the members of the PWG (code of conduct).
• Based on the identified roles and needs, a capacity development curriculum is developed for the different members of the PWG.
• Based on this training curriculum, training resources (resources person, support budget, etc.) are to be identified.
Step 1 Ov erview Step 2 Step 3 Step 4 Step 5 Step 6
Task 1.4 Identification and gathering of stakeholders
Overview
Once the provincial spatial planning agencies are in place, the different actors with a stake in the planning process or its implementation are identified and brought together in a meeting (“large kick-off”). The objectives and scope of the provincial spatial planning will be presented to them and their roles and necessary contributions will be discussed. An initial gathering is organized to discuss the expectations of stakeholders regarding the spatial planning process and the key spatial development issues to be addressed. Further stakeholders could be proposed within this meeting. Who is involved? • Initiation • Provincial Council • PCLMUP & PWG • Participants
• All stakeholders (Table 1)
Activities/methodology
• Facilitate a discussion among PWG or PCLMUP to identify all relevant provincial spatial plan-ning stakeholders, such as those of relevance to the process as well as those instrumental for or concerned by its implementation (Table 1 presents a non-exhaustive list of institutions).
Table 1 List of potential stakeholders in provincial spatial planning
Sector Stakeholders
State institutions
Provincial unified administration Provincial line departments
District administrations (council and/or board of governor) Provincial association of commune councils
Natural disaster management committee State land management committee Watershed management committee
Non-State Actors
Private sector
Chamber of commerce
Representation of ‘large’ enterprises (or federation if any) Representation of small and medium enterprises (or federation if any)
Influential land owners or developers NGOs
Provincial coordination body of local NGOs
International NGOs (e.g. concerned with climate change, rural livelihoods, environment etc.)
Bi- and multilateral
coopera-tion projects/programs Programs/Projects with relevant activities in the province Education Universities
Civil society Religion, youth/women associations, indigenous peoples as-sociations and other representatives of other population groups concerned by provincial spatial planning
Step 1 Ov erview Step 2 Step 3 Step 4 Step 5 Step 6
• Organize a workshop with a presentation to introduce the overall objectives, approach of spatial planning and the expected contributions from different stakeholders. External resource person can present a case study of spatial planning conducted in other provinces.
• Facilitate group work discussions (brainstorming) to discuss expectations of stakeholder to-wards the process, their readiness to contribute and the main spatial development issues to be addressed.
• Announce the spatial planning process, scope and objectives through different media (radio, TV and newspaper).
• Keep in mind to maintain and update the list of stakeholders in the PWG throughout the plan-ning process. It can be helpful to draft a comprehensive stakeholder map.
• Hint: The large kick-off workshop can be utilized for starting or at least setting the stage for the data collection (Step 2, Task 2.1). This will require providing some additional information in this regard together with the invitation to the stakeholders, best facilitated by preparing and sending a standardized form in which to indicate the existing data of the stakeholder, its type (or format), last update, contact details for further clarification as well as other required information. This form would be collected during the kick-off and time should be allocated to discuss this in general as well as next steps to follow.
Desired outputs
• Relevant stakeholders are identified for provincial spatial planning (stakeholder map). • Stakeholders are aware of and understand the general spatial planning process. • Clear commitments from different stakeholders to engage in the process are identified. • Key priority issues to be addressed in the provincial spatial plan are mapped out.
Step 1 Ov erview Step 2 Step 3 Step 4 Step 5 Step 6
S
teP2
S
ituation analySiS(
diagnoSiS)
Task 2.1 Data collection and database management
Overview
The process starts with a compilation of all existing data relevant to provincial spatial planning collected from different sectors, compiled, verified and consolidated in a multi-sector spatial plan-ning database. It is particularly important to mobilize all provincial line departments at this stage. It is important to understand that this task is not yet about planning areas or sectors, it just provides the key information and understanding of the current situation. It forms the basis for an integrated analysis and subsequently the planning described in step 4.
Who is involved?
• Initiation and implementation • PWG
• Database/GIS expert
• Trainer(s) (MLMUPC or external) • People consulted
• Stakeholders (Table 1)
Activities/methodology
• Identify a clear spatial database structure based on thematic main and sub-categories (Table 2). It is important to take this task seriously, as it is a foundation for the entire planning pro-cess.
• Structure the data collection and database management according to a data requirement list that provides an overview of the data needed for the provincial spatial planning (Annex 2). • Conduct a preliminary compilation of secondary data by using open access data repository
(identified in Annex 2).
• In order to capture data that might not be retrieved in the open access repositories, initiate a complementary process of data collection with each provincial technical line department and relevant non-state actors (see Hint for Task 1.4). Each member of the working group should be responsible for data collection within his/her own institution. It is highly recommended col-lecting time-series data to allow for trends analysis.
Overall objectives
• Collection and verification of secondary data, complemented where necessary with pri-mary data to be surveyed
• Establishment of a unified provincial spatial database
• Identification and analysis of existing spatial structure and patterns of spatial develop-ment of the provincial territory
• Systematic review of strengths and weaknesses of all spatially relevant sectors and is-sues as well as discussion of related needs, potentials, options and threats
• Compilation of a summary of spatial information, facts and figures on the current situa-tion of the provincial territory, as a basis for subsequent analysis
Step 1 Ov erview Step 2 Step 3 Step 4 Step 5 Step 6
Table 2 Overall structure of the Spatial Planning Database System
Main Category Sub-category
Administration Boundaries and administrative centres Biophysical Environment Topography
Climate
Hydrology (Water Resources) Geology
Soil
Ecology and Environmental Risks Population & Settlements Demography
Structure of settlements (rural and urban) Land Use and Land Tenure Forest cover and management
Protected areas Agriculture Fisheries Built-up areas Quarry Tenure
Physical Infrastructures Transport (roads, rail, air, water) Energy
Waste management
Water management (dykes, dams, irrigations…) Social and cultural services Health
Education
Heritage (archaeological, architectural) Economy Economic Development
Employment
Commerce and Trade Agriculture
Industries
Tourism and Recreation
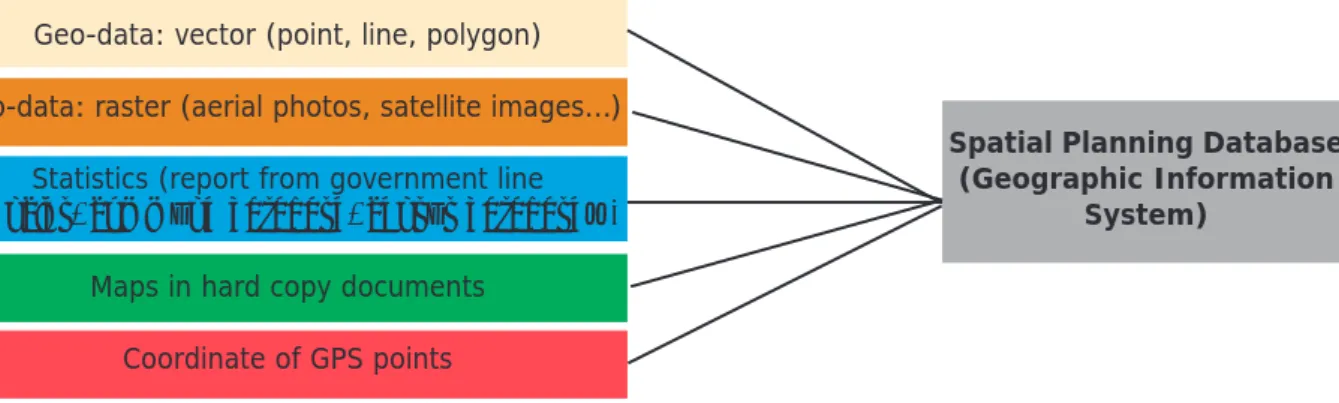
• Integrate all data in a structured spatial planning database system, so all data can be rep-resented on a map. This integration requires specific data manipulations depending on the format of data to be entered into the database (Figure 2). Geo-data are data with specific geo-referenced attributes so that they can be represented and combined (layered) with oth-ers on a map. In addition to these geo-data, there are a number of data relevant to spatial planning which do not necessarily have spatial attributes.
Types of data:
• Geo-data exist as vector with features represented as point, line or polygon
• Geo-data exist also as raster in which the features are represented in a grid of pixels • Maps that are available only on hard copy documents can be scanned and integrated by
geo-referencing in a geographic information system
• Statistics available for specific administrative units (commune, district) can be linked/ joined to existing administrative geo-data and then be represented
• Secondary GPS survey data with coordinate of X-Y data can be entered in the system and use to generate geo-data
Step 1 Ov erview Step 2 Step 3 Step 4 Step 5 Step 6
Figure 2 Integration of relevant spatial planning data into a spatial planning database
• While checking quality, consistency and completeness of all data, ensure that the coordinate system is similar for all data of the spatial database (projection and datum). In this per-spective, it is recommended using the following coordinate system for all spatial data: Ellipsoid: Everest 1831, Projection: UTM, Horizontal Datum: wgs84.
• For each data in the database, a clear meta-database file has to be created based on stand-ardized rules with complete description of data (sector, detail, type, update, source, etc.) (Figure 3)
Figure 3 Screen shot in the spatial planning database and meta-database file
Desired outputs
• A computerized spatial database with a clear structure and meta-database, which includes all data relevant for the spatial planning process.
Geo-data: vector (point, line, polygon) Geo-data: raster (aerial photos, satellite images...)
Statistics (report from government line agencies, commune database, census database…)
Maps in hard copy documents Coordinate of GPS points
Spatial Planning Database (Geographic Information
Step 1 Ov erview Step 2 Step 3 Step 4 Step 5 Step 6
Task 2.2 Data analysis and maps production
Overview
At this stage, data will be analysed to understand the current spatial structure (existing situation or static analysis) and patterns of spatial development (identification of trends or dynamic analy-sis) relevant to later on draw conclusions for the future spatial development of the province. This basically means to understand the relevance of different sectors (e.g. tourism or agriculture) for the different areas of the province and vice versa. It has to be decided which areas of the province are of particular relevance to different sectors or even more generally to the economy or the en-vironment. Sector and thematic maps are prepared to support these analyses and represent the results with geographic attributes. These maps will be key resource documents in further plan-ning tasks. While not the most difficult task of the planplan-ning process, finalizing a complete data analysis is a major task and should be well planned and sufficient work time allocated. Each map should have a scale ranging from 1:250,000 to 1:100,000 and should be printed on a paper size that allows representing that scale (A0, A1 or other depending on the aerial size of the province).
Who is involved?
• Participants • PWG
• Database/GIS expert
Activities/methodology
• Organize data analysis sessions on all relevant sectors and themes (see below), in which the PWG should check accuracy, completeness and relevance of the information, but most im-portantly try to understand and document respective spatial patterns. This requires sufficient skill within the PWG to conduct spatial analysis and to interpret produced maps. It will be necessary to involve responsible line departments or other stakeholders on particular topics of their expertise. Some information will be sufficiently analysed in a ‘static’ way (at a given time), other information will require a ‘dynamic’ (over time) analyses, basically concluding on the change of comparable data over certain time periods.
• An overview of all the required spatial and non-spatial data and the corresponding sources for accessing them is attached in Annex 2. It is recommended to always have this list ready at hand throughout this task.
• In a parallel process, organize mapping sessions (assisted by GIS) to represent the results of data analysis spatially or to conduct spatial analysis. There is considerable back and forth movement between data analyses and mapping.
• To enable the working group in this rather complex task, a number of key points and ques-tions are proposed that need to be addressed during the analysis phase. Specific examples from spatial planning processes in Battambang, Kampong Chhnang and Takeo are provided as illustrations.
• Short thematic reports should be formulated, comprising the respective map, an explanation of the displayed information as well as an initial conclusion (based on internal discussion and interpretation of the map).
• Hint: Spatial analysis and map and data interpretation can’t be sufficiently understood from a theoretical point of view, they require quite some practical experience. Where such robust experience is not available in the PWG, external trainers or advisors should be involved to provide respective trainings and/or facilitate this process.
Step 1 Ov erview Step 2 Step 3 Step 4 Step 5 Step 6 Desired Output
• A complete set of all relevant sector and thematic maps is produced. The list of maps that are required is given in Annex 3. Outline Structure of the Provincial Spatial Plan.
• Each map is accompanied by a short text that describes and explains the main information presented on the maps and their relevance to the spatial structure and development of the province.
• In the section below, necessary and optional data/outputs are mentioned to distinguish those which are essential to conduct the planning process from those which rather have a support-ive character.
A) Administration
Relevance: Clear data and information about the internal administrative divisions in the province
(district/municipality, commune/sangkat and villages) is needed to determine the administrative jurisdiction responsible for planning measures. Furthermore, many of the analyses in this chapter require comparison of data within different local administrative levels.
Data required
Necessary Optional
Provincial boundaries
Number, names, code and boundaries of districts, communes and villages
Names and locations of provincial, district, com-mune and village centres
Boundary issues, if any
Potential or alternative future boundaries, adminis-trative consolidations or subdivisions
Analysis and outputs
• Check updates available at provincial level and check any discrepancies with national dataset from MoP (e.g. census database). In Cambodia, boundaries are regularly discussed and modi-fied, so it is important that the PWG keeps a close eye on any updates.
• Agree on spelling of names and English transliteration if needed.
• Specify and map the internal boundaries of districts pertaining to the province.
• Identify where unclear commune/district boundaries lead to unresolved conflicts. Discuss how these conflicts are managed and how a resolution could be supported.
• In some instances, while the present boundaries are clear, there is indicative information for future changes of boundaries. This might be limited to redefined boundaries, or even include subdivision or consolidation of current administrative territories, affecting also the number of administrative centres. This is a considerable challenge for the spatial planning process: How to plan for areas which might only be in the future part of the planning territory or by which mandate? Why plan for areas, which will soon no longer be part of the planning territory? And how to deal with the uncertainty of this change to come or not? The PWG needs to discuss this thoroughly and to think about implications and alternatives for the planning process. These should be presented to the PCLMUP to seek a decision for the territory to be planned. Guidance of the NCLMUP, as the approving body, should be sought if provincial or district/ municipal boundaries are affected.
Step 1 Ov erview Step 2 Step 3 Step 4 Step 5 Step 6
Map 1 Name and location of the different administrative units in Battambang Province
B) Biophysical Environment
Relevance: The biophysical characteristics of an area influence the range of suitable uses and
functions of its land. Maintaining live- and livelihood-supporting functions of the biophysical envi-ronment is a key aspect in ensuring the sustainability of the provincial land management.
Climate
The characterization of climate is important because - in association with topography and soil - it determines the agro-ecological potential of an area. Climate determines the water cycle, influenc-es the availability of water in the ecosystems and conditions the productivity and the agricultural development. Moreover, in a context of growing climate-change uncertainty and environmental change, climate has become a central concern for planners and decision-makers. Climate change is perceptible mostly in the transformation of the water cycle and occurs through natural disaster (e.g. drought, flood, storm), which are very likely to become more intense and frequent in the future (IPCC, 2013).
Data required
Necessary Optional
Monthly rainfall and temperature data Daily rainfall and temperature data Long-term rainfall and temperature data Multi-site rainfall and temperature data
Step 1 Ov erview Step 2 Step 3 Step 4 Step 5 Step 6 Info-Box
Weather Climate Climate Change
Weather reflects short-term con-ditions of the atmosphere (tem-perature, humidity, precipitation, cloudiness, brightness, visibility, wind, and atmospheric pressure)
Climate is how the atmosphere “behaves” over relatively long pe-riods of time.
Climate change refer to changes in long-term averages of daily weather (usually involving com-parisons between periods of three decades)
Analysis and outputs
Compile updated monthly temperature and rainfall precipitation (available at both provincial and national level in the Ministry of Water Resources and Meteorology (see Annex 2). Both datasets can be easily combined in a so-called ‘ombrothermic’ diagram (Figure 4), which depicts the varia-tion of monthly average temperature and total precipitavaria-tion for a selected place. Simple and free software to generate these kind of diagrams are available online (see for instance http://www. becyhome.de/news_eng.htm). Provided that precipitation scale equals 2 times the temperature scale (see diagram below), the diagram allows identifying drought-prone periods (when the pre-cipitation value is lower than temperature curve). This information is important to consider for planning agriculture development measures in subsequently developed District Land Use Master Plans.
Figure 4 Ombrothermic diagram for a station located in Kampong Chhnang - yellow areas indicate months with potential drought
Optional
• Depending on the availability of data the PWG could further engage into spatially more de-tailed and time-series analysis:
• If rainfall data are available for several stations in the same province, so called Thiessen polygons can be defined to differentiate areas having different rainfall patterns (Map 2). • If climate data have been recorded over a longer time period, one can engage in time
series climate data analysis, which is important to identify possible changes in rainfall or temperature. Subsequent DLUMP planning would particularly benefit from being in-formed about how the monthly distribution of rain has changed over the years as it determines crop calendars and cultivation periods (Figure 5).
• If daily records of temperature or rainfall are available, the analysis of extreme weather events (rainfall or temperature) can be conducted by computing climate change indices
Step 1 Ov erview Step 2 Step 3 Step 4 Step 5 Step 6
(http://etccdi.pacificclimate.org/indices.shtml) and analysing their trend (Figure 6).
Map 2 Thiessen Polygons of rainfall area in Siem Reap River watershed
Figure 5 Change in rainfall distribution (Battambang station) between 1920-1930 and 1990-2000 showing a clear change in rainfall distribution between 1920-1930 and the 1990-2000 decades.
Step 1 Ov erview Step 2 Step 3 Step 4 Step 5 Step 6
Indices Trends 1981-2012 Month of Occur-rence (mode)
Wdays>1mm =Annual Count of wet days when
precipi-tation >1mm Increase September (n=500)
PRCTOT =Annual Total Precipitation on wet days (rainfall
> 1mm) Increase N-A
SDII =Simple Precipitation Intensification Index =
PRC-TOT/Nb Wet days (rainfall>1mm) Decrease N-A
Max. CWD>1mm =Annual Number of consecutive Wet
Day (when rainfall > 1mm) Decrease Sep (n=10)
Max CDD<1mm =Annual Number of consecutive Dry
Days (when rainfall<1mm) Decrease N-A
Rx1day Rx1Day =Annual Maximum 1 day precipitation Decrease October (13)
Rx5days Rx5D =Annual maximum consecutive 5-day
precipitation Increase October (12)
R20mm =Annual Count of days when Rainfall>20mm Increase October (124)
R25mm =Annual Count of days when Rainfall>25mm Increase October (89)
R50mm =Annual Count of days when Rainfall>50mm Increase October (32)
Figure 6 Extreme rainfall analysis (Battambang Station) between 1981 and 2012 showing that extreme precipitation, indicated with most relevant indices, tend to increase and to occur predominantly in October
Topography
Detailed information about terrain and surfaces is essential for the planning and of any major infrastructure or reclamation project. Topography also influences soil types, the shape of river catchment areas and the location of built-up structure and open-space areas.
Data required
Necessary Optional
Contour lines (vector)
Digital elevation model (raster) Slope (raster)
Hill shade (raster)
Analysis and outputs
• Compute maps showing topography information (elevation and/or slope)
• Generalize this information and identify landforms where relief and slope present relatively uniform patterns
• Identify areas with steep escarpments where soil erosion is potentially a problem • Identify flat lowland where flood is potentially a problem
Step 1 Ov erview Step 2 Step 3 Step 4 Step 5 Step 6
Map 3 Topography in Kampong Chhnang – elevation above sea level (left) and slope (right)
Geology and Soils
Geology analyses the solid earth and rocks that soils are made from. Soil is the medium of plant growth and thus of imperative relevance for agriculture; it is inextricably linked to the water cycle and an important habitat. Overall evaluation of soil characteristics throughout the province in-forms the identification of the type of agriculture development measures that can be envisaged.
Required data
Necessary Optional
Soil fertility data more specific information about soil types based on internationally recognized classification such as FAO (Annex 2)
Analysis and outputs
• Soil type identification and analysis can be a very complex exercise, but simplified soil infor-mation is available. Map and assess the overall soil fertility in the province.
• Identify soils that should be preserved for agriculture or forestry.
Optional
• Identify and describe the main soils types: understand their main hydrological, physical and chemical characteristics as well as their aptitude for specific types of agricultural land use.
Step 1 Ov erview Step 2 Step 3 Step 4 Step 5 Step 6
Map 4 Distribution of main soil type (left) and their overall fertility (right) in Kampong Chhnang province
Hydrology (Water Resources)
Water resources management is a primary concern in all provinces of Cambodia. Access and use of water is essential to support life, the development of agriculture and ensure the transport of people and goods. Water is a resource in movement so the analysis shall focus on both the ele-ments of stock and the flow of resources between these stocks.
Data required
Necessary Optional
Flowing waters (main rivers, streams, canals), still
waters (wetlands, lakes and ponds) Water level and discharge for main rivers
Analysis and outputs
• Identify, map and describe the main water streams and bodies and the water status during rainy and dry season.
• Identify the main sources of water for human consumption and for agriculture (from spring/ well, ponds/lake, river/stream).
Step 1 Ov erview Step 2 Step 3 Step 4 Step 5 Step 6
Map 5 Main water resources in Kampong Chhnang
Ecology and Environmental Risks
Ecology analyses the interactions between organisms and their environment, often focused on ecosystems, which represent the spatial spheres of these interactions. Their boundaries are not easy to determine, and different ecosystems, such as watersheds, forests or wetlands, often overlap. Ecosystems have many functions and provide various services, many of which are es-sential for human life and activities. Vice versa, human activities influence the functionality of ecosystems, and thus the availability of the respective services. Understanding ecosystems and managing them sustainably, for example through avoiding degradation or pollution of watersheds or fragmentation of habitats, is therefore at the core of successful land management. In Cambo-dia various projects have generated information on ecosystems and ecological diversity, but com-prehensive information is limited and varies from province to province. An opportunistic approach is recommended, based on the available information in the respective province.
Furthermore, natural disasters such as droughts or floods may immensely affect human liveli-hoods. Cambodia has a long record of natural disaster (Centre for Research on the Epidemiology of Disasters, 2011), but their occurrence is likely to increase in the future in the context of climate change. Information about natural disaster is essential to target efforts of mitigation and
adapta-Step 1 Ov erview Step 2 Step 3 Step 4 Step 5 Step 6
tion. The PSP should in this regard only be the starting point for a disaster risk reduction plan to be developed by the Provincial Natural Disaster Management Committee.
Data required
Necessary Optional
Boundaries of watershed ecosystems (by MRC) Areas with (potential and actual) risk of significant water pollution
GENE-ecological zoning (by FA / Cambodia Tree Seed Project, 2003)
Flood and drought prone areas
Data on ecosystems and natural resources (InVEST tool by RUPP and WWF)
Secondary data available on flood in the central Tonle Sap area.
Info-Box
GENE-ecological zoning InVEST Tool
The Cambodian tree seed project is a very good reference to comprehend the ecological diversity (mostly flora). The concept developed by this team is that of ‘gene-ecological zoning’, which differenti-ates areas with uniform ecological conditions that produces distinctive phenotypic genetic character-istics within trees species (Cambodia Tree Seed Project, 2003). The concept and the approach are operational for environmental assessment as it pro-vides a simple and cost-effective tool to organize and prioritize action plans for the conservation of important timber-tree species.
“InVEST enables decision makers to assess quan-tified trade-offs associated with alternative man-agement choices and to identify areas where in-vestment in natural capital can enhance human development and conservation.” (http://www. naturalcapitalproject.org/invest/) The RUPP in co-operation with WWF has conducted extensive data gathering and analysis with regard to ecosystems, natural resources and biodiversity through applica-tion of the InVEST tool. Where available, this is pro-viding very informative data and maps, allowing for identifying areas with particular relevance for pro-tecting the functioning of ecosystems and services.
Analysis and outputs
• Compile and map available relevant information on ecosystems, such as watersheds, and ecological diversity and corresponding threats:
• The MRC has mapped watershed catchment areas. “Understanding watershed structure and natural processes is crucial to grasping how human activities can degrade or improve the condition of a watershed, including its water quality, its fish and wildlife, its forests and other vegetation, and the quality of community life for people who live there. Know-ing these watershed structural and functional characteristics and how people can affect them sets the stage for effective watershed management” (O’Keefe, Elliott, & Naiman, Sine Die).
• Information on zones with distinguished ecological diversity are available from the Cam-bodia Tree See Project (through FA). Map the different Gene-Ecological zones in the province.
• Understand the importance and relevance of ecosystems and natural resources, identify areas of particular importance for ecosystem functioning.
• Get a sense of the potential up-stream / down-stream water management issues within watershed ecosystems.
• Identify (actual and potential) sources of pollution for ecosystems, in particular for wa-tersheds, due to settlements, industries, mining activities etc.
• Compile and map areas prone to natural disasters, such as drought and flooding: • Map areas exposed to flood
Step 1 Ov erview Step 2 Step 3 Step 4 Step 5 Step 6
of land use affected: agricultural, settlement, infrastructures, industries etc.)
• Get a sense of the differences of flooded area between a minor, medium and major flood • Map areas prone to drought
• Understand the characteristics of droughts (duration of drought, impact on agriculture, etc.)
• Understand how drought and flood have evolved over time, e.g. in the context of climate change.
Optional
Detailed analysis and mapping of flood revealing the progression of flood front over time, based on time-series data for the central area Tonle Sap flood plain (using RADAR technology). This information is useful to understand the extent of the flood area under different scenarios (minor, medium or major flood) as well as the progression of a flood front.
Map 6 Ecosystems in Kampong Chhnang: Watershed Areas (left) and GENE-Ecological zones (right)
Step 1 Ov erview Step 2 Step 3 Step 4 Step 5 Step 6
Map 7 Flooded area in Kampong Chhnang, under three levels of magnitude
Step 1 Ov erview Step 2 Step 3 Step 4 Step 5 Step 6
C) Land use and land tenure
Relevance: In the context of a provincial spatial plan, information about land use and land
ten-ure are central as the plan aims to find a balance between the envisaged open space structten-ure, particularly for the provision of habitat and protection of ecosystems/watersheds, agriculture and extractive industries with the settlement/urban structures and the infrastructure connecting them. Land use refers to the utilization of land resources by people. It involves the management and modification of natural environment into built-up environment such as fields, pastures, and set-tlements.
Tenure arrangements include land access rules and their formalizations, including registered pri-vate or communal land, state land concessions (social and economic or mining purposes), pro-tected areas, as well as co-management entitlements (community forestry, community fisheries and community use zones in protected area).
Land use/land cover update
In order to establish good reference maps describing the land use in the province, it is necessary to conduct a first updating process of the data available. The 1999 land use coverage of very good quality (the so-called JICA data set) that exists for the entire country is now well outdated, and according to the secondary data available, the PWG needs to initiate a first land use update process.
Use existing secondary data for this update. The interpretation of aerial photos or satellites images into land use categories will certainly help generating land use layers with high spatial resolution. There are many types of satellite imagery (of different resolution and price) available to conduct it. The PWG could also check the availability of free aerial photo through the “Google Earth” portal, at the Department of Geography or via the USGS portal, which provides all archived Landsat scenes at no charge to any users (see Annex 2).
Expertise in remote sensing is necessary to interpret satellite images in order to obtain a mean-ingful land use classification, but simple digitization of data ‘on the screen’ is a much easier task to perform. In addition to a computer-based classification of satellite imagery, field surveys as-sisted with GPS can complement the updating process when specific geographic features need to be recorded and mapped. This first land use update provides a preliminary indication about land use changes.
Step 1 Ov erview Step 2 Step 3 Step 4 Step 5 Step 6
Map 9 Land Use updating process in Takeo: 1999 Land Use Map (left); Updated Google Earth image (middle) and Updated 2014 Land Use Map (right)
Forest cover and management
Forests stabilize water flows within watersheds and are sources of timber and non-timber prod-ucts that are important for rural livelihoods. Forests provides fuel wood that is usually the main source of energetic supply for rural and some urban households and construction wood (e.g. fencing material). Forests also offer protection for spirits and in ethnic minority regions parts of forest are allocated as burial sites. Forest resources play an important role in climate change mitigation and forestry is a relevant economic sector in some provinces.
Data required
Necessary Optional
Updated forest cover Forest concessions (if any) Protection forests (if any) Community forestry (if any) Forest plantations (if any)
Payment for Ecosystem Services schemes (if any) REDD+ schemes (if any)
Fauna: main animal species Floristic description of forest
Analysis and output
• Map and describe the forest cover (area size and density, degree of fragmentation). • Map and analyse the current location and management of :
• protected forests,
• community forestry schemes, • REDD+ schemes,
• forest under PES schemes, • forest concessions,
• tree plantations and nurseries,
Step 1 Ov erview Step 2 Step 3 Step 4 Step 5 Step 6
• For all forms above discuss and document strengths and weaknesses as well as potentials for further extension or allocation.
Optional
• Description of main forest resources types, biodiversity, fauna & flora, main species, etc.
Map 10 Existing forest cover and the different types of forest management across Kampong Chhnang province
Fisheries Management
Fisheries play a crucial role in the lives of Cambodians and in the country’s economic growth as well as in the environmental protection, conservation of biodiversity, good governance and poverty alleviation (Fisheries Administration, 2011b). Fisheries consist of freshwater fish capture, marine fishing and aquaculture. A recent study by Inland Fisheries Research and Development Institute (IFReDI) (2013) found that the second largest food source after rice is aquatic resources (i.e. fish and other aquatic animals such as crabs, molluscs and frogs), at a 63 kg/person/year, representing 76% of the total animal protein intake of Cambodian people. Given the significance of fisheries for Cambodians, it is essential to ensure a sustainable management of the fishery resources.
Step 1 Ov erview Step 2 Step 3 Step 4 Step 5 Step 6 Data required Necessary Optional
Fishing grounds (freshwater fish capture, marine area and aquaculture)
Community fisheries Fisheries conservation area
Fish catch
Description of fishing grounds ecology: fish and other aquatic animals inventories
Analysis and outputs
• Map and describe main fishery grounds (area size, types of fisheries resources).
• Map and describe the location and status of community fisheries schemes, analyse strengths and weaknesses as well as the need or potential for further development.
• Map and describe the location of the fisheries conservation areas left after removal of fishing lots, analyse strengths and weaknesses as well as need or potential for further development.
Optional
• Describe main fisheries resources types, biodiversity, fauna & flora, main species, fish stock, etc.
Map 11 Location of the existing fishing grounds and the different types of fisheries management across Kampong Chhnang province
Step 1 Ov erview Step 2 Step 3 Step 4 Step 5 Step 6
Protected area management (flora and fauna conservation)
Protected areas are established under the jurisdiction of the Ministry of Environment (MoE) to en-sure protection of the environment, land, forests, wetlands and coastal areas. They are reserved for wildlife protection, to ensure stability of watersheds and to protect nature and scenic views with scientific, educational and entertainment significance. While sustainable management of land and natural resources must not be confined to protected areas, there targeted management makes them a key instrument in sustainable territorial development.
Data required
Necessary Optional
Location of protected areas and major functions Internal zoning (if any)
Description of the ecology and biodiversity in these protected areas
Analysis and outputs
• Map the location and type of protected areas (national parks, wildlife sanctuaries, protected landscapes, multiple use areas, Ramsar sites, biosphere reserves, natural heritage sites, ma-rine parks)
• Analyse the effectiveness of resource protection, main issues affecting their management and the counter-measures taken.
• Map and analyse the zoning of protected areas under the management of the Ministry of Environment:
• Core zone
• Conservation zone • Sustainable use zone • Community zone
• Discuss the needs and potentials for further improvement of protected areas management.
Optional
• Description of main forest or fisheries resources types within protected areas: biodiversity-fauna & flora, main species, bio-diversity, etc.
Step 1 Ov erview Step 2 Step 3 Step 4 Step 5 Step 6
Map 12 Existing protected areas across Kampong Chhnang province
Agriculture
Agriculture is of paramount importance and one of the most dominant land uses in Cambodia. It contributes significantly to the GDP and provides employment to a large majority of the popula-tion. Agricultural production needs to address the food security of a growing population, address the diversification of food demand and generate export income. Also, much of Cambodia’s forest areas have been converted for agricultural purposes, while sub-urban agricultural areas have become part of extended residential areas.
Agriculture is a central element in integrated spatial planning in basically every province. While the more detailed agricultural sector strategies have to be developed and spatially integrated at the district level, the PSP will have to determine the trajectory of future land use change regarding the competing functions and uses of the open landscapes of the province.
Data required
Necessary Optional
Cultivated areas and yield of main crops, clearly dif-ferentiated between rice, annual non-rice crops and perennial crops
Areas of agricultural product storage and process-ing
Description of cropping and livestock systems, in-cluding technical indicators such as costs of produc-tion, profitability, etc.
Step 1 Ov erview Step 2 Step 3 Step 4 Step 5 Step 6
Analysis and outputs
• Compute and map the cultivated areas and analyse the distribution of crops across the prov-ince (in relation with variables of bio-physical environment).
• In regions with indigenous people, it is important to identify swidden agriculture land use systems, which usually co-exist in a mosaic with permanent agriculture land use patterns. It is also important to include all land tenure arrangements of indigenous people, whether already formalized by communal title or not. On a provincial scale, a general indication in this regard might be sufficient, but a detailed mapping would have to be done at the district and commune planning levels.
• Map areas with relatively low/high levels of agricultural intensification or diversification; iden-tify agro-industrial areas in economic land concessions or as part of large landholdings.
Optional
• Characterize and analyse the different rice and non-rice cropping systems: • Seasonal calendar (dry & rainy seasons)
• Average yields for rice and non-rice production
• Production constraints (land, water, labour, technology, access to inputs…) • Commercialization constraints (access to market, cost-price, sale price…)
Map 13 Importance of cultivated area size (by commune) in 2012 across Kampong Chhnang province