GEOPHYSICAL RESEARCH LETTERS, VOL. 13, NO. 8, PAGES 769-772, AUGUST 1986
DETECTION OF CARBONYL FLUORIDE IN THE STRATOSPHERE
C.P. Rinsland 1 , R. Zander
2 , L.R. Brown
3, C.B. Farmer
3 , J.H. Park 1,
R.H. Norton •, J.M. Russell III 1, and O.F. Raper
•
1Atmospheric
Sciences Division, NASA
Langley Research Center
2Institute of Astrophysics, University of Liege, Belgium
'•Jet Propulsion Laboratory, California Institute of Technology
Abstract. Infrared solar absorption spectra collected using one of six overlapping broadband of the stratosphere recorded at a resolution of filters, covering altogether the 600 to 4700
0.01 cm
-1 by the ATMOS
(Atmospheric
Trace Molecule
cm
-1 spectral region. The spacecraft ephemeris
and
Spectroscopy) instrument from onboard Spacelab 3 (04/30 to 05/6/85) have revealed the existence of many previously unobserved absorption features in
the 1925 to 1960 cm -1 and 1249 to 1255 cm -1
regions and one at 774 cm
-1•. On the basis of
comparisons with laboratory spectra, these fea- tures have been identified as belonging to the •1, •4, and •6 bands of carbonyl fluoride, respectively. Volume mixing ratios of COF 2 between 17 and 40 km have been deduced from
analysis of the •1 and •6 bands.
Introduction
During its first mission onboard Spacelab 3 (SL3), April 30 to May 6, 1985, the ATMOS (Atmo- spheric Trace Molecule Spectroscopy) instrument recorded more than 3000 infrared solar spectra
with a spectral resolution•of 0.01 cm
-1.
About
measurements of suitable atmospheric absorption
features (e.g. CO
2 vibration-rotation
and N 2
quadrupole lines) have been used to determine the tangent heights of the spectra to better than 1 km.
As the atmospheric absorption of COF
2 is rela-
tively weak, its detection and subsequent analy- sis by spectroscopic techniques require good knowledge of molecular line parameters of both the target and interfering gases. For example, Figure 1 reproduces excerpts from two observed ATMOS spectra along with two spectra computed to correspond with the bottom observed one; the four traces are displayed with the same scale, but offset from one another for clarity. The top spectrum is an average of 46 high sun scans recorded from an orbital altitude of 360 km near 26øN lat., 54øW long.; it contains only features of solar CO. The next lower trace is a synthetic 2000 of these are "high sun,' scans containing only spectrum computed from COF 2 parameters (described solar features (absorption and emission). The
remaining ones, recorded over long atmospheric limb paths during 12 sunsets and 5 sunrises with tangent heights ranging from 10 to 150 km, con- tain a wealth of absorption features arising from several dozen gaseous constituents of the earth's atmosphere. In the present letter, we report the first stratospheric measurement of COF 2 from analysis of its absorption features
near 1937 cm
-1 and 774 cm
-1 with the additional
identification of features near 1250 cm -1. The importance of this molecule lies in the fact that it has been postulated. to be an intermediate product of the decomposition of chlorofluoro-carbons (CFC's) in the upper atmosphere [Rowland and Molina, 1975; Sze, 1978].
Data and Analysis
later) using an adjusted concentration profile obtained from model predictions (L. Froidevaux, private communication, 1985). The trace labeled "Calc." is a computed atmospheric spectrum based on line parameters similar to those of the AFGL compilations [Rothman et al., 1983a,b] with no COF 2 included. The bottom spectrum, an observed ATMOS scan corresponding to a tangent height of 20.8 kin, is seen to be the composite of the upper
three spectra; the presence of COF
2 features,
indicated by tick marks, is clearly evident.
Improvements to existing parameters in the AFGL compilations were necessary prior to the present
analysis.
Near
1937
cm
-1, new
values
for CO
2
[Rinsland et al., 1983, 1985], and H20 (R. Toth, private communication, 1986) were adopted, while
changes in CO
2 and 03 line parameters in the
vicinity of 774 cm
-1, which were made
as a pre-
requisite for quantitative investigations of
The
ATMOS
instrument
consists
basically
of a
C•,ONO
2 at 780.2
cm
-1 [Zander
et al., 1986]
and
of
double-pass
Michelson
interferometer, a telescope, HO2NO
2 near 802.7 cm
TM [Rinsland
et al., 1986],
a suntracker, and a cooled (77 K) HgCdTe detector; were also included here.
details of the instrument and its operation during
At the outset of this work, parameters of COF
2
the SL3 mission have been described elsewhere
similar in quality to those of other molecular
[Farmer and Raper, 1986]. Successive million- species had not been published for the bands point, double-sided interferograms were recorded observed by ATMOS. There existed published
from about 360 km altitude in 2.2 seconds, corres- spectral plots [Murcray and Goldman, 1981; Murcray ponding to a tangent heights separation of ~ 4.1
km. During each occultation, the data were
This paper is not subject to U.S. copyright. Published in 1986 by American Geophysical Union. Paper number 6L6174.
0094-8276/86/006L-6174503.00
769
et al., 1984], vibrational band assignments for the fundamentals [Mallinson et al., 1975], mea- surements for integrated band strengths [Hopper et al., 1968; Adams et al., 1971; Modica and Brochu, 1969], and ground state parameters based on microwave data [Carpenter, 1974]. However, no high resolution line-by-line analyses of the
?70 Rinsland et al.: Stratospheric Carbonyl Fluoride SOLAR CALC. 1.0 19•6 19• 1MO -1 cm
Fig. 1. The first detection of stratospheric
COF
2. The four spectra are an ATMOS
high sun
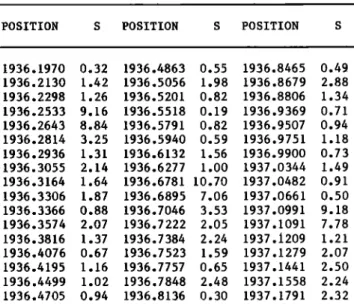
Table 2. Experimental line parameters of COF 2 used in this analysis*
POSITION S POSITION S POSITION
1936.1970 0.32 1936.4863 0.55 1936.8465 0.49 1936.2130 1.42 1936.5056 1.98 1936.8679 2.88 1936.2298 1.26 1936.5201 0.82 1936.8806 1.34 1936.2533 9.16 1936.5518 0.19 1936.9369 0.71 1936.2643 8.84 1936.5791 0.82 1936.9507 0.94 1936.28!4 3.25 1936.5940 0.59 1936.9751 1.18 1936.2936 1.31 1936.6132 1.56 1936.9900 0.73 1936.3055 2.14 1936.6277 1.00 1937.0344 1.49 1936.3164 1.64 1936.6781 10.70 1937.0482 0.91 1936.3306 1.87 1936.6895 7.06 1937.0661 0.50 1936.3366 0.88 1936.7046 3.53 1937.0991 9.18 1936.3574 2.07 1936.7222 2.05 1937.1091 7.78 1936.3816 1.37 1936.7384 2.24 1937.1209 1.21 1936.4076 0.67 1936.7523 1.59 1937.1279 2.07
(SOLAR), a synthetic COF
2, a synthetic stratos-
pheric spectrum
without
COF
2 (CALC.),
and an ATMOS 1936.4195
1.16 1936.7757
0.65 1937.1441
2.50
spectrum
at 20.8 km (see text for details). The
1936.4499 1.02 1936.7848 2.48 1937.1558 2.24
absorptions
of COF
2 are indicated
by tick marks.
1936.4705
0.94 1936.8136
0.30 1937.1791
2.32
As a result,
this study
has
had
to rely on interim * line positions
are given
in units
of cm
-! and
parameters
of limited
absolute
accuracy,
partic-
strengths
in S units
of cm/molecule
x 10
-20
ularly for line strengths. In turn, this lack of data has required that retrievals of strato- spheric mixing ratios versus altitude be done in two different ways, one method using equivalent widths, and the other fitting the shapes of spectral features, depending on the wavelength region considered.
For the 1925- 1965 cm
-1 region containing
transitions of the •1 fundamental, we have utilized line positions from a laboratory
spectrum recorded at 0.01 cm
-1 resolution with
the McMath Fourier transform spectrometer (FTS) at the National Solar Observatory on Kitt Peak. Line positions have been calibrated using H20 standards [Brown and Toth, 1985]. With these, numerous weak features of COF 2 were identified in the ATMOS data (Figure 1). As seem in Table 1, positions determined by taking first and second derivatives of both laboratory and atmos-
pheric features of COF
2 agree in all cases to
within 0.002 cm-1; this agreement
is within the
at room temperature
strengths at room temperature were also obtained from the Kitt Peak laboratory data using a non- linear least squares procedure [Brown et al., 1983]. However, since assignments were unavail- able, manifold heads were artificially represented as a smaller number of lines than is actually present. In addition, because of the rapid chemical decomposition of the sample, the absolute strengths were unreliable. Therefore, observed relative strengths were normalized to conform to a mean of three integrated band strengths [Hopper et al., 1968; Adams et al., 1971; Modica and Brochu, 1969], with the addi- tional assumptions that 80% of this mean value belongs to V l (the remainder to a nearby over-
tone band, 2v 2) and that the interval
between
1936.5 and 1939.4 cm-1 contains about 5% of the total strength of the band (K.B. Thakur, private communication, 1986). A later check of the nor- combined uncertainties of the ATMOS and laboratory malization was made using more recent Kitt Peak positions, considering that each feature may laboratory data. The absolute accuracies of the represent several unresolved transitions. Line resulting strengths is thought to be 25%. The
Table 1. Positions of selected COF 2 features in cm-1 **
ATMOS Laboratory ATMOS - Lab
1936.2570 1936.2587 -0.0017 1936.6821 1936.6820 0.0001 1937.1038 1937.1037 0.0001 1937.5232 1937.5218 0.0014 1938.3580 1938.3567 0.0013 1938.7750 1938.7736 0.0014 1939.1857 1939.1872 -0.0015
** determined from first and second derivatives of the apodized spectra
individual line parameters finally adopted are given in Table 2.
These parameters were used in a curve-fitting procedure to retrieve the values of the strato-
spheric volume mixing ratio of COF
2.
Air-
broadened half widths and lower state energies
were set to 0.1 cm-1/atm at 296 K and 120 cm
-1,
respectively. For the analysis, we used a set of zonal average spectra covering the 1100 to
2000 cm-1 region, obtained by coadding the runs
from three sunset occultations occuring near 32øN, 69øE; 31øN 92øW; and 26øN 54øW with approximately equal tangent heights of 38.5, 34.5, 30.5, 26.8, 23.5, 20.4, and 17.7 km; these spectra had initially been ratioed to a coadded "high sun" solar spectrum. Special emphasis was given to the optimum fitting of the ATMOS zonal
spectra between 1936.1 and 1937.2 cm
-1, where
three COF
2 features appear relatively
free of
Rinsland et al.: Stratospheric Carbonyl Fluoride ?71
1.0
773.0 773.5 774.0 774.5 775.0
WAVENUMBER
(cm
-•)
noted by Adams et al. [1971]. The derived inte-
grated O-branch
intensity of 1.47 + 0.22 x 10
-18
cm/molecule was extrapolated on the basis of the observed decay rate of the absorption (approx- imately 2% per hour) to the time the absorption cell (made of Pyrex with KC1 wedged windows and
Teflon valves)was filled.
Decomposition of COF
2
is believed to result from reaction with H20 out- gassing from the cell walls. Carbon dioxide was identified as a decomposition product by itsabsorption between 2200 and 2400 cm
-1.
Assuming
the integrated v 6 Q-branch intensity
noted
above, linear absorption by COF
2 in the atmospheric
spectra, and correlative pressure-temperature
profiles
derived from a set of CO
2 lines measured
by ATMDS, we have deduced the profile represented by the dotted line in Figure 3.
Numerous weak features of the v4 band have
also been identified in the 1249-1254 cm
-1 region.
Because of strong interference by CH4, N20 , C02, and H20 lines in this interval, and the lack of
complete COF
2 line parameters, these features are
less suitable for quantitative analysis than those in the other regions.
Results and Discussion
Fig. 2. Fitting results for an ATMOS spectrum in the region of the •6 band 0 branch. The
measured spectrum (solid line), produced by aver-
aging spectra recorded at a tangent height of 25.5 many of the strongest absorption features of that The COF 2 volume mixing ratios are given versus altitude in Figure 3. They constitute the first measurement of COF 2 in the stratosphere; since
40-
c a
b
COF
2 - ATIV•S/SL3
'-.. ,, ,,
'-.. /1:•.1:1•1 I'• '.. • • • I , 35- • .... • • , • , ' _1 • 10= 30
....
SUNSET
(774
cm )
•
a, b, FROI•VAUX,
19•
< c Sze, 1986 • ...:20
....
•:'"•
...
...
- 40
....
,
• x •0 -•
2
5
VOLUME MIXING RATIO
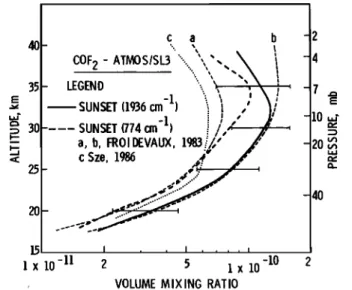
F•g. 3. Vo]u• •x•ng ratios o• carbony] E]uor•de derived from ATHOS sunset spectra, using ]•nes
belonging to the v l band (hea• •u]] ]•ne) and
the v 6 q branch (heavy dotted ]•ne).
Hode]
predictions by Fro•deva• [•983] and by Sze (private com•n•cat•on, •986) are reproduced Eor comparison (Eor deta•]s, see text). any interferences by other telluric absorptions.The resulting volume mixing ratio (VMR) profile deduced from these fittings is represented by the solid curve in Figure 3.
Analysis of COF
2 using the •6 band at 774
cm
-1 required a different approach because no line
parameters were available there, and the band occurs in a region of relatively strong absorption
by stratospheric 03 and CO
2.
Therefore, to detect
its absorption, only the lines of the interfering molecules were included in calculations of the expected spectrum in this region, in the absence of COF 2. Figure 2 illustrates this procedure. In the top panel, the weak residual absorption peak
at 774.00 + 0.02 cm
-1 is in good agreement with
the 0 branch of v 6 observed at 773.987 + 0.005
cm
-1 (S. P. Sander and R. R. Friedl, private com-
munication, 1986) in recent laboratory spectra
of COF
2 recorded
at 0.005
cm
-1 resolution.
An
analysis of these laboratory data is in progress to obtain accurate positions and assignments for
the v6 band (K. B. Thakur, private communi-
cation, 1986). Following identification, VMR
profiles
of COF
2 were obtained by measuring the
equivalent widths of the residual curve (e.g. Figure 2). To obtain the integrated intensity of this 0 branch, laboratory spectra were recorded
at 0.06 cm
-1 resolution and at room temperature
with a Nicolet FTS and a sample of 99% pure COF2, purchased from SCM Specialty Chemicals, Gainesville, Fla. The spectra were recorded within 1 month of receipt of the cylinder to minimize the slow decomposition in the container
km during 3 sunset occultations (lat. 30-33 N), and the best-fit calculated spectrum (crosses) are plotted beneath the residuals (observed- calculated). An arrow marks the location of the strongest absorption by the COF 2 Q branch.
molecule have been simultaneously observed in the ATMOS spectra, its detection is unambiguous. The values obtained from both the least squares fitting of lines belonging to the U l fundamental
of COF2 (dark solid line) and from equivalent
width measurements
of its u6 0 branch (dark
dotted line) are shown. The difference between these two curves (as high as a factor of 1.5 below 30 km) is not likely to be attributable to the fact that they were retrieved from two different sets of zonal average spectra; the latitudes and
??2 Rinsland et al.: $tratospheric Carbonyl Fluoride
longitudes of the individual occultations were not Carpenter, J. H., The microwave spectrum and markedly different. Rather, we suspect the abso-
lute values of the strengths involved in both spectral regions used for the retrievals to be in question; future work on laboratory spectra is likely to provide a clue to that discrepancy.
The potential sources of both random and systematic errors and the resulting uncertainties
in the COF
2 volume mixing ratios (values between
parentheses) are (i) in curve fitting of the 1936cm
-1 features (10 to 40%) or equivalent width
measurements
of the •6 Q branch (10 to 50%),
(ii) in the tangent height altitudes (15%), (iii) in the pressure-temperature profiles adopted (10%), (iv) in the simulation of interfering linesin the •6 0 branch region (20%), and (v) in the
•1 strengths (25%) or the •6 Q branch strength
(15%). The resulting total uncertainties (1 sigma) range from 50% above 37 km to 32% at 20 km
for the 1936 cm
-1 region and from 58% above 37 km
to 33% at 20 km for the 774 cm
-1 Q branch. For
clarity in Figure 3, we have only reproduced the error bars for the full curve.
structure of carbonyl fluoride, J. Mol.
Spectrosc., 50, 182-201, 1974.
Farmer, C. B., and O. F. Raper, High resolution infrared spectroscopy from space: A preliminary report on the results of the Atmospheric Trace Molecule Spectroscopy (ATMOS) Experiment on
Spacelab 3, NASA Conference Proceedings, "Spacelab 3 Mission Review", CP-2429, May, 1986.
Froidevaux, L., Photochemical modeling of the Earth's stratosphere, PhD thesis, California Institute of Technology, Pasadena, CA, 1983. Hopper, M. J., J. W. Russell, and J. Overend, Vi-
brational intensities. XVI. COF2, COC•2, and
COBr2, J. Chem. Phys., 48, 3765-3772, 1968.
Mallinson, P. D., et al., Infrared spectra of carbonyl fluorides and general harmonic force field, Spectrochim. Acta, 31A, 143-159, 1975.
Modica, A. P., and R. R. Brochu, COF
2 band intensi-
tites in the 2.0 to 6.0 micron region, J.
Quant. Spectrosc. Radiat. Transfer, 9, 1105-
1116, 1969.
Model calculations by Froidevaux [1983] (curves Murcray, D. G., and A. Goldman, CRC Handbook of a and b) and by Sze (private communication, 1986)
(curve c), all computed for April, 30øN, show the range of volume mixing ratios predicted by adopt- ing a quantum yield for the photolysis of COF 2 equal to 1 (curve a) or 0.25 (curve b), as well as differences in the predicted profiles for a
COF
2 photolysis yield of 1 (e.g.,
curve a versus
curve c). Nonetheless, considering the uncer- tainties in both observational and theoretical results, it can be concluded that the agreement
High Resolution Infrared Laboratory Spectra of Atmospheric Interest, CRC Press, Boca Raton, Fla., 1981.
Murcray, D. G., et al., High Resolution Infrared
Laboratory Spectra, Department of Physics, University of Denver, Denver, Co., 1984. Ri•sland, C. P., et al., Absolute intensity
m•asurements
of the
(!110-0000)
band
of
1 C1602
at 5.2 pro,
Appl.
Opt.,
22,
3805-3809, 1983.
is reasonably good. Retrievals made for a sunrise
Rinsland, C. P., D.C. Benner, and V. Malathy Devi,
occultation at 47øS have produced results similar to those found at northern latitudes; slightly larger concentrations were found below 30 km, but it is premature to speculate about their signifi- cance, owing to the large uncertainties involved. The present observational data, supplemented by
additional laboratory work on COF
2 and by further
observations from future ATMOS missions, should help in establishing both the quantum yield for
COF
2 photolysis in the stratosphere and lati-
tudinal variations in its profile.
Acknowledgments. The research reported here
Measurements of absolute line intensities in carbon dioxide bands near 5.2 •m, Appl. Opt., 24, 1644-1650, 1985.
Rinsland, et al. Evidence for the existence of
the
802.7-cm
-! band
Q branch
of HO2NO
2 in
high resolution solar absorption spectra of the stratosphere, Geophys. Res. Lett., this issue, 1986.
Rothman, L. S., et al., AFGL atmospheric absorp- tion line parameters compilation: 1982 edition,
Appl. Opt., 22, 2247-2256, 1983a.
Rothman, L. S., et al., AFGL trace gas compila-
tion:
1982 version, Appl. Opt., 22, 1616-1627,
was performed at the Jet Propulsion Laboratory,
1983b.
California Institute
of Technology, under contract
Rowland, F. S., and M. J. Molina, Chlorofluoro-
with the National Aeronautics and Space Adminis- tration. We are grateful to H. Pickett, R. A. Toth, R. Friedl, S. P. Sander, K. B. Thakur, G. A. Harvey, and V. Malathy Devi for making available the results of laboratory studies prior to publication. We also thank L. Froidevaux and N. D. Sze for providing model stratospheric
profiles
of COF
2 for comparison with the ATMOS
experimental results.
methanes in the environment, Rev. Geophy•.
Space Phys., 13, 1-35, 1975.
Sze, N. D., Stratospheric fluorine: A comparison between theory and measurements, Geophys. Res.
Lett.,
•, 781-783, 1978.
Zander, R., et al., Observation of several
chlorine nitrate (C•ONO
2) bands in strato-
spheric infrared spectra, Geophys. Res. Lett., this issue, 1986.References L.R. Brown, C. B. Farmer, R. H. Norton, and
O. F. Raper, Jet Propulsion Laboratory, California
Adams, T. N., D. M. Weston, and R. A. Matula,
Institute
of Technology, 4800 Oak Grove Drive,
Temperature dependence of the spectral intensity
Pasadena, CA 91109.
of the Fermi resonant 1943 cm
-1 band of carbonyl
R. Zander, Institute of Astrophysics, University
fluoride,
J. Chem. Phys., 55, 5674-5680, 1971.
Brown, L. R., and R. A. Toth, Comparison of the
frequencies of NH3, CO2, H20, N20, CO and CH
4,
J. Opt. Soc. Am. B, 2, 842-856, 1985.
Brown, L. R., et al., Computer-assisted measure- ment of line strengths with application to the methane spectrum, Appl. Spectrosc., 37, 287-291, 1983.
of Liege, Li•ge-Ougree, Belgium.
J. H. Park, C. P. Rinsland, and J. M. Russell III, NASA Langley Research Center, Mail Stop 401A, Hampton, VA 23665.
(Received April 25, 1986;