EuroDrying’2017 – 6th European Drying Conference
Liège, Belgium, 19-21 June 2017
1
Boom clay drying behavior: experimental and numerical study
J. Hubert1, A. Léonard2, E. Plougonven², F. Collin1
1 Université de Liège, Dépt. ArGEnCo, Allée de la découverte 9, 4000 Liège, Belgium 2 Université de Liège, Dépt. Chemical Engineering, Agora Quarter, 4000 Liège, Belgium
E-mail of the corresponding author: [email protected]
Abstract
This work presents a thermo-hydro-mechanical framework to model the drying behavior of Boom Clay. First, the experimental campaign conducted by Prime et al [4] is briefly presented. The data acquisition and processing is emphasized because of the application of an unusual technique in the field of geomechanics: X-ray microtomography. Then, numerical simulations are performed to illustrate the capability of the proposed model to reproduce the observed behavior.
Keywords: Mass and heat transfer, convective drying, porous media, desiccation cracking.
Introduction
In geotechnical engineering, the desiccation cracking of soil is commonly observed. This phenomenon is detrimental to the behavior of earth material and earth structure. Desiccation cracks can lead to the overall failure of many geotechnical structures. In the case of deep geological nuclear wastes storage, the ventilation of excavated galleries, to allow for breathable conditions for worker, causes convective drying of the host material and can lead to crack formation. In Belgium, Boom Clay is considered as a host formation for deep geological storage. This paper aims at explaining clearly the drying behavior of Boom clay. To do so, an experimental campaign was conducted by Prime et al [4]. Its protocol and results will be briefly presented. X-Ray micro-tomography has been used for data acquisition. However, this work puts emphasis on the numerical modeling of the problem. Numerical simulations are aimed at reproducing the behavior observed during the experiments. A thermo-hydro-mechanical coupled model is used to determine the stress distribution during the drying. Simulations are performed using the in-house FEM code LAGAMINE.
Materials and Methods
Boom Clay presents a very low water conductivity and a high radionuclides retention capacity making it a good candidate for nuclear waste storage. It also presents a strong anisotropy induced by the clay structure (horizontal bedding with alternance of clay and silt materials). The thermo-hydro-mechanical properties of Boom Clay are well documented and a good compilation can be found in the work of Dizier [1].
Convective drying tests were performed on Boom clay samples. Several cylindrical samples were water-drilled from the cores received from the Mol laboratory. The samples were then placed into a triaxial cell to saturate them under in situ conditions. Those samples are weighed and dipped into a warm paraffin bath to ensure efficient sealing. The tests on saturated samples were made using a micro convective dryer designed in the Laboratory of Chemical Engineering of the University of Liège [3] for drying small samples. The tests are conducted using a convective air flow with controlled temperature and velocity. Twelves small samples were tested.
EuroDrying’2017 – 6th European Drying Conference
Liège, Belgium, 19-21 June 2017
2
Boom Clay is considered an unsaturated porous medium with a solid, a liquid and a gas phase. Within this medium, the liquid water transfers are governed by Darcy's law and vapor diffusion is controlled by Fick's law. Evaporation at the surface of the medium and heat transfer are calculated using the boundary layer model [2]. Given the anisotropy of the material studied, the mechanical model chosen is an orthotropic elastic model.
Results and discussion
From the recurrent weighing of the samples, the drying kinetics can be determined. The shrinkage profile is obtained using the evolution of the cross sections surface measured with X-ray microtomography.
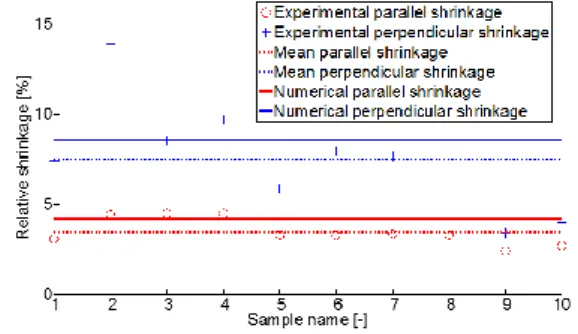
The evolution of the drying rate with the water content (Krischer’s curve) can be observed at Figure 1 as well as the corresponding numerical results. Figure 2 shows the final shrinkage in the directions parallel and normal to the bedding direction for all the samples tested. The dotted lines are the mean values and the solid lines the numerical results.
Figure 1: Kricher’s curve Figure 2: Comparison between numerical and experimental shrinkage
Conclusions
Figure 1 and Figure 2 show good fitting of the experimental results confirming the ability of the suggested model to represent the drying behavior of porous unsaturated materials. As can be seen, the numerical shrinkage is very close to the experimental one in both directions which was made possible using an orthotropic mechanical law.
Acknowledgements
J. Hubert is thankful to the F.R.S.-FNRS. for his doctoral position
References
[1] Dizier A., Caractérisation des effets de température dans la zone endommagée autour de tunnels de stockage de déchets nucléaires dans des roches argileuses, PhD thesis, Université de Liège (Belgique), 2011.
[2] Gerard P, Léonard A, Masekanya JP, Charlier R, Collin F (2010), Study of the soil–atmosphere moisture exchanges through convective drying tests in non-isothermal conditions. International journal for numerical and analytical methods in geomechanics 34(12):1297–1320121212
[3] N. Prime, Z. Housni, L. Fraikin, A. Léonard, R. Charlier, S. Levasseur (2015), On water transfer and
hydraulic connection layer during the convective drying of rigid porous material. Transport in Porous
Media 106 (1), 47-72
[4] Léonard A., Étude du séchage convectif des boues de station d’épuration - Suivi de la texture par microtomographie à rayon X, PhD thesis, Université de Liège (Belgique), 2002