Science Arts & Métiers (SAM)
is an open access repository that collects the work of Arts et Métiers Institute of Technology researchers and makes it freely available over the web where possible.
This is an author-deposited version published in: https://sam.ensam.eu Handle ID: .http://hdl.handle.net/10985/8100
To cite this version :
Thibaud THENINT, Etienne BALMES, Mathieu CORUS - Definition of a linear equivalent model for a non-linear system with impacts - In: ISMA, Belgium, 2012-09 - ISMA - 2012
Any correspondence concerning this service should be sent to the repository Administrator : [email protected]
Definition of a linear equivalent model for a non-linear
system with impacts
Thibaud Th´enint3, Etienne Balmes1,2, Mathieu Corus3
1Arts et Metiers ParisTech, PIMM
75013 Paris, France
2SDTools
44 Rue Vergniaud, 75013 Paris, France e-mail: [email protected]
3LAMSID; UMR EDF/CNRS/CEA 2832
92140, Clamart, France
Abstract
Modal characteristics of non-linear system are typically studied through response to harmonic excitation and using various definitions of non-linear modes. However, few results are available for systems under broadband excitation. The end objective sought here is to generate a linear system, in some sense equivalent to the non-linear system, whose modal characteristics evolve with a level of non-linearity. The considered application is the contact non-linearity found between the tubes of heat exchangers and their support plates. Such tubes, present in nuclear plants, participate to the nuclear safety and can be significantly excited by the fluid flow, so that their dynamic behavior is critical. The turbulent nature of the flow implies broadband excitation and the small gaps between the tubes and the support plate generate very significant non-linear behavior. The proposed equivalent linear system is based on a bilateral contact law whose stiffness and damping characteristics evolve with the amplitude of excitation. A non-linear model is first validated by correlation with experiments. It is then shown that three different indicators (bandwidth of main resonance, operational modal analysis of non-linear power spectral density and correlation of operational deflection shapes) lead to similar values of contact stiffness and damping in the equivalent linear model. This model is thus shown to be a very efficient tool to analyze the impact of the amplitude dependence of the non-linear behavior in the considered system.
1
Introduction
In Pressurized Water Reactors of nuclear power plants, steam generators act as heat exchangers between primary and secondary coolant fluids. They consist of a bundle of U-tubes in which flows the primary coolant fluid. Several support plates guide these tubes vertically. The secondary coolant fluid flows along the U-tubes and passes through the space between tubes and plates. This space, initially of a foliate shape, is filled with sludge deposits. Consequently, fluid flow is accelerated and the tubes are more excited. Moreover, the mechanical bonding between tube and plate is changed. The combination of these two phenomena can lead to dynamic instabilities and tube cracks. Understanding the non-linear behavior of tubes under broadband excitation but constrained in their motion by small gaps in fairly rigid plates is thus an important industrial application.
Non-linear systems with gaps have been studied for a long time [1, 2, 3, 4, 5, 6, 7, 8]. Most work is focused on harmonic excitation and the related notion of non-linear modes [9], which are fundamentally periodic motion and are not associated with a principle of superposition. The importance of defining a level of non-linearity is however a key ingredient of these methods that will be reused here. The few applications on
broadband excitation do not provide a mechanism to analyze systematically the dependence on level. The idea of building linear systems in some sense equivalent to the non-linear response has been considered in works on statistical linearization, Ref. [10] for example, and equivalent stochastic linear system [11]. The novelty of the approach proposed here is to give a physical meaning to equivalent parameters and to link their evolution with load level which is a readily accessible quantity.
Section 2 first discusses the testbed configuration and the validation of its properties with an experimental modal analysis. The retained contact model based on an unilateral stiffness distributed over the obstacle height is then introduced. Details on the numerical integration strategy are finally given.
Section 3 then shows that the proposed model correlates quite well with experiment. Features of the Power Spectral Densities (PSD) are then analyzed and shown to be usable as objectives for parametric model up-dating. The consistence of the updated parameters finally validates the main point of this paper that bilateral contact stiffness and damping, variable with load level, give a very relevant representation of the considered non-linear system under broadband excitation.
2
Model validation
2.1 Configuration of the GV-LOCAL testbed
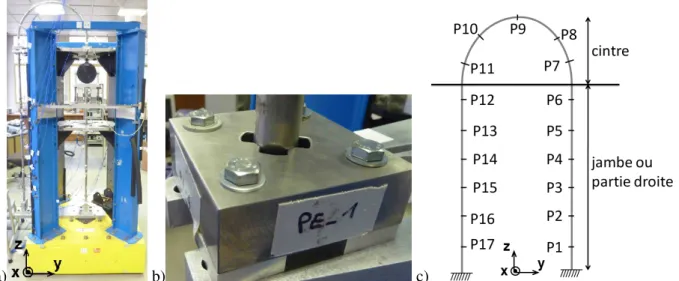
The GV-LOCAL testbed is composed of a portion of steam-generator tube, clamped at its base. The two straight parts of the tube (legs) are inserted in a quadri-foliate obstacle that has the geometry found in true support plates. These obstacles allow a precise control of the gap between the tube and the support plates. In reality, the gap tends to fill due to oxidation and is thus an unknown and typically evolutive quantity. Any influence of the fluid would have in true configurations is ignored here. The gap is given as fraction of the tube diameter with a nominal value of 1.3 %, an intermediate value of 0.9 % and reduced gap of 0.23%. The tube is modeled as an Euler-Bernoulli or Timoshenko beam with minor differences between the two models, that are discussed in [12].
a) b) c)
Figure 1: a) Global view of the GV-LOCAL testbed. b) detail of the support plate module c) sensor configu-ration of the experimental modal analysis
In the testbed excitation is made through a shaker whose position can be modified. This external excitation is random with a frequency content within an adjustable band. Accelerations are measured using a few accelerometers. A finer instrumentation is used around the contact zone (load measurements, accelerometers
and Eddie current sensors on one of the support plate modules) allowing an estimation of contact stiffness discussed in section 2.2.
A modal analysis was performed at low amplitudes to obtain a test/analysis correlation of the free tube (without contact on the support plates). Resulting modes are shown in figure 2. Modal damping was 1.5% for the first two modes and of the order of 0.2% otherwise. Very good correlation was obtained after updating of translation and rotation stiffness at the root of the tube [12].
Figure 2: Experimental modeshapes of the free tube
2.2 Contact model
In this application, contact occurs between the solid support plates and the relatively thin generator tubes. When using a full 3D model, one finds visible levels of tube ovalization that cannot be reproduced with a standard beam model based on the assumption of a non-deformable section. To introduce a level of flexibility in the contact, one thus assumes a density of contact stiffness between the neutral fiber of the beams used to model tubes and the support plates, which are assumed rigid.
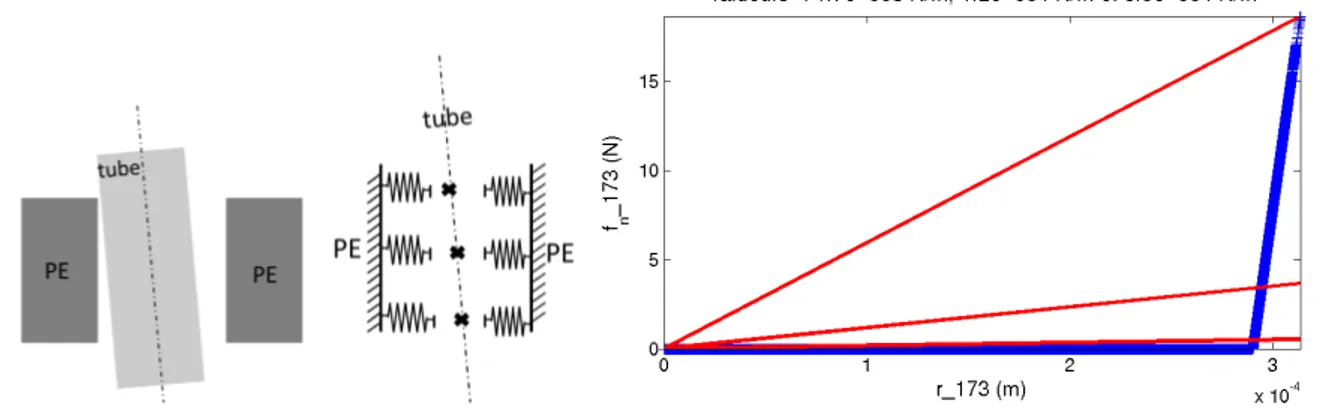
Figure 3: Left : contact model as a discretized density of contact stiffness. Right : tangent and secant stiffness.
The non-linear behavior is represented by an unilateral stiffness where contact load is null in the absence of penetration and proportional to penetration otherwise. When displaying the penetration/contact load curve in figure 3, it clearly appears that one should distinguish tangent stiffness, which corresponds to the slope of load/penetration curve, from secant stiffness, ratio of instantaneous load and penetration. For the obstacles considered here, a tangent stiffness has been experimentally measured at 4e6 N/m [13] (integrated over the
obstacle height). This value is of the same order than the ovalization stiffness of a pipe or than the stiffness used in Ref. [14].
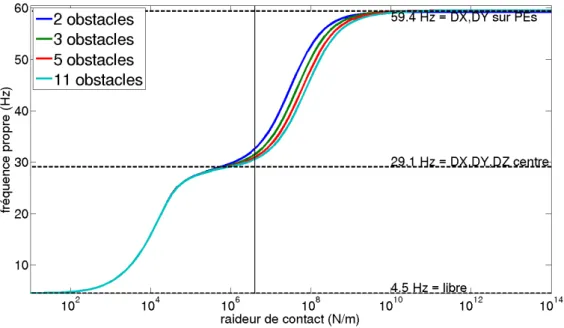
Under broadband excitation, the average secant stiffness is clearly something that will depend on the load level as it impacts the fraction of time spent with high secant stiffness. The key argument of this paper is thus that using a contact stiffness that depends on load level leads to a meaningful equivalent model. For numerical applications, the physical model of a continuous elastic layer must be discretized. The number of discrete non-linear springs needed to properly represent the contact dynamics can be validated. Since the proposed equivalent model has variable contact stiffness, the model must be able to represent frequencies for a wide range stiffness values. The evolution of the first frequency with contact stiffness, shown in figure 4, first shows that various ranges can be found. For very low stiffness, one finds the free tube frequency. At intermediate values, the frequency is close to a pinned condition at the support plate center. For high values, one finds a frequency close to a mode clamped on the support plate. The figure then illustrates, that a discretization with 5 levels is a good compromise leading to good accuracy on frequencies (not just the first one shown here) for the whole stiffness range.
Figure 4: Evolution of the first modal frequency with respect to the global contact stiffness.
Finally, to simplify the model, circular obstacles were considered in numerical applications. This was found sufficient for good test/analysis correlation, but one clearly expects an increase of in-plane/out-of-plane coupling due to contact forces that are not perfectly radial in foliate obstacles.
2.3 Reduced model for transient analysis
The tube non-linear dynamics are computed solving classical discretized equations of the form
[M ]{¨q} + [C]{ ˙q} + [K]{q} = Fext(t) + Fcontact(t) (1)
where M , C and K are the mass, damping and stiffness matrices of the unconstrained tube. The excitation field has been separated between an external shaker excitation and the contact/impact forces located at the five nodes per support plate. To reduce the size of this system, a Ritz basis was used assuming
and projecting equation (1) (using MR= TTM T , ..., see [15] among many others for details). To ensure a
very accurate reduction the basis was built by creating a mass and stiffness orthonormal basis starting from the following sets of vectors
• free modes with no contact (unconstrained tube) in order to describe motion when the gap is large. While this may not be necessary, a wide band up to 7500 Hz was used based on a spectral analysis of contact loads,
• modes constrained at the support plates to describe modes when full contact is achieved,
• static responses to forces applied at each of the contact points to allow an accurate representation of transients associated with impacts.
The ability to predict modes for a model with bilateral contact and a variable contact stiffness was used [12] as objective criterion used to evaluate the basis quality and very good results for this objective are obtained. Both constrained modes and static responses are useful to guarantee proper simulations. Increasing the bandwidth for retained modes is clearly the less important aspect.
Although using a reduced model is not a necessity to achieve reasonable computation times (below the hour here), it has the advantage of easily allowing the introduction of a modal damping model [16]. In this case the mass, damping and stiffness matrices are diagonal which accelerates time integration.
The time integration was performed in SDT [17], using a standard non-linear Newmark average acceleration scheme with no numerical dissipation. A time-step of 2e − 5s was shown to be small enough to avoid energy errors during non-linear time integration.
3
A characterization of non-linearity under broadband excitation
3.1 Model validation through test/analysis correlation
For experiments, a random voltage filtered between 10 and 40Hz is fed to the shaker; the injected force is modulated by the interaction between the tube and the shaker. A more realistic force is thus measured and used as excitation in the numerical simulations. Accelerations are computed or measured at the top of the tube, in the out-of-plane direction. Measurements are performed at a sampling frequency of 2048Hz. Power Spectral Densities (PSD) are obtained through a standard averaging procedure
Sxx(fk) = 2dt2 M M X m=1 |Xm,k|2 (3)
where M windowed signals are extracted using overlap and a window leading to M Discrete Fourier Trans-form (DFT) Xm,k. The results are obviously sensitive to the overlap and windowing parameters but in the
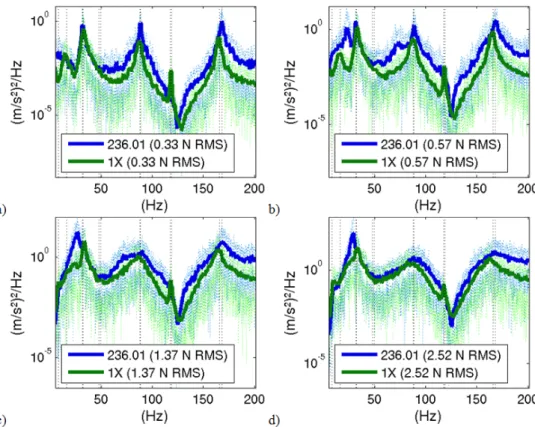
present case, total simulation/measurement time of 49s, buffer length of 10s, overlap of 65% and hanning windows gave fairly stable results and were retained. At each frequency, to take into account the variability of each windowed signal, we store the maximal and minimal value over these M DFT and compute the mean value. The thin dotted lines are then used to indicate minimum and maximum amplitude of the PSD. Figure 5 compares predicted and computed levels for increasing RMS levels of load. This correlation is fairly good over the [10Hz, 200Hz] frequency band. Amplitudes and frequencies match for most peaks and most excitation levels. The spread of the peaks around 90Hz and 170 Hz is well represented. The anti-resonance around 120Hz is both measured and computed. The main differences in levels and frequencies occur for the peaks around 28-30Hz and 70Hz.
Figure 5: PSD of measured (green) and computed (blue) acceleration at top in the out-of-plane direction. The vertical lines indicate modes in free free (black) and clamped (red) boundary conditions
With a posteriori knowledge, one can say that the test should be redone with a finer discretization of load levels, a better validation of reproducibility and a study of the impact of the gap level and obstacle shape. But despite these limitations the correlation seems particularly good for this very non-linear system. This validates the use of simulations based on the model detailed in earlier sections as a guide for the analysis of non-linear characteristics.
3.2 Similarity in behavior for variable stiffness bilateral contact and non-linear be-havior
Since the test was only performed at 4 levels of excitation, it is difficult to see whether peaks undergo a continuous transition. As simulations are much easier to reproduce, more detail can be obtained. Figure 6 shows the influence of increasing the load on the power spectral density of displacement at two nodes. One clearly sees a smooth transition from a low to a high level regime. As for linear modal behavior, frequencies of peaks in the PSD do not depend on the response point although point 210 (at 45ofrom the top) shows a richer response with more visible peaks.
Figure 6: PSD levels from non-linear time simulation as a function of frequency and RMS load level. Levels are normalized with the load level.
Taking a traditional Bode plot view, figure 7 overlays the envelope of non-linear PSDs with two linear responses obtained for a bilateral contact stiffness at k = 1N/m and k = 4e6N/m. The low level peaks clearly coincide with the small contact stiffness while the high level responses (peaks visible near 30, 45 and 60 Hz) are getting close to the high stiffness linear response.
Figure 7: PSD of DOF 210x for amplitudes between 0.01 and 20 N RMS.
To emphasize the similarity, figure 8 compares the influence of load levels on non-linear PSD to stiffness levels on linear models with bilateral contact. The trends on peak frequencies are clearly very similar. The main differences are a higher peak bandwidth for the non-linear response and a disappearance of anti-resonances. In the linear model, the higher peak bandwidth can be modeled as an increased damping.
Figure 8: Comparison of (left) non-linear PSD as a function of load amplitude and (right) linear PSD as a function of contact stiffness
4
Methods for equivalence building
Since it was found that the influence of load amplitude and contact stiffness led to similar behavior of the PSD, the objective of this section is to show that similar values of contact stiffness and damping can be found using updating based on characteristics of the non-linear response. One first discusses peak position and bandwidth, operational deflection shapes and broadband PSD, which can be used as objectives for updating then shows the consistence of the resulting updated values.
4.1 Identification of the main non-linear peak
Since the response shows resonances that are typical of modal responses, the first obvious path to building an equivalent model is to use modal analysis techniques. In the present case, the excitation is not perfectly characterized so that output only methods are preferable.
The oldest and simplest approach is to seek the peak center frequency and bandwidth. The traditional ap-proach is to use the half power bandwidth to estimate a pole with frequency fj = fmax and damping
ζj = 2∆ff peak
peak but other levels (1/4th or 1/25th are shown in [12]) give similar results. From the estimated
pole, updating of contact stiffness and damping is readily obtained since the dependence is very smooth for the first mode, which is isolated here.
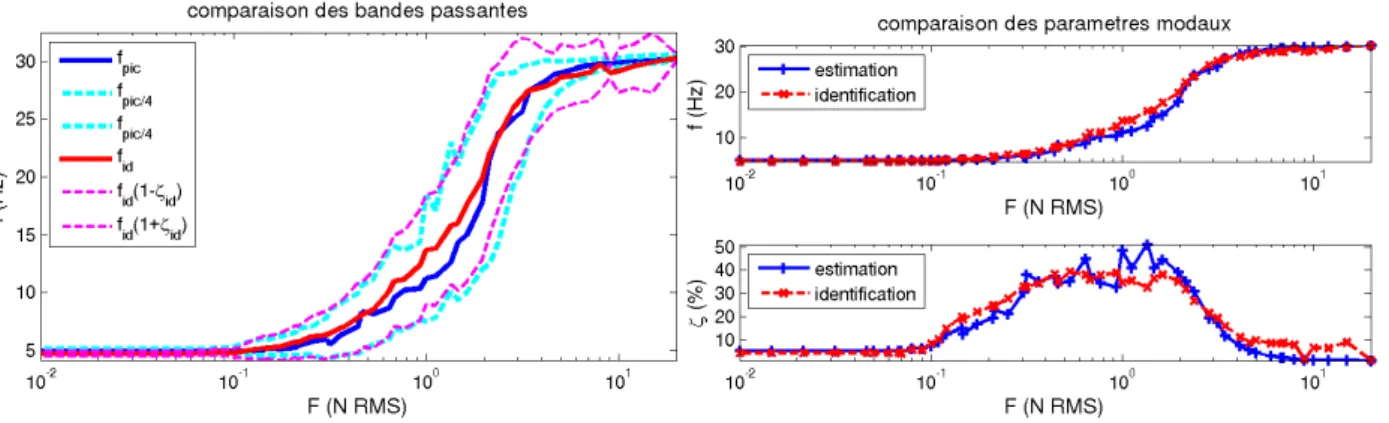
Of course much more robust OMA methods can be used. Methods derived from the work of Verboden [18] were implemented and used here. Figure 9 clearly shows very similar pole estimates for the OMA and simple peak bandwidth estimates.
Figure 9: Left : estimation of peak center frequency and bandwidth. Right : comparison of poles obtained through OMA identification and analysis of peak bandwidth.
The evolution of frequency and damping with the amplitude of excitation is easily analyzed. At low levels the number of impacts is very small and the frequency is that of free system. At high levels, the behavior is similar to bilateral contact. Between 0.1N and 10 N, a transition occurs with increasing frequency and an associated higher level of apparent damping. For linear systems, the spread of the resonance peak can only be due to damping. For the non-linear system being considered, there is no physical dissipation mechanism so this spread is not damping, although it can be consistently identified using a linear damped pole model. Rather than interpreting the spread as damping, one can realize that one can represent the system as linear with variable contact stiffness. The peak spread thus comes from averaging of a time varying resonance. Given a pole estimate associated with the first peak, contact stiffness and damping are readily selected to obtain the same pole for the first pole of the equivalent linear system.
4.2 Shape correlation on the operational deflection shape
Modes are characterized by a pole, which was used in the previous section, and a shape which will be used here. When dealing with linear modal analysis, one of the fundamental principles is that the mode shape is invariant and generates similar spatial responses at all frequencies around the resonance. In other words the responses mostly occur within a subspace of rank one associated with the modeshape.
The singular value decomposition is the most common method to extract subspace information from an arbitrary response. Here one extracts equivalent modeshape information by computing the SVD of the PSD over a frequency band around the main peak in the form
[H(ω)]N ×N w=
min(N,N w)
X
j=1
{Uj}Nσj{Vj}N w (4)
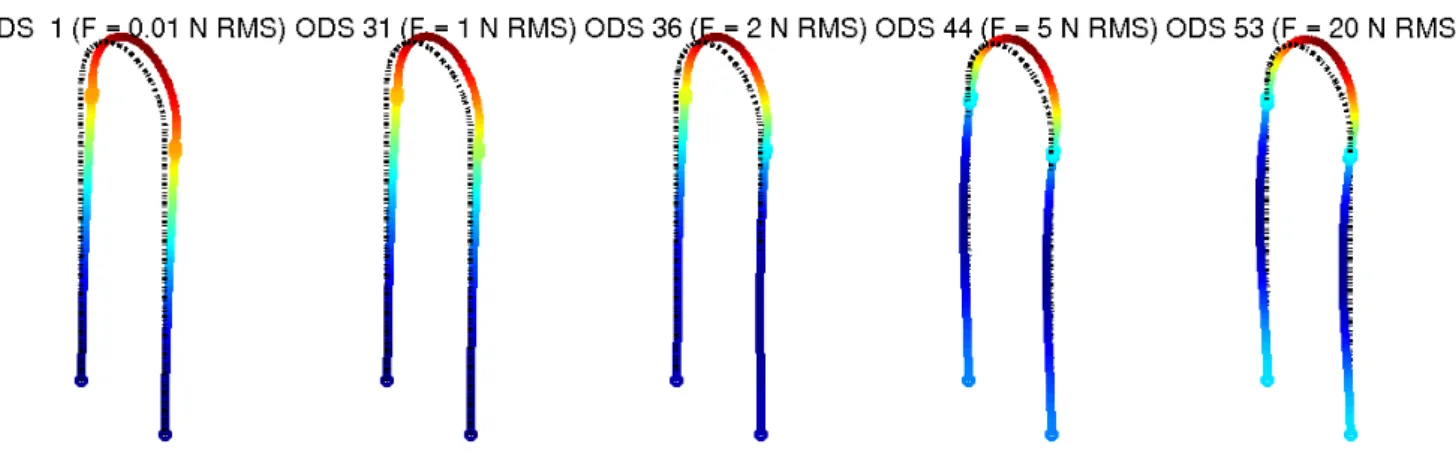
where one analyzes the response at N locations (here the horizontal out of plane motion) and N w frequency points (here the frequencies in the frequency band above 1/25th of the main peak). Figure 10 shows the first singular vector U1for various load levels.
Figure 10: Operational Deflection Shape (ODS) associated with the first singular value at various load levels
At low loads, the ODS clearly corresponds to the first out of plane bending mode. As the load increases a vibration node appears and its position rises with increasing load up to the last shape which can be associated with the second free/free mode but also, with more pertinence, with a bilateral contact mode associated with a stiffness to be determined through model updating using the MAC between mode and ODS as an objective function.
The shapes are mostly real although for intermediate values of load the animation clearly shows some de-phasing between various points. The analysis of singular values, in figure 11, also shows that for load values in the transition region more than one singular value contribute to the response. This emphasizes the fact that the response is really close to being linear in the extreme low and high load levels and much more complex for intermediate values.
Figure 11: Singular values as functions of load level
4.3 Broadband correlation of PSD
The broadband PSD is another response feature of interest. Focusing on a wider frequency band is important if the first peak is not the only one of interest. Figure 12 illustrates how within the possible linear responses an adjustment of contact stiffness and damping can be used to obtain a response that is fairly close to the non-linear PSD.
In this search for the optimum, relating the RMS load level in the non-linear response with an appropriate input spectrum for the linear response is a difficulty. For the proposed updating of contact stiffness and damping, the correlation coefficient between the vectors of PSD at multiple frequencies and a single response point was used. This objective is clearly related with the MAC which compares responses at multiple points and a single frequency. It shares with the MAC the insentivity to vector scaling which was the desired feature.
Figure 12: Target non-linear PSD (black), optimal linear PSD (green) and range of linear PSD (thin lines) for two load levels.
4.4 Equivalent contact parameters obtained through updating
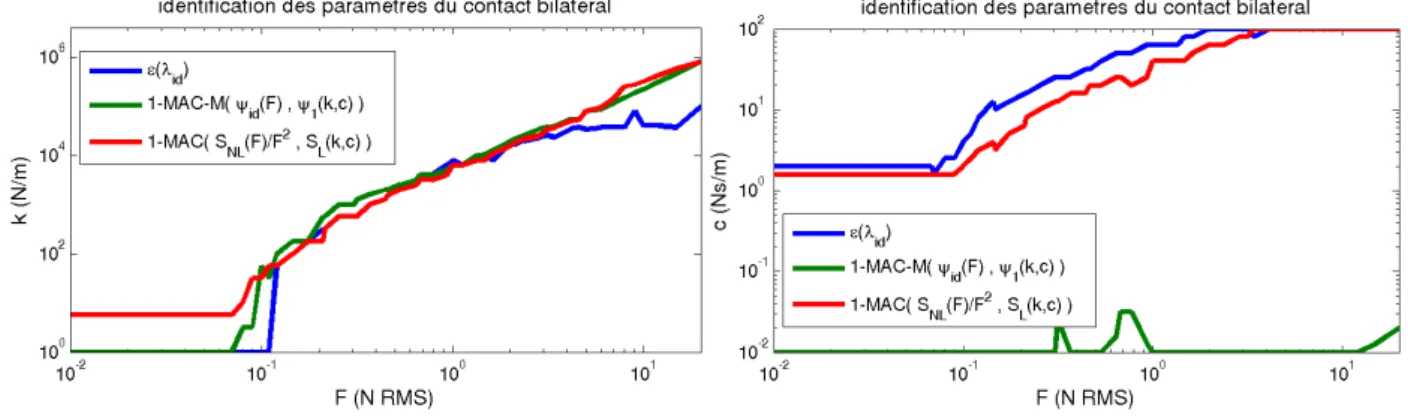
Each of the characteristics of the non-linear discussed in previous sections can be used as a model updating objective resulting in estimated contact stiffness and damping (in reality densities of stiffness and damping which are then distributed over the support plate height). The estimates for each of the objectives are shown in figure 13. As also true in linear modal analysis, it appears that damping cannot be estimated from the ODS shape. But otherwise the three estimates are surprisingly consistent.
Figure 13: Equivalent stiffness and damping parameters as function of load level
5
Conclusion
Modeling of non-linear contact with impacts is now clearly accessible for simulation with sufficient time lengths to allow pertinent estimation of PSD. The model of this study was shown to have a very decent test/analysis correlation thus demonstrating a strong physical validity.
The impact of variable load levels was shown to be very similar to that of a bilateral contact layer with variable stiffness and damping properties. This similarity was further demonstrated by updating equivalent contact parameters using different non-linear features, which resulted in very close estimates of the parame-ters.
These results validate the proposition that the considered non-linear system with impact can be represented by a linear system with contact stiffness and damping that change with the load level. This equivalence is based on power spectral density and operational deflection shape information. Compared to the current
practice of using linear systems with one or two boundary conditions, validating the response for a family of models with variable contact parameters seems a readily accessible and very relevant option.
Equivalence for other criteria like maximum stress is not obvious and should be analyzed in more detail. The gap is another parameter characteristic of the non-linearity. Validating that gap reduction has an effect similar to load level increase and mapping the gap/load/contact parameter relation would be an obvious extension of this work. Accounting for fluid and fluid/elastic instabilities, or applying the proposed equivalence to other non-linearities seem useful perspectives.
References
[1] Holmes, P., “The dynamics of repeated impact with a sinusoidally vibrating table,” Journal of Sound and Vibration, Vol. 84, No. 2, 1982, pp. 173–189.
[2] Shaw, S. and Holmes, P., “Periodically forced linear oscillator with impact: chaos and long-period motions.” Physical Review Letters, Vol. 51, No. 8, 1983, pp. 623–626.
[3] Gontier, C. and Toulemonde, C., “Approach to the periodic and chaotic behaviour of the impact os-cillator by a continuation method.” European Journal of Mechanics, A/Solids, Vol. 16, No. 1, 1997, pp. 141–163.
[4] Knudsen, J. and Massih, A., “Dynamic stability of weakly damped oscillators with elastic impacts and wear.” Journal of Sound and Vibration, Vol. 263, No. 1, 2003, pp. 175–204.
[5] van de Wouw, N., de Kraker, A., and Nijmeijer, H., “Stochastic nonlinear dynamics of a beam system with impact,” ASME Design Engineering Technical Conferences, 2001.
[6] de Kraker et al., “Identification of nonlinear phenomena in a stochastically excited beam system with impact,” International Conference on Noise and Vibration Engineering (ISMA), 1998.
[7] Sampaio, R. and Soize, C., “On measures of nonlinearity effects for uncertain dynamical systems -Application to a vibro-impact system.” Journal of Sound and Vibration, Vol. 303, No. 3, 2007, pp. 659– 674.
[8] Collette, F., “A combined tuned absorber and pendulum impact damper under random excitation.” Journal of Sound and Vibration, Vol. 216, No. 2, 1998, pp. 199–213.
[9] Kerschen, G., Worden, K., Vakakis, A. F., and Golinval, J.-C., “Past, present and future of nonlin-ear system identification in structural dynamics.” Mechanical Systems and Signal Processing, Vol. 20, No. 3, 2006, pp. 505–592.
[10] Roberts, J. and Spanos, P., Random vibration and statistical linearization, John Wiley & Sons, 1990. [11] S., B. and Bouc, R., “Analysis of multi-degree of freedom strongly non-linear mechanical systems with
random input. Part I: Non-linear modes and stochastic averaging.” Probabilistic Engineering Mechan-ics, Vol. 14, No. 3, 1999, pp. 229–244.
[12] Th´enint, T., ´Etude d’un syst`eme non-lin´eaire `a chocs sous excitation large bande. Application `a un tube de g´en´erateur de vapeur., Ph.D. thesis, Ecole Centrale Paris, download, 2011.
[13] Andriambololona, H., “Caract´erisation m´ecanique du banc GV-LOCAL et pr´esentation de la premi`ere campagne de mesure,” Note EDF R&D T61-2008-04521- FR, 2009.
[14] Piteau, P., Delaune, X., Antunes, J., and Borsoi, L., “Vibro-impact experiments and computations of a gap supported tube subjected to single-phase fluid-elastic coupling forces.” Proceedings of the 7th International Symposium on Fluid-Structure Interaction, Flow- Sound Interaction, Flow-Induced Vibration and Noise (IASS-IACM 2000), Montreal, Canada, August 2010.
[15] Balmes, E., Methods for vibration design and validation, Course notes ENSAM/Ecole Centrale Paris, 1997-2012.
[16] Bianchi, J., Balmes, E., Vermot des Roches, G., and Bobillot, A., “Using modal damping for full model transient analysis. Application to pantograph/catenary vibration,” Proceedings of the Interna-tional Conference on Advanced Acoustics and Vibration Engineering (ISMA), 2010.
[17] Structural Dynamics Toolbox 6.4 (for use with MATLAB), SDTools, Paris, France, www.sdtools.com, Sep 2011.
[18] Verboven, P., Frequency-domain system identification for modal analysis, Ph.D. thesis, Vrije Univer-siteit Brussel, 2002.