International Immunology, Vb/ 8, No 7, pp. 1131-1138 © 1996 Oxford University Press
Memory TCR repertoires analyzed long-term
reflect those selected during the primary
response
Paul R. Walker
13, Anne Wilson
1, Philipp Bucher
2and Janet L. Maryanski
141Ludwig Institute for Cancer Research, Lausanne Branch, University of Lausanne and 2Swiss Institute for
Experimental Cancer Research, 1066 Epalinges, Switzerland
3Present address: Division d'Oncologie, Hflpital Cantonal Universitaire, Rue Micheli du Crest, 1211
Geneva 14, Switzerland
4Present address: Laboratory of cellular and molecular biology, ENS-Lyon, 46, allee d'ltalie, 69364 Lyon
Cedex 07, France
Keywords: CD8, cytotoxic T lymphocyte, TCR a chain
Abstract
Normal T cell repertoire selection and evolution in antigen-specific responses Is poorly
understood. We have recently described an MHC class l-restrlcted response characterized by an overwhelming expansion of CD8 cells expressing a Vp10 TCR, thus allowing the Identification of antigen-selected cells directly ex vivo. Our present strategy to follow the overall TCR repertoire selection was to monitor the expression of a particular TCR a chain (VQ8) on antigen-selected Vp10+ cells by four-color flow cytometry. We demonstrate that while there is substantial variation
among the responder mice in VQ8 usage, the repertoires of individual animals remain relatively stable over long periods of time (>1 year), with or without repeated antigenic challenge. Thus if any evolution of this response occurs upon re-exposure to antigen, it would appear not to skew the TCR repertoire established during the primary response.
Introduction
The repertoire of antigen receptors expressed by CD4 or CD8 T cells during an in vivo immune response is selected by antigenic peptides bound to MHC class II or class I molecules respectively. In responses directed towards a single immunodominant epitope, examples of both highly restricted and relatively diverse TCR repertoires have been reported (reviewed in 1). However, it is not apparent whether these features of the repertoire are stable and are expressed at all stages of the response or whether they evolve over time. The long-term persistence of particular clones has sometimes been observed in man (2-5), but it is difficult to extrapolate from these studies to what extent they are representative of the total repertoire in a given response. The assessment of the susceptibility of a given repertoire to in vivo selection is often indirect, since low precursor frequencies necessitate the analysis of T cell clones or hybridomas that may have been subject to bias from in vitro culture.
To investigate how antigen shapes the repertoire, we have studied the CD8 T cell response to an immunodominant
epitope (CW3 170-179) expressed on P815-CW3 transfected cells (6,7). Certain features of this response enable antigen-selected cells to be easily identified ex vivo without further manipulation. After i.p. injection of P815-CW3 cells, there is an expansion of Kd-restricted CD8+ cytotoxic T lymphocytes
(CTL) that express a single Vp element (Vp10). At the peak of the response, a substantial expansion of CW3-specific Vp10+CD8+ cells is readily detectable in peripheral blood
lymphocytes (PBL), these cells express a phenotype charac-teristic of activated cells: CD62L", CD45RB", CD44+ (8). Having a system in which antigen-selected T cells could be identified ex vivo from PBL allowed us to follow the development of the TCR repertoire in individual mice over time. We have developed two independent strategies for longitudinal repertoire analysis. One approach is based on PCR amplification and sequencing of Vp10 TCR from single Vp10+CD62L"CD8 T cells sorted by flow cytometry (9). For
simplicity, we used only Vp10-Jp1.2 primer combinations, since 60% of CW3-specific clones analyzed used the Jp1.2
Correspondence to. P R. Walker
the Vp10-Jp1.2 TCR repertoires selected in individual mice were limited in size and showed relatively little evolution between primary and secondary responses. However, it was still possible that the remainder of the CW3-specific Vp10 TCR repertoire (TCR using Jp segments other than Jp1.2) might show a different pattern of selection or evolution during the response. One possibility would be to perform the PCR amplifications with primers specific for the additional 11 Jp gene segments. While feasible, this would require the processing of a large number of PCR amplifications, making the analysis of large numbers of animals over time cumber-some. Thus, we also developed the present, simpler strategy of TCR repertoire analysis that permits an assessment of potential fluctuations in the overall Vp10 repertoire by analyz-ing expression of a particular Va TCR on the surface of antigen
selected cells. We had found previously that Va usage in this
response was not uniform (6,10). In particular, only -15% of the expanded Vp10+CD8+ cells from pools of immune mice
were labeled with the Va8 mAb B21.14 (7). We have now
determined that Va8 usage by antigen-selected cells is widely
variable between individual immune animals and we have thus exploited this feature as an indicator of potential repertoire evolution over long time periods and after multiple immun-izations.
Methods
Immunizations
Female DBA/2 mice (Harlan CPB, Zeist, Netherlands) were injected i.p. with viable syngeneic ( H ^ ) P815 tumor cells transfected with the HLA-CW3 gene [P815-CW3 (11)] which had been maintained as an ascitic tumor, serially passaged in nude mice. Primary immunizations were at 2-4 months of age and used 2X10⁷ P815-CW3 cells, subsequent
immuniza-tions at the times indicated were with either 2x10⁶ or
2X10⁷ cells.
Cell preparations
PBL were purified from freshly collected heparinized blood using Ficoll-Hypaque centrifugation (Pharmacia Biotech AB, Uppsala, Sweden).
Antibodies and flow cytometric analysis
Directly conjugated mAb were used for the four-color flow-cytometric analysis. Phycoerythrin (PE)-conjugated anti-Va8
[B21.14 (12)] was purchased from PharMingen (San Diego, CA) and anti-CD8a (53.6.7) was purchased as a Red613-conjugate from Gibco/BRL (Life Technologies, Gaithersburg MD). Biotinylated anti-CD62L [MEL-14 (13)] and FITC-conjug-ated anti-Vp10 [B21.5 (12)] were prepared in our laboratory. The biotinylated reagent was revealed with streptavidin-allophycocyanin (Caltag, San Francisco, CA). Samples were analyzed using a FACStar Plus equipped with argon-ion and helium-neon lasers (Becton Dickinson, Mountain View, CA). The cytometer was calibrated by eye using CaliBRITE beads (Becton Dickinson) of 6.6 urn diameter for the first three colors and dark red latex sulfate 4.0 urn diameter beads (Molecular Probes, Eugene, OR) for the fourth color. Analysis was
per-cytes using a combination of forward and side light scatter (linear amplification). The mAb to CD62L gave a bimodal staining pattern of CD8 cells (8), the high and low intensity populations thus defined are hereafter referred to as positive and negative populations. Where values for pooled mice are given in the text, these are calculated as mean percentages ± SD.
Statistical estimation of repertoire size
We estimated the repertoire size from the mean and SD of the %Va8+ cells in gated populations of Vp10+CD62L"CD8+
PBL, as determined by flow cytometry. This approach is based on two assumptions: (i) that all clones of the repertoire are of equal size and (li) that the observed variation in this gated population is exclusively due to oligoclonal sampling effects. A total of 5000-10,000 gated cells was analyzed for each sample, ensuring that variability in Va8 expression was
not due to analysis of too few events. For a repertoire size of Wand a probability of Pfor a given Va of being sampled, the
binomial standard deviation is given by
a =
N
Using this equation, the estimated average repertoire size is obtained by substituting P and a respectively for the mean and SD of the fractions observed and solving for N.
Results
friability of Va8 usage among antigen-selected cells in the
CW3 response
We have previously shown that during the first few months of the CW3 response, elevated proportions (up to -80%) of Vp10+ T cells are found exclusively in the CD62L~CD8 subset,
with no enrichment among CD8 cells of the reciprocal CD62L+
phenotype (8). Moreover, the CD62L"CD8 subset is itself substantially expanded in immune mice and accounts for up to 70% of the CD8 cells, compared with <10% in control mice. Thus, the Vp10+CD62L~ subset represents a CD8 cell
population highly enriched for antigen-selected cells. In the present study we use four-color flow cytometry to analyze Va8 expression on Vp10+ cells in the CD62L subsets of CD8
cells. For the Vp10+ cells included in the CD62L"CD8 subset,
we observed a large variation between individual immune mice in the proportion of Va8+ cells, ranging from < 1 % to
almost 30% (Fig. 1 A). In contrast, little variation was observed in Va8 usage among Vp10+ cells in the reciprocal CD62L+
subset (Fig. 1B) where no expansion of Vp10+ cells was
detected (Fig. 1C). Moreover, a relatively narrow range of Va8
usage was found among Vp10+CD8 cells from non-immune
controls (6.9 ± 1.2%). The variability in Va8 usage appeared
not to be related to the slight variations in the magnitude of individual responses as assessed either by the percentage of Vp10+ cells within the expanded CD62L" subset (Fig. 1C)
or by the proportion of CD8+ cells that were both Vp10+ and
T cell repertoire selection by antigen in vivo 1133 20 ? 1 5 > 1 0 * 5 -0 90-i 80- 70-o 6 0" 5. 50-| >o 4 0 3 0 2 0 1 0 -0
Experiment 1 Experiment 2 Experiment 3
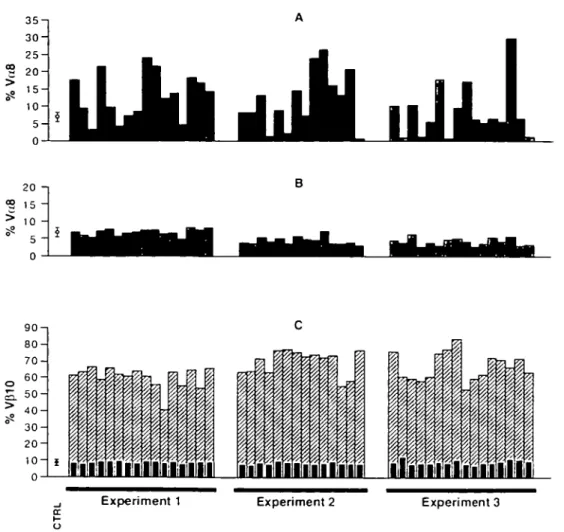
Fig. 1. Antigen-selected cells from individual CW3-immune mice display extremely variable usage of V,j8. PBL from mice immunized 13-14
days previously with P815-CW3 cells were stained with mAb to CD8, CD62L, Vp10 and Va8 and analyzed by four-color flow cytometry Each histogram bar represents data from an individual mouse and three independent experiments are shown. (A) Percentage of VJS+ cells among
Vp10+CD62L-CD8+ cells, (B) percentage of V^"1" cells among Vp10+CD62L+CD8+ cells, (C) percentage Vp10+ cells among CD62L"CD8? cells (hatched bars) and CD62L+CD8 cells (black bars). PBL from 20 non-immune age-matched control mice (CTRL) were also analyzed and the mean percentages (±SD) for V^"1" cells among Vp10+CD8+ cells (A and B) and Vp10+ cells among CD8+ cells (C) are indicated.
Relative stability of the Va8 TCR repertoire during the CW3
response over at least 1 year
It was conceivable that the anti-CW3 repertoire would eventu-ally reach an equilibrium over time that might show less variation among individual animals. Therefore, the same mice were analyzed for Va8 usage among antigen-selected cells
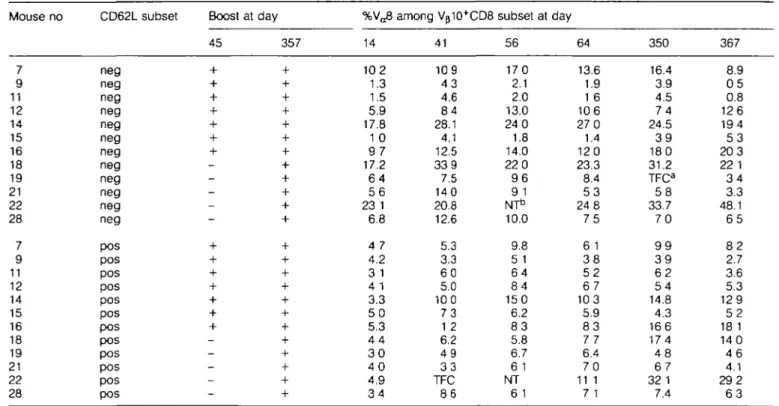
at different times after immunization with P815-CW3 cells. Late in the primary response, at day 41, Va8 usage remained
similar to that found at the peak of the response (Table 1). On day 45, seven of 12 mice were boosted (nos 7, 9, 11, 12, 14, 15 and 16), resulting in an increase in the overall level of the response for these mice (Fig. 2). However, little change in Va8 usage was observed, whether or not the mice had
been boosted (Table 1, days 41-64). Similar results were obtained in two further independent experiments, one of which is analyzed in Fig. 3. As shown in Fig. 3, a significant correlation was found between the proportion of antigen-selected cells expressing VoS at the peak of the primary response and the proportion found either late in the primary
response (P < 0.00005) or after a secondary immunization (P < 0.002). Remarkably, mice that had elevated Va8 levels
early in the response continued to display elevated levels ~1 year after primary immunization, even though the proportion of Vp10+CD62L"CD8 cells at this stage was considerably
lower than at the peak of the response (Table 1 and Fig. 2). Moreover, the levels of Va8 usage 10 days after a boost given
1 year after primary immunization still reflected those found at the peak (day 14) of the primary response (Table 1). Thus, in long-duration time course experiments during which large fluctuations occurred in the magnitude of the CW3 response (Fig. 2), the proportion of Va8+ cells among the
antigen-selected cells remained relatively stable (Table 1).
The phenotypic monitoring of Va8 TCR expression by
antigen-selected cells revealed a subtle feature of the CW3 response. As shown in Fig. 4, some mice select V ^ N / p i O * T cells that can clearly be divided into subpopulations on the basis of the intensity of Va8 staining. More than half of the
CW3 response Mouse no 7 9 11 12 14 15 16 18 19 21 22 28 7 9 11 12 14 15 16 18 19 21 22 28 CD62L subset neg neg neg neg neg neg neg neg neg neg neg neg pos pos pos pos pos pos pos pos pos pos pos pos Boost at day 45 357 + +
+ +
+ ++ +
+ + + ++ +
+
+
+
+
+
+ +
+ +
+ +
+ ++ +
+ +
+ + + ++
+
+
%Va8 14 10 2 1.3 1.5 5.9 17.8 1 0 9 7 17.2 6 4 5 6 23 1 6.8 4 7 4.2 3 1 4 1 3.3 5 0 5.3 4 4 3 0 4 0 4.9 3 4 among Vp10+CD8 41 109 4 3 4.6 8 4 28.1 4.1 12.5 339 7.5 140 20.8 12.6 5.3 3.3 6 0 5.0 100 7 3 1 2 6.2 4 9 3 3 TFC 8 6 subset 56 170 2.1 2.0 13.0 24 0 1.8 14.0 22 0 9 6 9 1 NT* 10.0 9.8 5 1 6 4 8 4 150 6.2 8 3 5.8 6.7 6 1 NT 6 1 at day 64 13.6 1.9 1 6 106 27 0 1.4 120 23.3 8.4 5 3 24 8 7 5 6 1 3 8 5 2 6 7 103 5.9 8 3 7 7 6.4 7 0 11 1 7 1 350 16.4 3.9 4.5 7 4 24.5 3 9 180 31.2 TFCa 5 8 33.7 7 0 9 9 3 9 6 2 5 4 14.8 4.3 166 174 4 8 6 7 32 1 7.4 367 8.9 0 5 0.8 126 194 5 3 203 22 1 3 4 3.3 48.1 6 5 8 2 2.7 3.6 5.3 129 5 2 18 1 140 4 6 4.1 292 6 3 PBL from individual CW3-immune mice from experiment 3 of Fig. 1 (boosted at day 45 and/or day 357 as shown) were isolated at the indicated times after primary immunization, stained with mAb to Va8, Vp10, CD62L and CD8 and analyzed by four-color flow cytometry The percentage of V^"1" cells among Vp10+ cells gated as CD62L" or CD62L+ subsets of CD8 cells is indicated The proportion of Vp10+ cells among CD62L~CD8 cells at each time point is shown in Fig 2 for pooled mice from this experimentT o o few cells in gated subset to accurately analyze. bNot tested
100
400
Days after primary immunization with P815 - CW3 cell*
Fig. 2. Changing proportions of antigen-selected Vp10+ cells over different stages of the response. PBL from CW3-immune mice were stained with mAb to CD8, CD62L, Vp10 and V ^ and analyzed by four-color flow cytometry. The mean percentage (±SD) of Vp10+ cells among CD62L~CD8 cells is shown for groups of mice boosted at days 45 and 357 (triangles) or at day 357 only (squares) The analysis of Vo8 expression from the same samples is shown in Table 1
least two levels of Va8 staining on antigen-selected cells (data
not shown). The two discernible Va8+Vp10+ subpopulations
show similar levels of Vp10 staining but vary in Va8 intensity.
We consider the most likely explanation for the Va8 dim
population is that these cells express a second cell-surface a chain that competes with Va8 for pairing with Vp10, thus
reducing the total Va8 available for antibody labeling (as will
be discussed). In those cases where a sufficient number of cells could be analyzed, the V,^ staining pattern was found to be a stable trait for individual mice, even after boosting (Fig. 4 and data not shown). It is noteworthy that mice displaying a single level of Va8 staining were never found to
acquire a second subpopulation.
Va8 expression in phenotypically distinct subsets of
antigen-selected cells found late in the CW3 response
The phenotype of antigen-selected cells from long-term immune mice appears to be more complex than that found early in the CW3 response (8). This is confirmed in the present study in which we still observe a moderate but significant enrichment of Vp10+ cells among CD62L~CD8 cells at day
350 in most mice (mean values of 17.1 and 10.5% for immune and age-matched control mice, respectively; P < 0.05, Mann-Whitney test). However, by this stage of the response, there is also a marginal Vp10 enrichment in the CD62L+
T cell repertoire selection by antigen in vivo 1135 C/3
o
+
oo
a
0s -251 20 10-20 25 251 ^ 2 0 03§ '
5 10-03 UB
0 5 10 15 20 25peak primary
% Va8
+
cells
Fig. 3. Stability of individual TCR repertoires selected by antigen during the primary response The proportion of Vp10+CD62L~CD8 cells that express a Va8 TCR was determined by four-color flow cytometry for individual mice at the peak of the primary response, and compared with that found either (A) late in the primary response (day 35) or (B) at the peak of the secondary response (day 11 after a boost given 40 days after the primary immunization) The results were analyzed using linear regression The line of best fit is indicated for each plot, with correlation coefficients of r= 0.915 (P < 0.00005) for (A) and r = 0 941 (P < 0.002) for (B)
Primary
(dl3)
Secondary
(d40+ll)
ooMouse:
B
vpio
Fig. 4. Antigen-selected cells from individual mice display distinctive Va8 staining patterns that are conserved at different stages of the CW3 response. PBL are from mice injected with P815-CW3 and bled at the peak of the primary response (day 13), then boosted at day 40 and bled at the peak of the secondary response 11 days later. After staining with mAb to CD8, CD62L, Vp10 and V ^ , PBL were analyzed by four-color flow cytometry The dot plots show cells gated as CD62L" and CD8+, with fluorescence plotted on a log 10 scale. The results from individual mice A, B and C are represented to illustrate typical patterns of Va8 staining
subset (mean values of 16.4% for immune mice and 7.4% for control mice; P < 0.01, Mann-Whitney test). Even with these modest enrichments for Vp10+ cells, we observed that a
number of mice (nos 7, 14, 16, 18, and 22 in Table 1) clearly show elevated levels of Va8 usage among Vp10+ cells in both
of these subsets. It is noteworthy that these are the same animals which consistently displayed enhanced proportions of Va8 usage among antigen-selected cells earlier in the
response. Furthermore, even after a subsequent boost, the Va8 repertoire among Vp10+ cells remained relatively stable
in both subsets defined by the CD62L marker. However, as we had found earlier (8), a further expansion of Vp10+ cells
was observed only in the CD62L" subset after the boost, to 69.6 ± 14.2% in this experiment, with almost no change (17.1 ± 5.5%) among CD62L+ cells.
Discrete patterns of high and low level Va8 expression that
were found early in the CW3 response in the CD62L" subset were also evident in long-term immune animals in both the CD62L" and CD62L+ subsets (data not shown). Where
evident, this pattern of Va8 expression remained characteristic
of an individual animal throughout this long period of analysis, and the same pattern was found in both the CD62L~ and
the CD62L+ subsets where Va8 expansion occurred. These
findings add further weight to our interpretation that the CW3-specific cells present in the CD62L"1" subset in long-term
immune mice are derived from the same pool of precursors as those in the reciprocal (CD62L~) subset and indeed as those found early in the response.
Calculation of repertoire size for individual mice during the CW3 response
The stability of the Va8 TCR repertoire observed over time
argues against technical error as an explanation for the variability of Va8 usage among individuals during the CW3
response. If the CW3 repertoire consisted of relatively few clones, such variability would be expected, and the observed mean Va8 usage and SD for each group of animals could be
used to estimate the average repertoire size, as detailed in Methods. By this method, the repertoire for the primary responses shown in Fig. 1 would contain -15-30 anti-CW3 clones (Table 2). Little change is evident upon boosting. Estimations of repertoire size were also made for a group of mice (nos 7-16 of experiment 3, shown in Table 1) that received booster immunizations of P815-CW3 transfectant
repertoire
Experiment No of mice % Va8+ cells among Estimated Vp10+CD62L"CD8 cells repertoire size mean SD 16 14 16 13.3 11.7 8.6 66 7.8 7.6 26 17 14 PBL from individual CW3-immune mice were taken at the peak of the primary response and stained with mAb to Va8, Vp10, CD62L and CD8 and analyzed by four-color flow cytometry. For each animal, a total of 5000-10,000 events gated as Vp10+CD62L-CD8+ cells were analyzed to determine what proportion were V a ^ The results for individual mice are shown in Fig 1(A). For each experiment (1,2 and 3), the calculated mean and SD of the Va8+ cells were used to
estimate the number of Vp10+ clones present in the gated population of antigen-selected cells (as described in Methods)
cells on days 45 and 357 after the primary immunization. Calculations based on data collected on days 56 and 367 from these animals gave estimated clone numbers of 12 and 13 Vp10+ clones respectively. These estimates compare well
to a repertoire of 16 clones calculated at the peak of the response (days 14) for the same group of mice. However, one must keep in mind that our calculations are based on the assumption that all clones are of equal size, which may be a simplification of the real repertoire. In fact, our data would also be compatible with a slightly smaller number of highly abundant clones and additional minor clones.
Discussion
Our results demonstrate that Va8 usage in the CW3 response
is highly variable among individual mice, yet relatively stable over time. In contrast, we found little variation in the overall Va8 usage among Vp10+CD8 cells in non-immune controls.
Each individual responder animal displayed a characteristic repertoire that was established by an early time point in the primary response and persisted at a relatively stable equilibrium for a significant proportion of the murine lifespan (at least 1 year), even throughout a secondary and tertiary response. While others have documented the long-term per-sistence of CD8 clones (2-5), ours is the first study to demonstrate that the overall TCR repertoire selected by antigen at an early stage can remain stable for a long period of time. It will now be important to extend this approach to study responses to other antigens. In a recent analysis of the l-Ek-restncted response to pigeon cytochrome c (14), it
appeared that some selection for particular amino acids occurred between the primary and secondary responses. However, in that study separate pools of animals were used for the two different time points since the animals had to be killed to obtain the lymph nodes. In the CW3 response antigen-selected cells are readily detected among PBL allowing longitudinal analysis of individual mice. An important con-sideration for vaccine development concerns the possible recruitment of previously activated T cells upon challenge
ability of simple methods for direct ex vivo longitudinal TCR repertoire analysis should open new approaches to investi-gate these issues.
The stability of the CW3-selected repertoire was further substantiated by our observation that the characteristic stain-ing patterns with mAb against Va8 found among the mice
were conserved throughout the response and after repeat immunizations. It is possible that the Vo8dim population
expresses TCR with a lower binding affinity with the mAb, perhaps a sub-family of Va8, in which case this result can be
considered as an independent confirmation of repertoire stability using a different TCR structural marker. The bimodal staining was not the result of insufficient antibody, since increased antibody concentration had no effect on the staining pattern. We consider this phenotype to be compatible with the expression of a second Va chain. Indeed, similar staining
patterns were reported in cells from normal human PBL that simultaneously expressed Va2 and Va24 (16), and recently
the presence of dual a chain-expressing T cells was also demonstrated in the normal murine repertoire (17). However, from these studies it was not known whether T cells expressing two TCR heterodimers at the cell surface could participate in normal in vivo antigen-specific responses. In fact, it was proposed that dual a chain T cells may be at a selective disadvantage from being unable to generate as high an avidity as single a chain T cells, due to their lower density of antigen-specific TCR molecules (17). In contrast, our experiments with normal mice suggest that cells expressing two Va chains are indeed selected by antigen during an
in vivo response.
We suggest that the variability in Va8 usage found in this
study among individual responder mice is most likely due to the oligoclonahty of the CW3 response The stability of indi-vidual repertoires with time argues that the level of Va8
expression is a bona fide characteristic of each responder mouse and that the variations among individuals are not due to technical error or to the inclusion of too few events during the flow cytometric analysis. Importantly, the Va8 repertoire
appears to be skewed only among the expanded CW3-selected T cells, since the proportion of Va8 cells among
CD62L+ cells of the same immune animals early in the
response, or among Vp10+CD8 cells in unprimed, normal
mice showed little variability. If only a limited number of Vp10 clones were expanded during the CW3 response, each mouse would not be expected to express exactly the same number of Va8-expressing clones. Indeed, one can then use the mean
and SD observed for Va8 expression to estimate the average
number of Vp10 clones expanded per responder mouse, with the caveats mentioned in the Results section. By this method, we estimate that the CW3-specific repertoire size for individual mice varies from -15 to 30 clones. This corresponds well to other estimates of repertoire size that we have made sequenc-ing the Vp10-Jp1.2 TCR of single Vp10+CD62L"CD8 T cells
sorted by FACS from CW3-immune mice. In that study we assumed that - 6 0 % of the CW3-specific TCR use the Jp1.2
gene segment, as had been found for CTL clones (10). We then estimated that the size of the CW3-specific repertoire ranged from eight to 35 Vp10+ clones per individual. Thus,
T cell repertoire selection by antigen in vivo 1137
TCR expression on antigen-selected cells directly ex vivo, one based on PCR amplification and sequencing of the P-chain (9) and the other (this present study) based on flow cytometric analysis of Va8 expression, we arrive at very similar
estimates for the size of the Vp10 TCR repertoire in the CW3 response As these are the first studies, to our knowledge, that attempt to calculate repertoire size in individual animals, it will now be interesting to determine repertoire size in other responses.
Compared with the large number of potential af3 TCR available to the immune system (up to 1015, discussed in 18),
the potential size of the CW3-specific repertoire (considering all possible responder mice) appears to be relatively limited, possibly comprising no more than 104 different TCR (7) and
the size for an individual may be even smaller. An interesting question that arises from our findings is whether the oligoclon-ality observed reflects the size of the pre-immune repertoire or only a proportion that might be selected in the response. If the initial exposure to antigen activates only a proportion of all possible CW3-specific precursors, those few clones that are stimulated early in the response may subsequently come to dominate the repertoire due to their rapid cycling time (19,20). Such a 'rare-encounter' model has been proposed in explaining the individual clonal dominance to a B cell determinant (21) and in CD8 responses to tumor cells expressing multiple antigens (22). In monitoring CD62L expression on CW3-selected cells, we have made the intriguing observation that phenotypically distinct subpopula-tions of expanded Vp10+CD8 cells found late in the response
apparently express similar TCR repertoires. Previous in vitro studies of murine concanavalin A blasts (23) and more recently of in vivo activated murine CD8 cells (24,25) have suggested that CD62L may be re-expressed on primed cells late in a response, but direct in vivo evidence for CD62L re-acquisition was not demonstrated. Alternatively, it has also been suggested that some virus-specific CTLp may fail to lose expression of CD62L upon initial stimulation by antigen (25). While indirect, the data described herein provide strong
in vivo evidence that CD62L+ antigen-selected cells from
long-term immune mice are actually derived from precursors expressing the same TCR repertoire as the CD62L~ cells, making CD62L re-expression in vivo the most probable explanation. It should now be possible to test this more directly by sequencing sorted cells. It has recently been proposed that events leading to the possible re-expression of CD62L on activated cells may be greatly influenced by differences in affinity of individual TCR (25). Our results suggest that, at least in the CW3 response, TCR affinity would not play a major role at this level of selection, since similar TCR repertoires appear to be expressed in both CD62L" and CD62L+ subsets.
Our results suggest that, at least in the CW3 response, little further evolution of the TCR repertoire occurs after the peak of the primary response, even in mice boosted up to 1 year later. Taking advantage of the CW3 system where antigen-selected cells can be analyzed ex vivo in normal mice, we recently demonstrated that substantial changes occur in the level of expression of the TCR and co-receptor molecules at different stages of the response (8). It is possible that such changes modify the overall avidity of T cell-target cell
inter-actions and could thus play an important role in the functional evolution of T cell responses once the initial selection of the TCR repertoire has occurred early in the primary response.
Acknowledgements
We thank P. Zaech for FACS analysis, G. Bieler for excellent technical assistance, and H. R. MacDonald, T Renno and J Van Meerwijk for helpful discussions
Abbreviations
CTL cytotoxic T lymphocyte(s) PBL peripheral blood lymphocyte(s)
References
1 Casanova, J L and Maryanski, J. L. 1993. Antigen-selected T-cell receptor diversity and self-nonself homology. Immunol
Today 14391
2 Hingorani, R, Choi, I H , Akolkar, P., Gulwani-Akolkar, B P, Silver, J. and Gregersen, P K. 1993 Clonal predominance of T cell receptors within the CD8+ CD45RO"1" subset in normal human subjects J Immunol 1515762
3 Kalams, S A , Johnson, R. P, Trocha, A. K , Dynan, M. J., Ngo, H. S, D'Aquila, R T, Kurnick, J. T. and Walker, B D 1994. Longitudinal analysis of T cell receptor (TCR) gene usage by human immunodeficiency virus 1 envelope-specific cytotoxic T lymphocyte clones reveals a limited TCR repertoire J Exp Med 179 1261
4 Pantaleo, G., Demarest, J. R, Soudeyns, H , Graziosi, C , Denis, R, Adelsberger, J W., Borrow, P, Saag, M. S., Shaw, G M., Sekaly, R P. and Fauci, A. S. 1994 Major expansion of CD8+ T cells with a predominant Va usage during the primary immune response to HIV Nature 370.463
5 Steinle, A , Remhardt, C , Jantzer, P. and Schendel, D. J. 1995 In vivo expansion of HLA-B35 alloreactive T cells sharing homologous T cell receptors- evidence for maintenance of an oligoclonally dominated allospecificity by persistent stimulation with an autologous MHC/peptide complex J Exp Med 181503
6 Casanova, J -L , Cerottini, J.-C, Matthes, M., Necker, A., Gournier, H , Barra, C , Widmann, C , MacDonald, H. R., Lemonnier, F, Malissen, B and Maryanski, J. L. 1992. H-2-restricted cytolytic T lymphocytes specific for HLA display T cell receptors of limited diversity J Exp. Med 176:439
7 MacDonald, H. R., Casanova, J.-L, Maryanski, J L and Cerottini, J.-C 1993 Oligoclonal expansion of major histo-compatibility complex class l-restricted cytolytic T lymphocytes during a primary immune response in viva direct monitoring by flow cytometry and polymerase chain reaction. J Exp Med
177:1487.
8 Walker, P R , Ohteki, T., Lopez, J. A., MacDonald, H. R and Maryanski, J L. 1995. Distinct phenotypes of antigen-selected CD8 T cells emerge at different stages of an in vivo immune response. J. Immunol. 155:3443
9 Maryanski, J. L., Jongeneel, C V, Bucher, P, Casanova, J.-L. and Walker, P. R. 1996. Antigen-selected T cell repertoires determined for individual mice by single-cell PCR analysis a high magnitude response is composed of very few clones. Immunity 4.47
10 Casanova, J-L., Martinon, F, Gournier, H., Barra, C , Pannetier, C , Regnault, A., Kourilsky, P., Cerottini, J -C. and Maryanski, J. L. 1993. T cell receptor selection by and recognition of two class I major histocompatibility complex-restricted antigenic peptides that differ at a single position. J. Exp. Med. 177:811
11 Maryanski, J. L, Accolla, R. S. and Jordan, B. 1986. H2-restricted recognition of cloned HLA class I gene products expressed in mouse cells. J Immunol. 1364340.
Monoclonal antibodies raised against engineered soluble mouse T cell receptors and specific for Va8-, Vp2- or VpiO-bearing T cells Eur. J. Immunol 21:3035.
13 Gallatin, W. M., Weissman, I L and Butcher, E. C 1983 A cell-surface molecule involved in organ-specific homing of lympho-cytes. Nature 30430.
14 McHeyzer-Williams, M G and Davis, M. M. 1995 Antigen-specific development of primary and memory T cells in vivo. Science 268.106.
15 Selin, L. K , Nahill, S. R. and Welsh, R. M. 1994 Cross-reactivities in memory cytotoxic T lymphocyte recognition of heterologous viruses J Exp. Med. 179.1933.
16 Padovan, E., Casorati, G , Dellabona, P., Meyer, S , Brockhaus, M. and Lanzavecchia, A. 1993. Expression of two T cell receptor alpha chains: dual receptor T cells Science 262422
17 Heath, W. R., Carbone, F R , Bertolino, P., Kelly, J., Cose, S and Miller, J F A P 1995. Expression of two T cell receptor a chains on the surface of normal munne T cells. Eur J Immunol. 25 1617. 18 Davis, M. M and Bjorkman, P. J. 1988 T-cell antigen receptor
genes and T-cell recognition. Nature 334 395.
19 Denizot, R, Wilson, A., Battye, P., Berke, G. and Shortman, K 1986. Clonal expansion of T cells- a cytotoxic T-cell response
Sci USA 836089
20 Tough, D. F and Sprent, J. 1994 Turnover of naive- and memory-phenotype T cells. J Exp Med. 179 1127.
21 Benjamini, E., Andria, M. L, Estin, C. D , Norton, F L and Leung, C. Y. 1988 Studies on the clonahty of the response to an epitope of a protein antigen Randomness of activation of epitope-recognizing clones and the development of clonal dominance. J Immunol. 141:55
22 Brichard, V. G., Warnier, G , van Pel, A L , Morhghem, G., Lucas, S. and Boon, T. 1995. Individual differences in the orientation of the cytolytic T cell response against mouse tumor P815. Eur J. Immunol. 25 664.
23 Jung, T M., Gallatin, W M., Weissman, I L and Dailey, M O 1988 Down-regulation of homing receptors after T cell activation J. Immunol 141.4110.
24 Mobley, J L, Rigby, S M and Dailey, M O. 1994. Regulation of adhesion molecule expression by CD8 T cells in vivo II. Expression of L-selectin (CD62L) by memory cytolytic T cells responding to minor histocompatibility antigens. J. Immunol. 153:5443
25 Tripp, R. A., Hou, S and Doherty, P C 1995. Temporal loss of the activated L-Selectm-low phenotype for virus-specific CD8+ memory T cells. J Immunol. 154 5870