Science Arts & Métiers (SAM)
is an open access repository that collects the work of Arts et Métiers Institute of Technology researchers and makes it freely available over the web where possible.
This is an author-deposited version published in: https://sam.ensam.eu
Handle ID: .http://hdl.handle.net/10985/7619
To cite this version :
Emilie LE GUEN, Rémy FABBRO, Muriel CARIN, Frédéric COSTE, Philippe LE MASSON -Analysis of hybrid Nd:Yag laser-MAG arc welding processes. - Optics & Laser Technology - Vol. 43, p.1155-1166 - 2011
Any correspondence concerning this service should be sent to the repository Administrator : archiveouverte@ensam.eu
1
Analysis of hybrid Nd:Yag laser-MAG arc welding processes.
E LE GUEN
1, R FABBRO
1, M CARIN
2, F COSTE
1and P LE MASSON
2E-mail: leguen.emilie@gmail.com, remy.fabbro@gmail.com
1 PIMM, Arts et Métiers ParisTech, 151, boulevard de l'Hôpital – 75013 Paris,
France
2 LIMATB, Université de Bretagne-Sud /UEB Centre de Recherche C.
Huygens, Rue de Saint Maudé, BP 92116 – 56321 Lorient Cedex, France
Abstract: In the hybrid laser-arc welding process, a laser beam and an electric arc are coupled in order to combine the advantages of both processes: high welding speed, low thermal load and high depth penetration thanks to the laser; less demanding on joint preparation/fit-up, typical of arc welding. So the hybrid laser-MIG/MAG (Metal Inert or Active Gas) arc welding has very interesting properties: the improvement of productivity results in higher welding speeds, thicker welded materials, joint fit-up allowance, better stability of molten pool, and improvement of joint metallurgical quality. The understanding of the main relevant involved physical processes are therefore necessary if one wants for example elaborate adequate simulations of this process. Also, for an efficient use of this process, it is necessary to precisely understand the complex physical phenomena that govern this welding technique. This paper investigates the analysis of the effect of the main operating parameters for the laser alone, MAG alone and hybrid Laser/MAG welding processes. The use of a high speed video camera allows us to precisely characterize the melt pool 3-D geometry such as the measurements of its depression and its length and the phenomena occurring inside the melt pool through keyhole-melt pool-droplet interaction. These experimental results will form a database that is used for the validation of a three-dimensional thermal model of hybrid welding process for a rather wide range of operating parameters where the 3-D geometry of the melt pool is taken into account.
Keywords: Hybrid, Laser, Arc, welding, 3D modelling, melt pool depression, high speed video camera PACS Numbers: 42.62.b, 81.20.Vj Nomenclature C Lagrange multiplier f frequency, Hz g gravity, m.s-2 I current, A
md mean mass of a droplet, kg
Parc arc power, W
Psurf arc pressure, Pa
Pd droplet pressure, Pa
Plaser laser power, W
Rd mean droplet radius, m
rw radius of the filler wire, m
r0 radius of surface heat flux, m
r1 radius of arc pressure, m
Sreinf weld reinforcement surface, m 2 T temperature, K U voltage, V U0 welding speed, m.s -1 Vd droplet speed, m.s -1
Vw filler wire speed, m.s-1
Greek symbols
mass density, kg.m-3
coefficient of surface tension, N.m-1
arc efficiency
droplet frequency, Hz
surf surface heat flux, W.m -2
reinforcement height, m
1. Introduction
Hybrid welding, which combines the techniques of laser welding and arc welding, was originally invented for combined laser-TIG (Tungsten Inert Gas) welding [1]. During hybrid welding, the laser
2
beam creates a vapour capillary, the keyhole, where the beam energy is deposited throughout the work piece depth which enables a deep penetration welding effect. The feeding wire is melted by the electric arc created between the MIG/MAG-wire and the work piece. Both the arc and the keyhole create a plasma, thus producing a highly complex physical situation. As two techniques are combined, the number of process parameters is rather large and therefore difficult to optimize in order to achieve the desired weld. A general review and a complete bibliography of hybrid processes can be obtained in the paper of Bagger and Olsen [2].
Once the mutual interaction between the two energy sources is optimized, the combination of the two processes opens large areas of applications and increases its capabilities : the arc welding process, characterized by relatively lower power density and wider process zone, gives a wide bead, thus enhancing the joint’s root bridging ability and enlarging the manufacturing tolerances for joint preparation. The laser beam process, characterized by higher localized power density, leads to a deeper penetration. Thus in hybrid GMA (Gas Metal Arc)-laser beam welding, a wide and deep bead is achieved with higher welding speeds compared with the GMAW (Gas Metal Arc Welding) process by its own. As a result, the industrialization of that process become now a real objective, which can be facilitated for example, by the development of more efficient hybrid head [3], and/or by a rather complete mastering of the process based on its basic understandings.
Deep penetration allows the welding of rather thick materials even at high welding speeds allowing filling of unavoidable gaps of the joints, with possible improved metallurgical properties and controlled geometry of the weld seam [2, 4]. It is known that the strength of a weld seam is defined by many parameters. Its geometry is one of these crucial parameters that have to be controlled or even optimized if one wants to minimize the effect of induced stress field generated during loading cycles of these welds. Similarly the metallurgical properties of these welds are also depending of the thermal cycles induced by the involved heat sources, the arc and the laser, which are used during this process [5]. So far, most of the hybrid laser-MIG/MAG welding research is focusing on how to effectively combine a laser welding process with an arc welding process together by experimental methods. These studies have the objective to analyse the influence of various operating parameters on the weld joint shapes. It has been shown that the bead width is mainly controlled by the arc power and consequently the mode of transfer whereas laser power influences the penetration [5, 6, 7]. The distance between the arc and the laser as well as the laser beam focal position are also key factors that affect the penetration depth and bead shape [6, 8, 9, 10]. In general a distance between the two sources smaller than 5 mm is recommended.Kah [11] discussed the choice of the arc–torch direction and the distance between laser and arc. This decision should be made case by case and depends on various parameters like laser beam properties available, the material, arc source parameters, the function of filler wire (to improve metallurgy, to fill up air gap or form weld bead). The weld penetration is deeper when smaller inclinations for MIG torch are used. Casalino has observed deeper penetration using a 45° angle rather than 60° in MIG-laser CO2 hybrid welding of Al-Mg alloy. The stability and efficiency of the laser-arc process are influenced by the shielding gas. Tani et al. recommend a 30 up to 40% helium content in hybrid CO2 laser-GMAW welding of AISI 304 stainless steel [12]. A pulsed/spray transfer mode should be preferred in order to achieve a stable and repeatable process [6]. Other authors have also studied the hybrid laser-arc welding of dissimilar metals [13] and the hybrid welding of aluminum [14].
It should be mentioned that most of these works are essentially based on macrograph analysis. However observations of the melt pool hydrodynamics using high speed video camera in the visible range for the melt pool surface analysis [15, 16] or by X-ray radiography [17] for the internal melt pool behaviour give very interesting insights on the physical phenomena and help in understanding the complex interaction between the many parameters involved in this process.
A numerical approach of the hybrid welding was given by Zhou [18] and Wouters [19]. GMA welding process alone has also been previously studied by using a 3-D heat and fluid flow model of melt pool [20]. We will use a similar approach for our hybrid welding description. Cho [21] presents a whole modelling of hybrid welding where he uses the VOF method to track the movement of free surfaces. The Navier-Stokes equation, heat and species conservation are solved for melt pool description. For the behaviour of the capillary, surface tension and recoil pressure are taken into account. The effects of multiple reflections on the walls of the capillary function of time are also taken into account in
3
calculating the melt flow. However this work was only numerical, no comparison with the resulting experimental is presented.
In a first part of this paper, we will present the different experimental results we obtained on the study of hybrid welding, mainly by an extensive use of a high speed video camera that allowed a better understanding of the phenomena induced during laser, MAG and hybrid laser-MAG processes. These new experimental results complete some previous experimental results and give a complete set of data that must be taken into account and reproduced in the corresponding simulations. The numerical approach will be described in the second part of this paper with corresponding results. We use a numerical modelling of hybrid laser-GMA welding in order to reproduce the 3-D geometry of the weld reinforcement observed at the top and the melt pool surface depression observed under the arc. Our final goal here is to define a numerical tool that is rather easy to run and enough precise in order to reproduce these geometrical observations that appear to be decisive for a correct determination of the induced thermal field, once the main operating parameters are defined. These simulations should allow us to determine in a second step the thermal cycles induced inside the material for estimating the resulting metallurgical transformations. So these simulations that are validated with a set of experimental observations will be discussed in the last part of this paper and will allow us to define the corresponding parameters related to arc and laser energy deposition and resulting applied pressures at the melt pool surface.
2. Experimental set-up
Figure 1. Scheme of hybrid laser – MIG/MAG process.
Figure 2. Schematic representation of the high speed camera disposition.
Experiments were carried out with a CW Nd:Yag 4006D TRUMPF Laser, with a maximum power of 4 kW. The laser beam was delivered through a 600 µm optical fibre. The welding head images the exit of the optical fibre by using a collimating and focusing lens that generates a focal spot of 600 µm diameter. The focal spot intensity distribution, which was analysed by using a PROMETEC beam analyser, can be considered as uniform.
The arc torch is a DIGI WAVE 400 model from SAFT PRO (Air Liquide Welding France). It delivers up to 400 A current for different configurations of control of current and tension of the arc. Welding current and arc voltage traces were recorded via a transient recorder. Arcal21 shielding gas flowing at 20 L/min was used (92% Ar and 8% of CO2). Of course, it is possible to vary all the geometric parameters of the torch such as the position and the wire angle with the vertical laser beam (see figure 1).
The dynamics of the melt pool was analysed with a CMOS high speed camera (PHOTRON IMAGER FASTCAM APX RS 3000) with a maximum frame rate of 100 kHz. However, 10 kHz was sufficient for these configurations. Lateral observations of the melt pool geometry were realized by locating this camera on the side, perpendicularly to the welding displacement, with the optical axis of the camera at an angle of 45° with the vertical of the incident laser beam (see figure 2).
The work piece studied here consists in a steel S355 plate of 20 mm thick
(S355 composition 1.1%
Mn, 0.003% Si, 0.014% P, 0.004% S, 0.03% Cu, 0.076% C and 0.005% N)
. Fusion lines were carried with a G4 Si1 filler wire of 1.2 mm diameter(1.5% Mn, 1% Si 0.1% C)
. After welding,4
cross sections of the weld beads were ground, polished and etched according to the standard procedures. All these sections were cut midway from the welded specimen. The bead dimensions corresponding to each welding parameter were measured using a stereo microscope. Partial penetration welds were made using the following operating parameters:
Maximum incident laser power was 4 kW.
Welding speed was progressively increased from 0.5 m/min to few m/min until the visual aspect of weld seam was irregular.
Wire speed (from 2 m/min to 12 m/min) and current and voltage were imposed by the synergy of
welding machine
(figure 3). One must recall that this synergy (U-I relation as a function of wire speed) does not depend of the welding speed. Arc torch inclination of 30° from the vertical laser beam was fixed. Laser beam was positioned behind the MAG torch.
Distance between filler wire (MAG) and laser beam was set to 2 mm.
Figure 3. Voltage and current synergy obtained with the parameters of our study (S355 steel, 1.2 mm diameter wire, shielding gas: 92% Ar - 8% CO2).
3. Experimental observations
3.1 Metal transfer modes
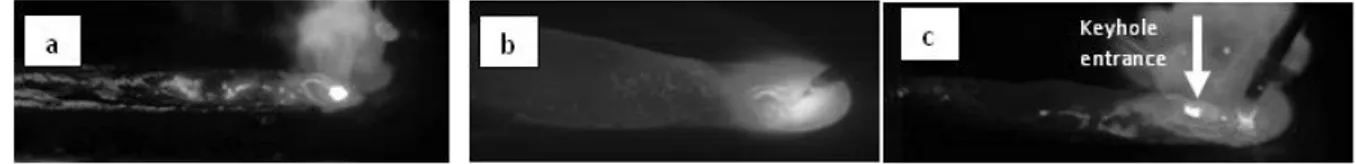
It is well known that the wire transfer mode is determined by the heat input and the used shielding gas. In our case, the short-circuiting transfer occurs between 100 to 200 A, the globular mode between 200 to 250 A and the spray mode from 250 to 400 A. The observations using fast video camera confirm the 3 metal transfer modes according to the used current (figure 4).
Figure 4. Metal transfer in MAG process: a - short-circuiting (Vw = 3 m/min), b - globular (Vw = 6
m/min), c - spray (Vw = 11 m/min).
3.2 Geometry
Examples of typical cross sections of weld seams for laser, MAG and Hybrid conditions are shown in Figure 5. Moreover, Figure 6 shows the corresponding views of the melt pool observed using the high speed video camera. Because of the rather low welding speeds used here (typically less than 5 m/min) the cross section of a weld with the laser alone shows the well-known nail head shape and the surface melt pool shows the characteristic humps observed around the keyhole rim for these welding conditions.
5
These effects result of the induced melt flow that is dragged upwards along the keyhole wall by the friction forces due to vapour expansion out of the keyhole [22]. MAG cross section shows the characteristic height seam reinforcement, with a penetration depth that is much lower than in a laser case.
The weld bead shows a rather complex structure where the depressed zone, resulting from the impingement of the droplets flow and the arc pressure area (bright zone), is followed by the weld reinforcement that is melted along a rather large distance. Finally for the hybrid process, one can observe a greater keyhole penetration compared to the laser alone and the geometry of the reinforcement similar to the one obtained with the MAG process alone.
In that case the keyhole aperture is located inside the melt pool surface just behind the arc centreline in agreement with the arc trailing position.
Figure 5. Weld bead obtained for:
(a) Laser alone : Welding speed 1 m/min, Laser power 4 kW
(b) MAG alone : Welding speed 1 m/min , Wire speed 5m/min, current 200 A, voltage 17.6 V. (c) Hybrid Laser-MAG : Welding speed 1 m/min, Laser power 4 kW, wire speed 5m/min, current
200 A, voltage 17.6 V.
Figure 6. Examples of images extracted from high speed video movies: (a) Laser alone : Welding speed 1 m/min, Laser power 4 kW.
(b) MAG alone : welding speed 1 m/min , wire speed 5 m/min, current 200 A, voltage 17.6 V. (c) Hybrid Laser-MAG : Welding speed 1 m/min, Laser power 4 kW, wire speed 5m/min, current
200 A, voltage 17.6 V.
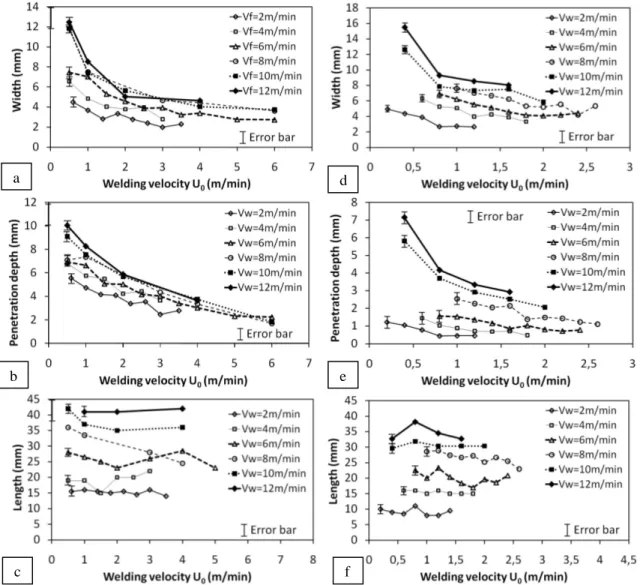
Measurements carried out on macrographs (figure 7) show that the penetration depth is greater in hybrid process than in MAG process. More precisely, the penetration depth ranges from 2 to 10 mm in hybrid and from 1 to 7 mm in MAG. The weld pool length is also longer in hybrid process than in MAG process. It varies from 14 to 43 mm in hybrid process compared to 10 to 38 mm in MAG. Beside, the melt pool width is larger in MAG process than in hybrid process. In MAG, the width ranges from 2.5 to 15.5 mm, whereas in hybrid, it varies from 2.5 to 12.5 mm. As expected, the width and penetration depth decrease when the welding speed increases, and the three characteristic melt pool dimensions (width, length and deep penetration) increase when the wire feeding rate increases. The weld pool length does not seem to vary with the welding speed.
6
Another point concerns the bead surface reinforcement Sreinf defined by the feeding wire, which should depend on the filler wire speed Vw, its wire radius rw and the welding speed U0 with the following relation:
U0Sreinf = Vwr 2
w (1)
In fact, one observe that the average difference between the calculated (equation 1) and the measured value of the reinforcement is about 13% and 19% for MAG alone and hybrid laser-MAG respectively. The experimental bead surface reinforcements are always larger than the calculated one and this difference is larger for the hybrid process than for the MAG one. This difference can be explained by the presence of reinforcement that is always observed even during laser welding alone, although there is no material addition in that case. The origin of this reinforcement is likely the effect of the obvious macroscopic deformation of the welded part resulting from the depth gradient of energy deposition inside the material. This effect is particularly important in case of the hybrid process, because of the difference of level and location of the energy input between the two processes (at the surface for MAG compared to surface and volume for the hybrid process).
Figure 7. Width, penetration and length of the melt pool obtained with hybrid Laser- MAG (a-b-c) and MAG alone (d-e-f) as a function of welding speed, for different wire speeds.
a b c d e f
7
3.3 Melt pool depression
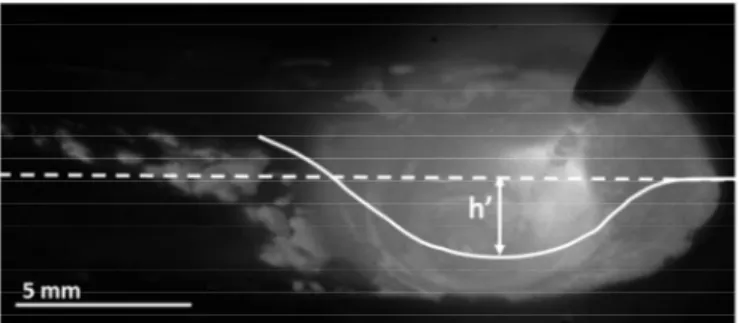
Figure 8 shows an enlarged view of the depressed zone below the arc during MAG processing. One can clearly see that under the arc centreline the melt pool surface is depressed below the initial work piece surface by more than three millimetres. The level of this depression depends on the intensity of the arc current and begins to become significant for currents above 150 A. This depression results from the arc pressure due to the induced hydrodynamic gas flow and of course of the impingement of melt droplets. It is clear that thermal field induced inside the work piece by the arc from this depressed surface has to be very different from the one obtained if the arc is deposited on a flat surface. The characterization of this depression is therefore very important for its comparison with corresponding simulations. The evolution of the depression “h” along the welding direction, in the symmetry plane of the weld seam, can be very easily determined from the video images by taking into account the video perspective and the inclination angle of the camera axis with the solid surface of the sample by using the simple relation h = h’/cos(45°), where h’ is the projected value of the depression measured on the recorded image plane (see an example on figure 8). The uncertainty in the measurement of the depression h’ is ± 0.2 mm. This uncertainty is obtained by making several measurements of depression on the same video. An error of ± 0.2 mm on the measurement of depression leads a numerical error on the maximum arc pressure of only ± 50 Pa. Figure 9 shows the variation of these maximum obtained depressions, as a function of the welding speed U0, for different wire feeding rates. One must also add that the depressions determined by this method are in good agreement with those observed directly on the work piece after welding, at the end of the weld seam. One can easily understand that the depression increases for higher wire feeding rates, due to higher arc current, and for lower welding speeds U0, due to resulting larger melt pool widths. It is important to note that this rather high value of the induced depression is typically half of the final obtained melt pool penetration; therefore the effect of surface depression must be taken into account for a correct simulation of the experimental melt pool geometries. We also note that the hybrid depressions are slightly larger than the depressions obtained with MAG alone
.
Figure 8. Visualization of depression below the arc for MAG process (Incident arc power UI=8kW). The dotted line shows the symmetry line of the weld seam located on the flat surface of the sample and the continuous line shows the profile of the depressed zone. Dimension h’ is the projection of the
8
Figure 9. Maximum surface depression below the solid surface for MAG and Hybrid processes, as a function of welding speed for different wire feeding rates Vw (Hybrid parameters: Plaser : 4 kW, wire
diameter : 1.2 mm, distance wire/beam: 2 mm).
3.4 Droplets pressure measurements
In the spray mode, which is the main metal transfer mode of our experiments, the droplets impinging at rather high velocity the melt pool surface must have also a non-negligible contribution to the melt pool surface depression. If one considers that md is the mean mass of a droplet, Vd its velocity, and Rd its mean radius (about 0.4 mm), the resulting pressure Pd obtained during an impact of droplets emitted with a frequency is given by:
2 d d d d
R
V
m
P
(2)In equation 2, we have considered that there is no spreading of the droplet during its impact onto the surface. These different parameters can be easily measured from video movies.
Figure 10 (a to c) shows respectively the droplet velocity, droplet frequency and the resulting induced pressure (given by equation 2) for hybrid process, as a function of the welding speed and for different wire feeding rates. As there is some acceleration of the droplet due to the drag force of the plasma flow, the droplet velocity reported on figure 10-a is an average velocity along its trajectory. As the wire feeding rate increases, it is expected that the droplet velocity and the frequency of detachment increase (as shown by the experimental tendency). There is no clear effect of the welding speed and the frequency of detachment which varies in the range from about 400 to 1000 Hz (Figure 10-b). These values of frequencies are in good agreement with previous values observed by Valensi [23]. He studied the influence of oxygen in the shielding gas on the droplet frequency. For a wire with high content of silicium, as in our case, this frequency increases from 0 to 750 Hz when the oxygen level decreases from 70 to 0% and is equal to 700 Hz at 8% oxygen as in our study. Measurements of size, velocity and frequency of the droplets are also in agreement with the work of Lin [24]. Indeed, droplet diameters were found around 2-3 mm in globular and 1 mm in spray. The droplet frequency increases from 50 to 500 Hz when the wire speed (or arc intensity) increases from 7 to 12 m/min for a wire diameter of 0.9 mm. The droplet velocity in this work increases by 0.5 to 1.4 m/s when the current increases from 160 to 150 A for a wire diameter of 1.2 mm.
9
Figure 10. For Hybrid laser-MAG process, (a) droplet velocity, frequency (b) and (c) induced pressure (given by equation 1), as a function of the wire feeding rates.
The induced droplet pressure varies from 2 to 8 kPa; as expected, it increases with the wire feeding rate that controls the arc current. These pressures are in agreement with the results of Xu [25] which predicts zero droplet pressure at low intensity (low wire feeding rate) and pressures up to 5 kPa for the high intensity. Even in taking into account some increase of the impact diameter due to local spreading during the impact, it appears that these values are not negligible compared to arc pressure that we will determine in § 4.2. Therefore, the droplet impact must be taken into account as a very local contribution of pressure on the melt pool surface. This impact induces a localized penetration that can be observed, at high wire feeding rates, by a pronounced penetration on some macrographs or deep deformation of melt pool surface observed on videos (see section 4.2.1.).
3.5 Melt pool surface speed
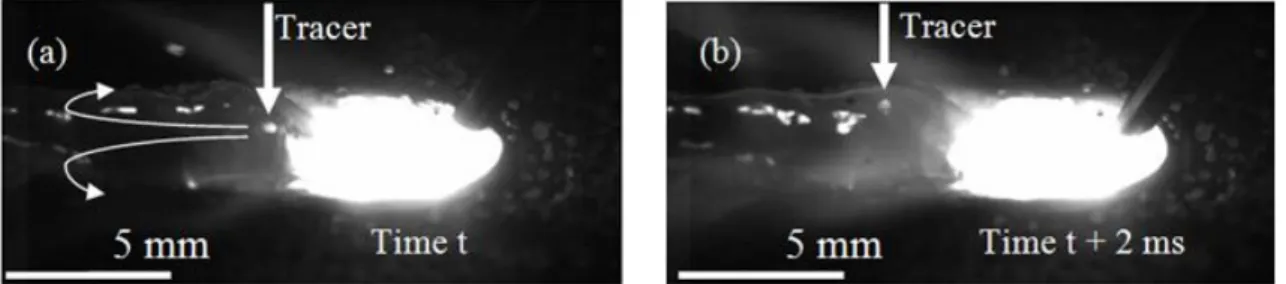
From video movies, one can see that these melt pools have complex hydrodynamic flows. For estimating the importance of convection and conduction processes inside these flows for the energy transport, it would be necessary to determine the fluid flow field. This will dictate the necessity of taking into account, the complete description of the hydrodynamic flow field in the simulations. In order to estimate the magnitude of fluid speed at the melt pool surface, tracer particles were deposited on the sample surface before welding. During melting, these tracers follow the fluid motion. It is then possible to track the motion of particles from the video sequences and deduce fluid velocities by assuming that the particles faithfully follow the fluid dynamics. Different tracers were tested, and it appeared that small silica grains (about 0.1 mm in diameter) had the best behaviour for MAG and hybrid processes and could be easily followed on the video movies.
Figure 11 (a and b) show 2 images extracted from a video sequence where the displacement of the tracer is observable during the corresponding elapsed time between these 2 images.
b
c a
10
Figure 11. (a and b): Two images extracted from a video sequence showing the displacement of a tracer (indicated by an arrow) between a time interval of 2ms (MAG process: Welding speed U0: 2 m/min; Wire speed Vw: 9 m/min).General trend of the melt flow surface is also indicated by curved
arrows on figure 11-a.
Figure 12 shows typical tracers velocities observed at the centre of the melt pool behind the arc, along the transition from the arc depression to the weld reinforcement. It is at this position that the surface speed appears to be maximum; then, behind that zone, the surface flow is redirected towards the edges of the melt pool with a vortex-like structure (see arrows in figure 11-a). This effect is rather similar for hybrid and MAG process. The measurements show that the fluid speed increases with wire feeding rate. This speed is quite constant with the welding speed and is slightly greater in hybrid than in MAG at low currents. The presence of the keyhole modifies the local fluid motion since the fluid has to flow around the keyhole. In addition, the vapour ejected from the keyhole modifies the dynamics fluid motion [15]. The magnitude of maximum surface velocities results to be rather high, in the range 0.5 -1 m/s, and so correspondingly the Peclet number (Pe) that can be estimated as Pe ~ 200-300. This would indicate that the convective transfer of energy is not negligible compared to the conductive process. However, these velocities are measured at the surface of the melt pool, and may largely overestimate the real internal flow speed.
Figure 12. Tracer speed as a function of welding speed for different wire feeding rates for hybrid and MAG processes at a typical welding speed of 1 m/min.
3.6 Analysis of melt pool geometry along the welding direction
The 3-D shape of the melt pool inside the work piece, during the process is also an interesting parameter for modelling comparisons. Analysis of longitudinal sections is more sensitive, in order to determine the contour of the melt pool, which is not normally visible due to the continuity of the melt pool in the solidified zone. For an estimation of the longitudinal shape of the melt zone, we use a small amount of contrast material, which is different from the S355 base material and filler wire, which is inserted perpendicularly to the work piece. This contrast material is introduced before welding, as a wire inside a hole drilled perpendicularly to the work piece, on the symmetry plane of the weld seam (see figure 13). If its diameter is small enough, it does not disturb the melt pool hydrodynamics; this point is verified through the width and length weld bead measurements. When the melt pool reached the contrast material, it is assumed that the contrast material is redistributed very quickly throughout the available volume of liquid before its solidification. Then chemical etching can be adapted to reveal the contour, as can be seen in longitudinal sections (Figure 14).Different contrast materials and wire
11
diameters have been tested and it appears that a copper alloy (Cu-10% Al) wire with a diameter of 1 mm, give the best results.
Figure 13: Scheme using the tracer implant inside the work piece.
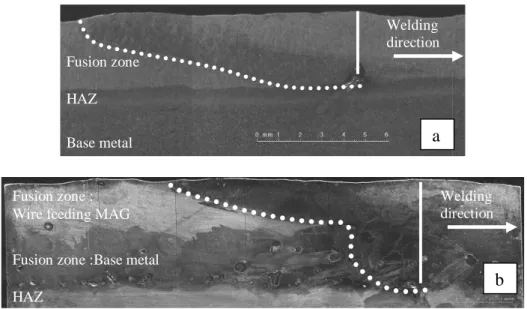
However, this technique has some limitations; it can be used only for configurations with rather low MAG filler wire rates; for high power MAG, and so correspondingly high filler wire inputs, the contrast with the copper alloy wire is not sufficient. Nevertheless, when this technique can be applied, interesting melt pool longitudinal internal profiles can be obtained (see figure 14). They will be discussed and compared with corresponding simulations in paragraph 4.2. As expected, for MAG process, the internal melt pool has a shape of a rather flat bowl (figure 14-a). But in case of hybrid process (figure 14-b), this shape is modified by the localized melt flow occurring around the deeply penetrating keyhole.
Figure 14. Longitudinal macrographs obtained with copper/aluminium alloy contrast material. The dotted line shows the melt pool boundary. Vertical white bar shows the initial position of the contrast wire. a- MAG alone (U0= 0,8 m/min, Vw= 5 m/min). b- Hybrid laser/MAG (Plaser = 4kW, U0= 1 m/min,
Vw= 5 m/min, wire/laser beam distance: 2 mm). 4. Numerical simulation
4.1 3D thermal numerical model
In order to analyze these experimental observations by using simulations, one must take into account the addition of the filler wire and the observed depression resulting of the arc pressure and the momentum of the droplets flow previously described experimentally. It necessitates describing more precisely the interaction zone and it is also intended to estimate the weld reinforcement and root drop out for joints with a gap. Despite the rather high value of the characteristic Peclet number inside the melt pool we have previously determined in §3.4, the melt pool hydrodynamics was not taken into account in these simulations. This is of course a great simplification for these simulations and we will
a
Fusion zone HAZ Base metal Welding direction Fusion zone : Wire feeding MAG Fusion zone :Base metal HAZWelding direction
12
see in §4.2 that the use of a modified thermal conductivity inside the melt pool allows us to correctly reproduce its size.
For the description of the laser keyhole welding alone and also for describing the laser interaction for the hybrid process, we used a previous analysis of Lankalapalli et al. [24] where they consider that the keyhole is a vertical cylinder with a uniform temperature along its wall that is slightly above the evaporation temperature of the material involved. Because of the rather low welding speeds used here for these hybrid welding conditions, we know that the keyhole is almost vertical [15]. However, concerning the hypothesis of the keyhole wall temperature close to the evaporation temperature of the material, we know, since the study of Semak and Matsunawa [27], that this hypothesis is not necessarily verified during laser welding. But nevertheless we have used it, because of its simplified consequences in terms of modelling and its ability to easily reproduce the geometry of the longitudinal and transverse weld seam (Fig. 15). Based on experimental observations, the keyhole diameter corresponds to the focal spot diameter (0.6 mm). The depth of the keyhole can then be defined when the integrated heat flux through the entire keyhole walls surface corresponds to the total absorbed laser power. An analytical description can also be used for that determination [26].
For the arc and hybrid description, the high speed video movies have shown the shape of the interaction zone: a depression of the melt pool under the arc followed by weld reinforcement due to the filler wire. In that case, the weld pool surface is not flat and its final shape must satisfy an equilibrium condition between surface tension, hydrostatic pressure and arc pressure.
Ushio and Wu [20] have already proposed a solution for solving this problem taking into account these constraints, on the basis of an approach that minimizes the total energy of the melt pool, by adding the constraints that the melt pool has a constant volume and the weld reinforcement geometry is equal to the filler wire mass flow. This total energy of the melt pool taken into account concerns the variation of surface energy with a corresponding change of its area, the total potential energy inside the gravitational field, and the work performed during that change of area by the arc pressure and droplets flow momentum. The resulting equation describing the height of the surface profile (x, y) is given by equation (3) where x and y correspond respectively to longitudinal (or welding) and transverse direction, in the laser beam frame:
C P g surf y x yy x xy y x xx y 2 2 3/2 2 2 ) 1 ( ) 1 ( 2 ) 1 ( (3) 2 1 2 2 max 2 ) ( exp ) , ( r y x P y x Psurf (4)
where is the surface tension, the mass density, g the gravity, Psurf(x,y) the applied pressure distribution at the melt pool surface, where Pmax is the maximum pressure with a characteristic radius r1 For the sake of simplicity, we have combined in equation (4) the effect of arc and droplets. The index x and y are the respective derivative of profile (x, y) with x and y variables. C is a Lagrange Multiplier adjusted by the mass conservation constraint of the feeding wire that defines the transverse profile shape (x, y) of the solidified weld seam that must fulfil the following equation:
z
dy
r
wV
wU
0(
0)
2
(5)where rw and Vw are the wire radius and feeding speed, U0 the welding speed and z0 the height of the initial work piece flat surface.
2 0 2 2 2 0 2 ) ( exp 2 ) , ( r y x r I U y x surf
(6)Equation 6 defines the heat flux surf(x, y) deposited by the MAG on the melt pool surface. The arc efficiency of the process and the characteristic radius r0 are adjusted in order to reproduce the experimental results concerning the melt pool geometry (width, depth). A Gaussian distribution was chosen to describe the arc power. This kind of distribution is widely used in the literature [20, 28, 29, 30, 31]. However, Xu [32] recently highlighted that the heat distribution is far from being symmetrical. He directly calculated the physical processes inside the plasma arc and showed that the arc pressure and energy distribution are not Gaussian. Indeed, the distribution is altered by the effect
13
of droplet detachment. In our study, as we do not take into account the description of the arc plasma and the interaction of droplets with the melt pool, a simplified Gaussian distribution for the power deposition flux was chosen. Arc pressure distribution defined by the equation 4 and the maximum pressure are adjusted in order to reproduce the melt pool depression determined experimentally from high speed video movies. More detailed description concerning the heat equation and the algorithm used for solving the complete set of equations by using the Comsol software [33] will be given in a companion paper [34].
4.2 Results and discussion
Using the previous procedure, we have simulated 28 experimental tests: 4 tests concerned laser alone, 12 the MAG alone and 12 the hybrid process. These experiments concerned only fusion lines, however, we found that these configurations are similar to assemblies with a gap of less than 200 microns width. For these experimental tests, the welding speed and the filler wire rate were the main parameters that have been varied. Only four unknown parameters of equations 4 and 6 (Pmax, , r0 and modified thermal conductivity) have been determined by comparison with experimental data given by weld seam cross section and melt pool (geometry and depression) analysis. In the following sections, we will discuss the methodology used for deriving these parameters and the physical mechanisms that can inferred from these analysis.
4.2.1 Arc efficiency and intensity distribution; Heat conductivity modification. Figure 15 shows the
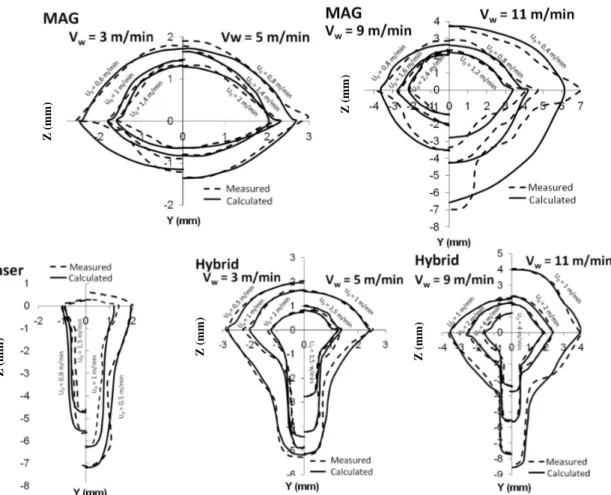
comparisons between experimental and numerical results concerning the weld seam cross section, for the 3 processes. Generally, a rather good agreement is obtained between numerical and experimental cross sections. However, these comparisons show some limits of our approach: Indeed, in the case of MAG welding, at high filler wire speed (11 m/min) and low welding speed (0.4 m/min), the observed complex geometry, similar to that observed in hybrid welding and probably resulting of very localized intense droplets impingement, cannot be correctly reproduced using this purely conductive model. However, the model reproduces a wide operating range corresponding to the configurations currently used in industry.
It is important to note that another parameter, the liquid thermal conductivity, had to be modified in order to correctly reproduce the melt pool length (see figure 16). In fact, this liquid heat conductivity had to be increased by a factor K, depending on the experimental conditions that point out some physical processes occurring inside the melt pool. For example, in order to reproduce the melt pool length in MAG alone process (otherwise it was twice longer), the factor K had to be set to about 3. This isotropic increase of liquid thermal conductivity has the effect of homogenizing the temperature field that is what would be expected by a hydrodynamic flow inside the melt pool, which is not taken into account here. Moreover, this increased liquid thermal conductivity has also the effect of reducing the maximum surface temperature to a level near the evaporation temperature of the material. Otherwise, for these input surface intensities, and welding speeds, the obtained temperatures would have been much higher, which is not physically possible. For similar approach in the case of the laser process alone, an anisotropic conductivity in the welding direction has to be introduced. This conductivity in the welding x-direction had to be multiplied by a typical factor K of 5 to 6 compared to the transverse one in order to reproduce the experimental weld pool length . Without this increase, the simulated weld pool was much shorter compared to experimental one. The high value of this anisotropic K used here, reflects probably the strong flow field obtained in laser welding compared to MAG conditions.
14
Figure 15. Comparison between measured and calculated cross section weld seam for MAG, laser and hybrid processes.
Finally for hybrid welding, the K factor used had to be varied from 3 (this increase being in that case isotropic) for high filler wire rates (corresponding to large melt pools) to an anisotropic K of about 5-6, at low filler wire rates, when the arc power was less important. This K variation is consistent with the expected evolution of the hydrodynamic melt pool flow as a function of the operating parameters. An example of longitudinal melt pool shape for the hybrid welding case is shown in Figure 16. The melt flow localized around the penetrating keyhole below the melt pool generated by the arc is not correctly reproduced because only the thermal field is simulated here, without taking into account the hydrodynamics of melt pool. Table 1 shows a summary of thermal conductivity modifications with the various welding configurations.
It is also important to add that during this procedure of identification of these unknown parameters, we have observed that the determination of the couple of unknown parameters such as the arc efficiency and the radius r0 of power deposition cannot be unique if one only analyzes a weld seam cross section. It is only when the melt pool length is also considered that a unique determination of the couple ( and r0) is possible.
laser Anisotropic, along welding direction : × 6
2 m/min < Vw < 7 m/min 7 m/min < Vw < 12 m/min
MAG No modification Isotropic : × 3
Hybrid laser/MAG Anisotropic, along welding direction : × 6
Isotropic : × 3
Table 1. Summary of liquid thermal conductivity adjustments used for the various configurations
Z (m m ) Z (m m ) Z (m m ) Z (m m ) Z (m m )
15
Figure 16. Comparison of experimental and calculated longitudinal weld pool shape for: MAG alone: welding speed: 1 m/min, wire speed: 9 m/min, current: 200 A, voltage: 17.6 V Hybrid Laser-MAG: Welding speed: 1 m/min, Laser power: 4 kW, wire speed: 5m/min, current: 200
A, voltage: 17.6 V, distance wire/beam 2 mm.
The arc efficiencies determined by using these simulations have been reported in figure 17-a as a function of welding speed for different filler wire speeds. We recall that the efficiency we defined here corresponds to the fraction of arc power UI that is used for reproducing the observed geometry of melt pool and final weld seam cross section. For these simulations, the only loss mechanisms used were the standard losses from convective exchange with ambient air and from grey body emissivity. One can see that this arc efficiency is quite not depending of the welding speed but it increases from 30% in spray regime (high arc power, about 8-10 kW) to 70 % in short-circuit regime (low arc power, about 3-4 kW). The high efficiency for short-circuit regimes can be easily understood. For high arc current regime (spray mode), radiation losses from the arc is a possible reason for such reduced efficiency. This tendency was also observed in TIG welding by Niles & Jackson [35]. Their measurements have indicated that the arc efficiency decreased from 60 to 30% when the intensity increased from 125 to 225 A. We may also add that evaporation losses were not taken into account here. At high arc current it is experimentally observed a high level of evaporation from the melt pool surface due the high resulting surface temperature. Moreover, considerable spattering was observed for these high arc current regimes.
The precise estimation of these evaporation losses is difficult because the level of re-condensation of ejected metallic vapours occurring at atmospheric pressure is not known. If one uses the evaporation rate given by the Langmuir law [36-37], we observe that losses are largely overestimated and cannot be included at this level. DebRoy [37] has pointed out that this law can be used for evaporation rates at low pressure environment when no significant re-condensation occurs. His experiments indicate that evaporation rates in usual welding conditions would be 5 to 10 times lower than those predicted by the Langmuir law. So, for these reasons, we did not take into account these evaporation mechanisms in the simulations, because of these too large uncertainties on these mechanisms. One must also add that even if evaporation losses are efficient for reducing surface temperature to levels near evaporation temperature, they were not able to reproduce experimental melt pool lengths, as the increased liquid heat conductivity did, with similar effect on surface temperature. The radius r0 used in equation 6 for characterizing the profile of deposited arc power has been reported in figure 17-b. As expected, this radius increases with the arc current, and as for arc efficiency, this parameter is not sensitive to the welding speed.
16
Figure 17. Parameters used in the simulation to reproduce the weld pool characteristics determined from macrographs and melt pool length measured using videos: arc efficiency (a), arc power radius (b), arc pressure (c) and laser power (d), obtained with hybrid Laser-MAG for different wire speeds.
4.2.2. Laser efficiency. Figure 17-d shows the laser power that must be used in the simulations in
order to reproduce the experimentally obtained keyhole depths, as the function of the operating parameters. There is a singular point at Vw = 11 m/min and U0 = 1 m/min, which is not consistent with the other results that show a general tendency of an increase of the useful laser power with the welding speed. In fact, for MAG welding alone, at high filler wire speeds and low welding speed, we have already seen on figure 15 a similar deviation, with a rather deep penetration already observed. So for corresponding hybrid welding conditions, a crude analysis considering that this observed deep penetration results only from the laser keyhole is not correct and thus this point has to be discarded. As the incident laser power was set to 4 kW, one can see that maximum necessary useful fraction reaches about 75 % and in spite of some dispertion of the data, it is clear that the laser efficiency decreases when the welding speed decreases. This behaviour has already been analysed for laser welding alone [22]. In fact this result can be explained if one considers that low welding velocities induce deep keyholes, with large depth/diameter ratios, so the keyhole geometry becomes unstable due to Rayleigh-Taylor instability [22]. As a consequence of these internal fluctuating closures, the keyhole is non-stationary and so a stationary thermal model is not appropriate for this description: as the resulting penetration depth is limited by this instability, the corresponding laser power necessary for reproducing this penetration depth is of course reduced. As this behaviour becomes dominant at low welding speeds, the effective laser efficiency can be much lower than the usual 80 to 90% observed laser efficiency resulting from the geometrical trapping of laser beam inside the keyhole. So the laser efficiency is a rather sensitive function of the welding speed, particularly in case of hybrid welding where the keyhole can be easily perturbed by the rather large surrounding melt pool generated by the arc.
4.2.3. Arc pressure determination. The induced pressure applied at the melt pool surface is given by
equation 4 by defining the two parameters Pmax and r1. In fact, unlike to the determination of the arc power parameters, it is not possible to show the uniqueness of the couple (Pmax, r1) using only the maximum depression measurement, because several couples (Pmax, r1) can give the same maximum depression, but with significantly different profiles. So again in order to simplify the analysis by minimizing the number of parameters to determine, we have chosen to use the radius of pressure distribution r1 that is equal to the radius distribution r0. Thus, the maximum pressure has been adjusted to obtain the maximum observed depression.
The arc pressure evolution for hybrid conditions is reported in figure 17-c. The uncertainty on the arc pressure of about 100 Pa, results from the accuracy on depression measurements which is about 0.3 mm. The maximum pressure Pmax (equation 4) clearly increases from the short circuit regime with pressures about 800 Pa to the spray regime with pressures about 2300 Pa. We have also observed that pressures for hybrid conditions are about 30 % higher than for MAG process. These results can be
d c
17
understood if one considers that the arc pressure is directly related to the arc current. Finally, one can notice that these pressures determined by this indirect method, are in agreement with those determined by Lin and Eager [38].
5. Summary of the experimental results and corresponding numerical parameters
The large amount of the experimental data presented in section 3, and the corresponding analysis of determined parameters for reproducing them by using our numerical approach, discussed in section 4, has allowed us to obtain rather precise analytical expressions of these different parameters as a function of the 2 main operating parameters that were used in these experiments, which are the welding speed U0 and the arc power Parc (Parc is defined by giving the filler wire speed Vw used, and the corresponding arc synergy defined on figure 3). These analytical expressions have been obtained by determining a best fit of a polynomial expression of the 3rd degree with the variables U0 and Parc, with the corresponding results. We used the following functions:
Y(U0, Parc) = a1 U0 3 + a2 U0 2 Parc +a3U0 2 +a4U0Parc 2 +a5U0Parc+a6U0+a7Parc 3 +a8Parc 2 +a9Parc+a10 (7) where the constants a1 to a10 are given in tables 2 and 3 for the different data. The mean accuracy of this polynomial fit with the corresponding results, given in the last column in these two tables, is rather correct. These determinations are valid on our range of the operating parameters used: from 0.4 to 4 m/min for the welding speed U0, and from 2 to 11 kW for the arc power Parc. These analytical functions are very useful because for any set of operating parameters U0 and Parc given in the previous validity range, one can obtain with the Table 2 the corresponding experimental geometrical parameters of the resulting melt pool, and with the Table 3, the numerical parameters necessary to use in order to reproduce this melt pool with our simulations.
Parameter : a1 a2 a3 a4 a5 a6 a7 a8 a9 a10 (%)
Melt pool width (mm) -0,16 0,07 1,5 0,0017 -0,51 -4,23 -0,0024 -0,01 1,41 5,37 11
Penetration depth (mm) 0 0 0,14 0 -0,078 -1,45 0 -0,0079 0,52 5,65 7
Weld seam height (mm) -0,2 -0,0091 0,31 -0,0032 0,064 -1,47 0,0044 -0,06 0,36 2,07 12
Melt pool depression (mm) 0 0 0,12 0 -0,10 -0,47 0 0,0039 0,63 -0,72 24
Melt pool length (mm) 0 0 0,19 0 -0,13 -1,11 0 -0,0661 3,70 11,9 8
Table 2: For hybrid welding conditions, polynomial expressions for several experimental geometrical melt pool parameters (U0 is expressed in m/min and Parc in kW).
Parameter: a1 a2 a3 a4 a5 a6 a7 a8 a9 a10 (%)
Arc pressure (Pa) 35,3 -22,4 -169,2 -5,5 172,3 125,3 -11 209,6 -1128 2330,2 2
Arc efficiency (%) -2,78 -0,16 22,289 -0,41 7,27 -79,5 -0,1 2,62 -26,054 156,8 7
Arc radius (mm) -0,019 -0,004 0,1708 -0,0011 0,05 -0,65 -0,0033 0,5 -0,14 1,79 2,5
Laser efficiency (%) -7,778 3,6 21,47 -1,45 3,28 -14,4 0,51 -7,0 34,75 -7,1 10
Table 3: For hybrid conditions, polynomial expressions for the parameters used in the numerical simulations, (U0 is expressed in m/min and Parc in kW).
6. Conclusion
A set of experimental observations has been realized for a wide range of the main operating parameters concerning the hybrid laser-MAG process. The main geometrical characteristics of the melt pools have been determined and we have seen the importance of melt pool depressions as a result of applied pressure at the surface of the melt pool due to arc interaction. By using numerical
18
simulations, we have reproduced the final cross section of the weld seams and the 3-D shapes of these melt pools. For the last point, we have shown the interest of increasing the liquid thermal heat conductivity in order to simulate heat hydrodynamic flow inside the melt pool. This procedure has allowed us to determine the corresponding parameters related to arc and laser energy deposition and also the resulting applied pressures at the melt pool surface, as a function of the used operating parameters. This approach can be applied to an industrial configuration (with a groove, or for full penetration). This paper presents encouraging results concerning the modelling of the hybrid laser-MIG/MAG process obtained by using rather simple approaches and hypothesis that allowed us to reproduce realistic melt pool geometries.
7. Future work
With these simulations, we should be able now to estimate any temperature profile inside the work piece. Future experiments will concern direct measurements of temperature profiles (by using embedded thermocouples or thermal camera) in order to validate the temperature profiles predicted by these simulations and to estimate the corresponding metallurgical transformations. New steps of this program should also consist in describing hydrodynamic flow of the melt pool and thermocapillary effects, for studying their consequences on geometry and energy transport inside the melt pool order to reproduce the melt pool in MAG welding for extreme configurations (high wire speed and low welding speed). This much more complex task should be possible by using the same Comsol software.
Acknowledgments:
This study has been realized in the frame of the project “HYPROSOUD” that was financed by
the French National A. N. R.
References:
[1] Steen W M and Eboo M, 1979 Arc augmented laser welding Metals Constr. II 7 p 332-336 [2] Bagger C, Olsen F O Review of laser hybrid welding Journal of Laser Applications 2005 17 2-14 [3] Petring D and Fuhrmann C, Recent progress and innovative solutions for laser-arc hybrid welding
Proceedings of the 1st Pacific International Conference on Application of Lasers and Optics (2004) pp. 7-10
[4] Ono M, Shinbo Y, Yoshitake A, Ohmura M, Development of Laser-arc Hybrid Welding 2002 NKK Technical Review 86 8-12
[5] Gao M, Zeng X, Yan J and Hu Q 2008 Microstructure characteristics of laser-MIG hybrid welded mild steel Applied Surface Science 254 5715-5721
[6] El Rayes M, Walz C and Sepold G 2004 The Influence of Various Hybrid Welding Parameters on Bead Geometry Welding Research, Supplement to the Welding Journal, May 147-153S
[7] Campana G., Fortunato A., Ascari A., Tani G., Tomesani L. The influence of arc transfer mode in hybrid laser-MIG welding. Journal of Materials Processing Technology 191 (2007) 111-113. [8] Casalino G 2007 Statistical analysis of MIG-laser CO2 hybrid welding of Al-Mg alloy. Journal of
Materials Processing Technology 191 106-110
[9] Song G., Liu L. and Wang P., Overlap welding of magnesium AZ31B sheets using laser-arc hybrid process. Material Science and Engineering A429 (2006) 312-319
[10] Kim C H, Lim H S and Kim J K2008 Position welding using disk laser-GMA hybrid welding, Journal of Achievement in Materials and Manufacturing Engineering 28(1) 83-86
[11] Kah P, Salminen A and Martikainen J 2010 The effect of the relative location of laser beam with arc in different hybrid welding processes MECHANIKA (83)3 1392 – 1207
[12] Tani G, Campana G, Fortunato A and Ascari A 2007 The influence of shielding gas in hybrid laser-MIG welding Applied Surface Science 253 8050-8053
19
[13] Thomy C 2009 Hybrid laser-arc welding of dissimilar metals In Hybrid laser-arc welding. Ed.: Flemming Ove Olsen Woodhead Publishing Ltd Cambridge 270-295
[14] Thomy C and Vollertsen F 2009 Effect of process parameters on joint properties in laser-MIG hybrid welding of aluminium to steel Lasers in Manufacturing (LIM09) eds.: A. Ostendorf, T. Graf, D. Petring, A. Otto, F. Vollertsen. AT-Fachverlag Stuttgart 59-64
[15] Fabbro R, Slimani S, Coste F and Briand F 2007 Analysis of the various melt pool hydrodynamic regimes observed during CW Nd-YAG deep penetration laser welding Proceedings of ICALEO’2007 Conference, Orlando (29 oct-1st nov) USA paper N°802.
[16] Norman P, Karlsson J and Kaplan A F H 2009 Monitoring undercut, blowouts and root sagging during laser beam welding Proceedings of the fifth International Conference Lasers In Manufacturing, Munich Germany page 355.
[17] Katayama S, Kawahito Y and Mizutani M 2007 Collaboration of physical and metallurgical viewpoints for understanding and process development of laser welding. Proceedings of ICALEO’2007 Conference, Orlando 29 oct-1st nov USA paper N°701
[18] Zhou J and Tsai H L, Modeling of transport phenomena in hybrid laser-MIG keyhole welding 2008 Int. J. Heat Mass Transfer 51 4353-4366.
[19] Wouters M 2005 Hybrid Laser-MIG welding: an investigation of geometrical considerations Ph.D. dissertation, Lulea University of Technology Sweden
[20] Ushio M and Wu C S 1997 Mathematical modelling of three-dimensional heat and fluid flow in a moving gas metal arc weld pool Metall. Mater. Trans. B 28B 509-516.
[21] Cho J H and Na S J 2009 Three-Dimensional analysis of molten pool in GMA-laser hybrid welding Welding J. 88 35-43
[22] Fabbro R 2002 Basic processes in deep penetration laser welding Proceedings of the ICALEO’2002 Conference, Scottsdale USA Oct. 14-17
[23] Valensi F, 2007 Contribution à l’étude des phénomènes liés aux effets anodiques et cathodiques en soudage MIG-MAG Ph.D dissertation Orléans University France
[24] Lin Q, Li X and Simpson SW 2001 Metal transfer measurements in gas metal arc welding, Journal of Physics D: Applied Physics 34 347-353.
[25] Xu G and Wu C 2007 Numerical analysis of weld pool geometry in globular- transfer gas metal arc welding Front. Mater Sci 1(1) 24–29
[26] Lankalapalli K N, Tu J F and Gartner G 1996 A model for estimation penetration depth of laser welding processes J. Phys. D: Appl. Phys. 29, 1831-1841
[27]
Semak V and Matsunawa A 1997 The role of recoil pressure in energy balance during laser materials processing J. Phys. D: Appl. Phys. 30 p. 2541-2552[28] Kim C H, Zhang W and DebRoy T 2003 Modeling of temperature field and solidified surface profile during gas–metal arc fillet welding J. Appl. Phys. 94 2667-2679.
[29] Zhang W, Kim C H and DebRoy T 2004 Heat and fluid flow in complex joints during gas metal arc welding—Part I: Numerical model of fillet welding J. Appl. Phys. 95 5210-5219
[30] Cao Z, Yang Z and Chen X L 2004 Three-Dimensional Simulation of Transient GMA Weld Pool with Free Surface Supplement to the Welding journal, June
[31] Kumar A and DebRoy T 2007 Heat Transfer and Fluid Flow during Gas-Metal-Arc Fillet Welding for Various Joint Configurations and Welding Positions Metallurgical and Materials Transactions 38A 506-519
[32] Xu G, Hu J and Tsai H L 2009 Three-dimensional modeling of arc plasma and metal transfer in gas metal arc welding, International Journal of Heat and Mass Transfer 52 1709–1724
20
[33] http://www.comsol.com
[34] Le Guen E, Carin M, Fabbro R, Coste F and Le Masson P, 3D heat transfer model of hybrid laser Nd:Yag-MAG welding of S355 steel and experimental validation, International Journal of Heat and Mass Transfer 54 (2011) 1313–1322
[35] Niles R W and Jackson C E 1975 Weld thermal efficiency of the GTAW Process Welding Journal, January :25-32S
[36] Dushman S1962 Scientific Foundations of Vacuum Technique 2nd edition Wiley, New York. [37] DebRoy T and David S A 1995 Physical processes in fusion welding Review of Modern Physics
67(1) 85-112
[38] Lin M L and Eager T W 1986 Pressures produced by gas tungsten arcs Metallurgical Transactions B 17B September p601-607