2 levels with age, mortality, and frailty vary substantially across populations 3
4 Alan A. Cohena*, Véronique Legaultb, Georg Fuellenc, Tamàs Fülöpd, Linda P. Friede, and
5 Luigi Ferruccif
6
7 aGroupe de recherche PRIMUS, Department of Family Medicine, University of Sherbrooke, 8 3001 12e Ave N, Sherbrooke, QC, J1H 5N4, Canada; [email protected].
9 bGroupe de recherche PRIMUS, Department of Family Medicine, University of Sherbrooke, 10 3001 12e Ave N, Sherbrooke, QC, J1H 5N4, Canada; [email protected]. 11 c Institute for Biostatistics and Informatics in Medicine and Ageing Research, IBIMA 12 Rostock University Medical Center, Ernst-Heydemann, Str. 8, 8057 Rostock, Germany; 13 [email protected].
14 d Research Center on Aging, Department of medecine, University of Sherbrooke, 15 CSSS‐IUGS, 1036 rue Belvédère Sud, Sherbrooke, QC, J1H 4C4, Canada; 16 [email protected].
17 e Mailman School of Public Health, Columbia University, 722 W. 168th Street, R1408, New 18 York, NY, 10032, United States of America;
20 f Translational Gerontology Branch, Longitudinal Studies Section, National Institute on 21 Aging, National Institutes of Health, MedStar Harbor Hospital, 3001 S. Hanover Street, 22 Baltimore, MD, 21225, United States of America: [email protected].
23
25 Abstract
26 Recent studies have shown contradictory associations between calcium levels and health 27 outcomes. We suspected these conflicting results were the consequence of more general 28 issues with how biomarkers are analyzed in epidemiological studies, particularly in the 29 context of aging. To demonstrate the risks of typical analyses, we used three longitudinal 30 aging cohort studies and their demographic subsets to analyze how calcium levels change 31 with age and predict risk of mortality and frailty. We show that calcium levels either 32 increase or decrease with age depending on the population, and positively or negatively 33 predict frailty depending on the population; both age and frailty results showed substantial 34 heterogeneity. Mortality analyses revealed few significant associations but were likely 35 underpowered. Variation in population composition (demographics, diseases, diet, etc.) leads 36 to contradictory findings in the literature for calcium and likely for other biomarkers.
37 Epidemiological studies of biomarkers are particularly sensitive to population composition 38 both because biomarkers generally have non-linear and often non-monotonic relationships 39 with other key variables, notably age and health outcomes, and because there is strong 40 interdependence among biomarkers, which are integrated into complex regulatory networks. 41 Consequently, most biomarkers have multiple physiological roles and are implicated in 42 multiple pathologies. We argue that epidemiological studies of aging using biomarkers must 43 account for these factors, and suggest methods to do this.
44
45 Key Words: Aging biomarkers, population composition, physiological complexity, calcium, 46 frailty
47 48
50 Clinical and epidemiological studies of biomarkers during aging often characterize
51 associations between a single marker and either age or relevant health outcomes (Glei and 52 others 2011; Liu and others 2015; Loeffen and others 2015; Schottker and others 2015; 53 Schram and others 2007). However, we and others have previously observed that many 54 standard clinical biomarkers have surprisingly variable associations with age in different 55 populations (Cohen and others 2015b; Martin-Ruiz and von Zglinicki 2014; Sebastiani and 56 others 2016), and we were worried that many biomarker findings in the literature might be 57 poorly generalizable.
58 Individual biomarkers do not necessarily change linearly with, or independently of, other 59 aspects of physiology, but rather are integrated into physiological regulatory networks that 60 can exhibit properties of formally complex systems (Cohen 2016; Cohen and others 2012). 61 Accordingly, many biomarkers have multiple physiological determinants and roles and can 62 fluctuate for diverse physiological and pathophysiological reasons (see below for details, 63 taking calcium as an example). Biomarkers are thus rarely a direct window into the
64 underlying physiological processes of interest, but are rather proxies, the efficacy of which 65 can depend heavily on other biomarkers, disease state, and demographics.
66 Another consequence of complex physiological integration is that changes with age are 67 generally non-linear and usually non-monotonic as well (i.e., showing periods of both 68 increase and decrease). For example, a long-term study of seven biomarkers in the
69 Framingham Heart Study found that six showed non-monotonic changes across the adult life 70 course (Yashin and others 2010). Thus, since disease prevalence and physiological traits can 71 vary greatly across populations, population composition should have a strong role in
73 happens to be elevated in diabetics, observed changes in the biomarker with age may depend 74 strongly on the prevalence and severity of diabetes in the population, the age structure of 75 diabetes incidence, and impacts of diabetes on other outcomes except aging and mortality, 76 all of which can be quite variable but are unrelated to the fundamental question of how the 77 biomarker may or may not predict aging. Such effects are likely to be present even in 78 longitudinal studies, where biomarkers may evolve differently with age and have different 79 impacts in specific subpopulations.
80 This article attempts to address this challenge by combining aspects of a review and 81 aspects of an empirical study. We first conduct analyses of how calcium associates with age, 82 mortality, and clinical frailty in three different cohort studies of aging and their demographic 83 subsets. We demonstrate that results are highly heterogeneous across populations.
84 Obviously, calcium is but a single example, so our discussion then goes well beyond our 85 particular findings to consider the theoretical basis of why biomarker studies should generate 86 such unstable results, and how to address the problem. We propose a number of concrete 87 methods to help mitigate the problem.
88
89 The example of calcium
90 Within the aging context, calcium has not particularly been proposed as a single biomarker 91 of aging, and is generally analyzed rather as one among many markers in a panel (Martin-92 Ruiz and others 2011; Szewieczek and others 2015). Nevertheless, calcium levels are 93 increasingly believed to be associated with risk of mortality and morbidity. While many 94 studies with middle-aged adults report associations between high calcium levels and 95 increased risk of mortality (Larsson and others 2010; Reid and others 2016), findings in 96 oldest adults tend to show reduced adverse outcomes for higher calcium levels, perhaps
98 2015). Non-linear associations have also been reported (Larsson and others 2010), notably 99 U- or J-shaped curves (Durup and others 2012; Lu and others 2016).
100 Calcium is involved in many crucial physiological functions, notably neuronal 101 transmission, immune cell stimulation, apoptosis, bone health maintenance, muscle
102 contraction – including the heart – and blood coagulation (Shaker and Deftos 2000). In the 103 blood, its ionized form is believed to be the more closely regulated one, and accounts for 104 approximately 50% of total serum calcium, the rest being bound to serum proteins, mainly 105 albumin (Brown 2001). Abnormalities in albumin and globulins may affect total serum 106 calcium levels, but the ionized level should remain unchanged for a given pH (Payne and 107 others 1973). Hypercalcaemia has various causes, notably cancer and hyperparathyroidism, 108 whereas hypocalcaemia is generally due to hypoparathyroidism or chronic renal failure 109 (Parfitt 1979). Many undetected pathological conditions related to age may influence 110 calcium homeostasis and as such remain undiagnosed for long-time.
111 The relationship between calcium and generalized risks of adverse outcomes during 112 aging thus appears to be a complex one. First, both high and low levels might have 113 detrimental effects on physiological homeostasis. Thus, population composition, most 114 notably age, might strongly affect possible associations between calcium and risk of health 115 outcomes. For instance, while high calcium levels at mid-life may be linked to adverse 116 outcomes, the inverse relationship might take place at older ages. To demonstrate this idea, 117 we looked at age-related changes in calcium, and its potential association with frailty and 118 mortality, across three longitudinal cohort studies of aging. Analyses were repeated in 119 different cohort subsets (sex, race, and age) to assess the effect of population composition on
120 potential associations. Our objective was to demonstrate the limits of such single-biomarker 121 epidemiology in the context of the complex process of aging.
122 Detailed Methods are provided in the online Appendix; here we note principally that we 123 have taken care to reproduce the methods most common in the literature. For example, it is 124 common to use measures of calcium adjusted for albumin levels, and we thus used both a 125 raw and albumin-adjusted version. There are two principal exceptions where we opted for 126 methods more sophisticated than are standard. First, many analyses use tertiles or other 127 quantiles, and we disfavour this approach because it causes a loss of statistical power and 128 can cause important biases and inflation of Type-I error without any important justification 129 (Barnwell‐Ménard and others 2015). We thus always consider calcium as a continuous 130 variable. Second, age was sometimes controlled using a cubic spline, a more sophisticated 131 approach than age categories or age as a linear variable.
Characteristic InCHIANTI WHAS I WHAS II BLSA
Characteristic n = 1310 n = 796 n = 430 n = 1290
Age
Mean ± SD 68.3 ± 15.4 78.5 ± 7.9 74.7 ± 2.9 64.9 ± 14.0 Range (min – max) 21.3 – 98.4 65.8 – 100.3 70.2 – 82.5 26.4 – 99.7
Female (%) 727 (55.5) 796 (100.0) 430 (100.0) 636 (49.3)
Race (white, %) 1310 (100.0) 570 (71.6) 348 (80.9) 830 (64.3)
Deaths, number (%) 366 (27.9) 238 (29.9) 173 (40.2) 109 (8.4)
Frailty criteria, number
0 (%) 501 (38.2) 81 (10.2) 262(60.9) ─ 1 (%) 255 (19.5) 170 (21.4) 126 (29.3) ─ 2 (%) 128 (9.8) 217 (27.3) 30 (7.0) ─ 3 (%) 59 (4.5) 121 (15.2) 10 (2.3) ─ 4 (%) 33 (2.5) 65 (8.2) 1 (0.2) ─ 5 (%) 10 (0.8) 31 (3.9) 1 (0.2) ─ Ca (mmol/L), mean ± SD 2.36 ± 0.11 2.32 ± 0.11 2.38 ± 0.10 2.30 ± 0.11 Alb-adj ca (mmol/L), mean ± SD 2.31 ± 0.11 2.32 ± 0.11 2.32 ± 0.11 2.30 ± 0.10 133
134 Findings on calcium
135 Association of calcium with age
136 First, we looked at the association between calcium and age through correlation analyses in 137 three longitudinal cohort studies of community dwelling older adults (Table 1, see online 138 Appendix for details), as might be obtained in many cross-sectional studies. As shown in 139 Table 2, calcium is consistently negatively correlated with age, except for WHAS I (nearly 140 significant) and WHAS II; however albumin-adjusted calcium (alb-adj ca) shows unstable 141 results (see Table A.1 for other versions). Alb-adj ca is clearly positively correlated with age 142 in the InCHIANTI cohort, but not in the other two data sets. Calcium is correlated with 143 albumin in all three cohorts (0.33 r 0.44, all p<0.001). Calcium and alb-adj ca also 144 correlate strongly (0.78 r 0.87, all p < 0.001). Surprisingly, alb-adj ca is not much more 145 correlated with ionized calcium than the unadjusted measure (r = 0.45 compared to r = 0.43) 146 and thus might not serve as a good proxy for ionized calcium (Fig. A.1).
147
148 Table 2. Correlation coefficients between age and calcium level at first visit.
Calcium Alb-adj ca Dataset n r p r p InCHIANTI 1305 -0.073 0.008 0.129 <0.001 WHAS 1189 -0.115 <0.001 -0.029 0.32 WHAS I 766 -0.063 0.08 -0.017 0.64 WHAS II 423 -0.029 0.55 -0.030 0.54 BLSA 1242 -0.126 <0.001 0.036 0.21 All 3736 -0.092 <0.001 0.024 0.14
149 Unadjusted calcium and albumin-adjusted calcium (alb-adj ca) variables were centered at
150 zero and divided by their standard deviation such that mean was 0 and standard deviation 1. 151 Significant correlation coefficients are indicated in bold.
153
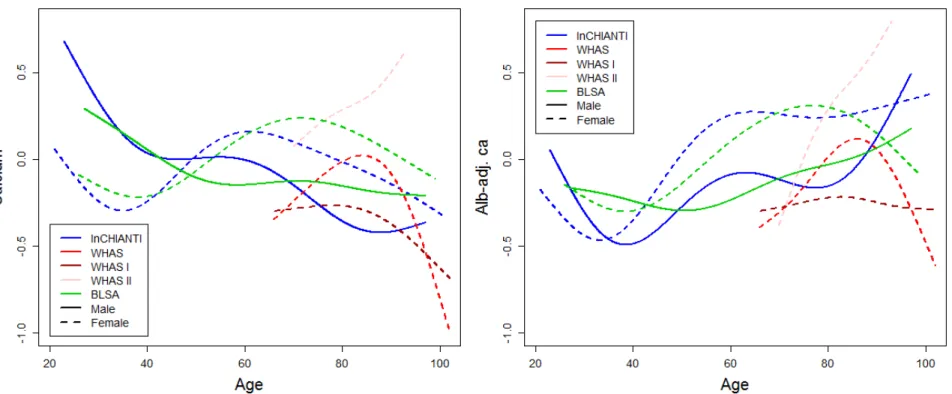
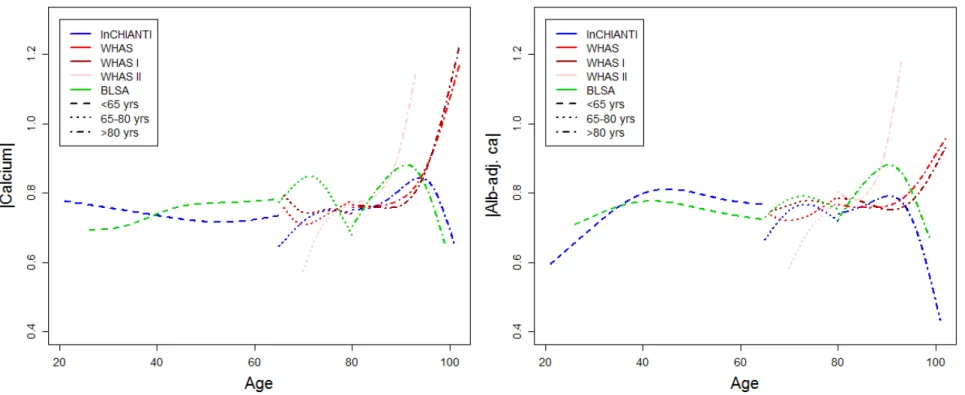
154 Figure 1. Calcium trajectory with age. Changes with age are shown for unadjusted calcium (left panel) and albumin-adj ca (right 155 panel) variables. Trajectories were estimated using Bayesian mixed models with age as a cubic spline (with 5 knots for InCHIANTI and 156 BLSA, and 4 knots for WHAS, see Appendix for details) for three longitudinal cohorts, as indicated with different colors. Analyses for 157 WHAS were performed either combining WHAS I and WHAS II (solid lines), or with either one (dashed lines for WHAS I and dotted 158 lines for WHAS II). Age started at 66 for WHAS, while InCHIANTI and BLSA had a small fraction of younger subjects.
159
160 Figure 2. Yearly changes in calcium with age. Trajectories for unadjusted calcium (left panel) and albumin-adj ca (right panel) 161 variables were estimated using Bayesian linear mixed models (see Appendix for details). Slopes (points) obtained are plotted with their 162 95% confidence intervals (CIs; segments). Different colors indicate different datasets and text on the right describe the cohort subset on 163 which the analysis was performed. Analyses for WHAS were performed either combining WHAS I and WHAS II (solid lines), or with 164 either one (dashed lines for WHAS I and dotted lines for WHAS II). Result for heterogeneity test are also indicated. Significant results 165 are plotted in bold, with asterisks indicating the significance level (***, p < 0.001; **, p < 0.01; *, p < 0.05).
167 Longitudinal changes in calcium levels with age varied markedly across populations 168 and sub-populations. Across full datasets, alb-adj ca always increases up to 80 years or so, 169 but diverges across datasets after this age (Fig. 1). In contrast, unadjusted calcium shows 170 much more variation across populations. These findings are sometimes but not always in 171 agreement with the correlations based on a cross-sectional approach (Table 2). Using finer-172 scale sub-populations (Fig. 2), both unadjusted calcium and alb-adj ca can increase or 173 decrease significantly with age depending on the population, and heterogeneity across 174 analyses is substantial and highly significant (Table A.2). Calcium slopes (i.e. mean yearly 175 changes in SDs) varied greatly across these analyses, ranging from -0.02 to +0.08 SDs/year 176 (Fig. 2). Calcium trajectories also varied substantially according to sex and age group within 177 each cohort (Figs A.2-A.5). Analysis of calcium trajectories with age in a merged dataset 178 revealed significant interactions between dataset and slope (Table A.3). Sex also influenced 179 calcium changes with age for unadjusted calcium, but not the alb-adj ca, with women 180 showing steeper increases in calcium with age than men when considering all three datasets 181 ( = 0.008, p < 0.001).
182
183 Association with mortality and frailty
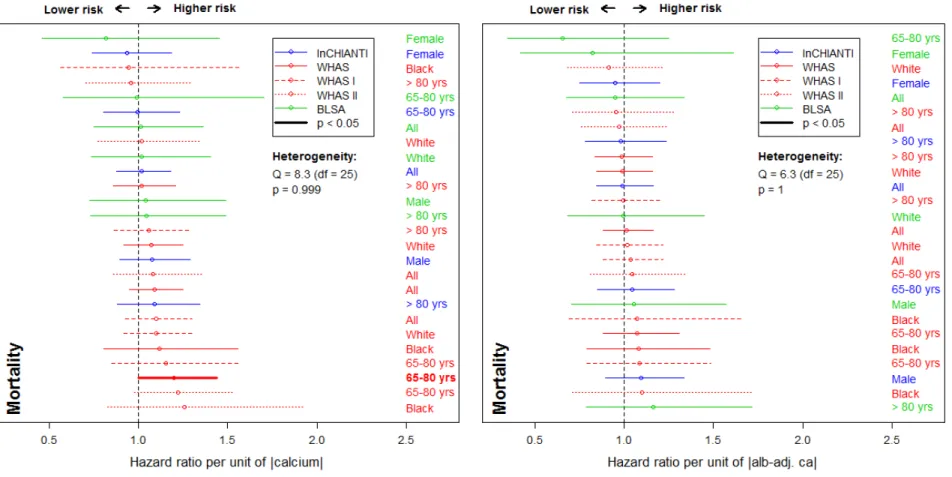
184 Our mortality analyses appear to be underpowered, failing to reach normal significance 185 thresholds even when effect sizes were large (ranging from 0.88 to 1.27, see Fig. 3). For the 186 oldest subjects (> 80 yrs), we note a lower mortality risk due to unadjusted calcium in the 187 InCHIANTI dataset, standing in contrast to previous findings in older populations (Martin-188 Ruiz and others 2011; Szewieczek and others 2015). Nonetheless, meta-regression of effect 189 sizes shows that the associations between mortality and calcium do differ across datasets,
190 even when these associations are not themselves significant: using BLSA led to stronger 191 effects compared to WHAS I ( = 0.14, p = 0.04) and to InCHIANTI ( = 0.13, p = 0.04), an 192 effect that failed to reach significance for WHAS II ( = 0.10, p = 0.13). Using alb-adj ca 193 compared to unadjusted calcium led to higher effect sizes ( =0.13, p = 0.02).
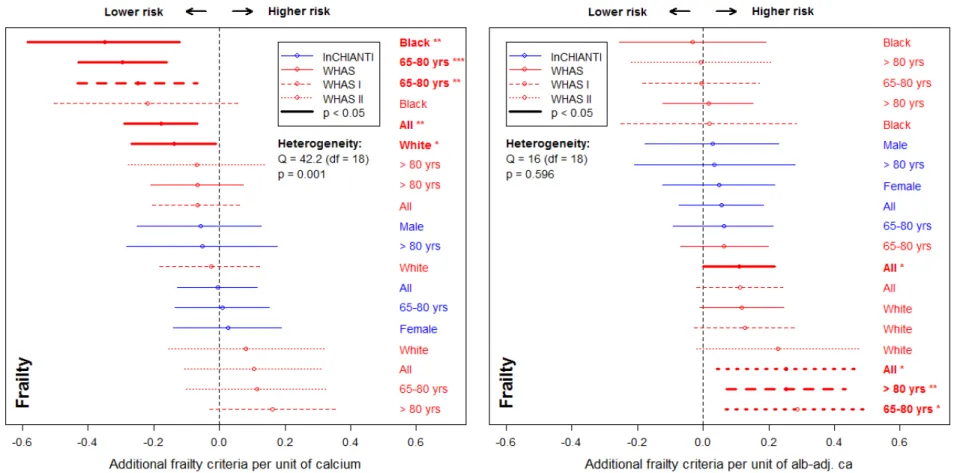
194 Frailty was sometimes associated with calcium levels, but in opposite directions for 195 unadjusted calcium and alb-adj ca: more frailty criteria were significantly associated with
196 lower levels of unadjusted calcium, but with higher levels of alb-adj ca in WHAS I and 197 WHAS II (Fig. 4). However, there was also substantial heterogeneity of these results for 198 unadjusted calcium, and most results were not significant. Negative associations between
199 calcium and frailty were more present in WHAS (meta-regression = -0.05, p = 0.06 and 200 = -0.07, p = 0.005, respectively for WHAS I and WHAS II) than in InCHIANTI. Type of 201 calcium measurement also significantly affected the effect size ( = 0.07, p < 0.001, for 202 considering alb-adj ca compared to unadjusted calcium).
204 Figure 3. Relationships between calcium and mortality. Estimated hazard ratios (points) together with 95% confidence intervals 205 (CIs; segments) are plotted for unadjusted calcium (left panel) and albumin-adj ca (right panel) variables, based on counting process 206 Cox proportional hazards models. See Fig. 2 for further explanations.
207
208 Figure 4. Relationships between calcium and frailty. Poisson regression models were performed on the number of Fried’s frailty 209 criteria (Fried and others 2001) for unadjusted calcium (left panel) and albumin-adj ca (right panel) variables, adjusting for age with a 210 cubic spline. Estimations (points) together with 95% confidence intervals (CIs; segments) are plotted. Longitudinal analyses are shown 211 on the top panels (for WHAS only) and cross-sectional analyses (using the number of frailty criteria at first visit only) are presented on 212 the lower panels. See Fig. 2 for further explanations.
214 Discussion
215 Our analyses demonstrate the challenges in using a single biomarker in an
216 epidemiological study based on a single population. Using the example of calcium, a 217 biomarker appearing frequently in recent epidemiological studies (Larsson and others 218 2010; Lu and others 2016; Reid and others 2016), we show that we can detect effects 219 differing not just in magnitude but direction depending on the population studied and 220 variable definition. For example, using unadjusted calcium in the whole WHAS data set, 221 we could have published an article showing that calcium levels increase with age, are 222 negatively associated with frailty, and unassociated with mortality. However, this
223 conclusion would not have generalized or yielded any important insight: not only is it not 224 replicated across datasets, it is not even replicated within WHAS subsets by age and race. 225 Of course, for the reasons outlined in the Introduction, it would be naïve to
226 hypothesize a general relationship between calcium and age, mortality, and/or frailty. We 227 should expect high levels and low levels to arise through different types of underlying 228 pathology (Parfitt 1979), and to have different consequences for individual health in 229 different physiological contexts (Szewieczek and others 2015). Because these pathologies 230 and contexts vary across age groups and populations, population composition can easily 231 become the primary driver of the results. Our principal objective here is thus not to 232 illuminate calcium epidemiology during aging, and accordingly our study has a number 233 of clear limitations in that context. First, we do not consider (nor generally have access 234 to) sufficient data on dietary consumption or supplements. Second, kidney disease can be 235 a major factor (Parfitt 1979), but we had insufficient data to perform such analyses.
236 Third, we did not target specific subpopulations. For example, calcium might conceivably 237 be a useful biomarker for the efficacy of certain medications to treat osteoporosis, and its 238 use as a single biomarker in that context might be appropriate.
239 While our principal conclusion concerns biomarkers in aging research generally, 240 calcium is not representative of all such biomarkers. Some, such as telomere length, 241 might be markers of the aging process itself, though evidence is mixed (Sanders and 242 Newman 2013) and hope for a single silver-bullet biomarker of aging is dimming with 243 increasing realization that aging is a multi-factorial, complex phenomenon (Cohen 2016; 244 Kirkwood 2005), and that many biomarkers of aging correlate only weakly with each 245 other (Sanders and others 2014). Others, such as hepcidin, may be indicators of very 246 specific aspects of physiological functioning or disease states (Nemeth and others 2003). 247 Calcium is a problematic biomarker because it plays multiple roles and thus can be 248 implicated in multiple pathologies; its levels need to be considered in light of multiple 249 other markers (minimally vitamin D, parathyroid hormone, and albumin, Bushinsky and 250 Monk 1998). Nonetheless, most common clinical biomarkers play multiple roles or 251 present similar levels of complexity for interpretation, among them cholesterol, albumin, 252 C-reactive protein (CRP), insulin-like growth factor (IGF-1), haemoglobin, uric acid, and 253 glucose. These common but challenging markers are increasingly the focus in aging 254 studies (Beekman and others 2016; Martin-Ruiz and others 2011; Mitnitski and others 255 2015). A final class of aging biomarkers increasingly thought to be important (but not 256 always available) are dynamic biomarkers that measure a change in response to a 257 challenge or stimulus (Kalyani and others 2012; Varadhan and others 2008). 258
260 These caveats on the use of biomarkers may seem obvious, but they are rarely 261 incorporated into study design and present a number of specific risks, namely:
262 1. Identification of a biomarker that is conditionally associated with an outcome 263 despite lack of a clear causal role. For example, CRP is thought to be a marker of 264 inflamm-aging and heart disease risk; however, it is very high in the Tsimane hunter-265 gatherers despite an absence of heart disease in this population (Gurven and others 266 2009). This paradox is due to the multiple roles and associations CRP has with 267 different aspects of the inflammatory response triggered under different conditions 268 (Bandeen-Roche and others 2009). Indeed, despite its popularity, CRP is far from the 269 best marker of inflamm-aging, and multivariate indices perform better than
270 univariate ones (Cohen and others in press). This problem cannot be avoided by 271 simple control for other biomarkers in regression models; the complex systems 272 dynamics and feedback effects among the markers break fundamental assumptions of 273 such approaches.
274 2. Identification of associations that are not generalizable, as would have happened 275 had we attempted to publish our calcium findings based only on one of our datasets. 276 While this risk is present for any study (“external validity”), it is particularly acute 277 for biomarker studies given the physiological complexity and the history of
278 conflicting findings.
279 3. Misidentification of “aging biomarkers.” Many biomarkers are thought to change 280 with age and are accordingly used in analyses to understand the aging process. Often, 281 a cross-sectional correlation with age is used to determine a set of aging biomarkers
282 for a more complex analysis (Levine 2013). However, in many cases these age-283 related changes are either not reproduced in longitudinal analyses (as is the case 284 here) or are not reproduced across datasets (also true here and in our previous 285 analyses (Cohen and others 2015b)). For example, both the Pace of Aging (Belsky 286 and others 2015) and the Klemera-Doubal biological age algorithm (Klemera and 287 Doubal 2006; Levine 2013) assume linear change in biomarkers with age, and 288 identify sets of biomarkers based on detected age associations. While both work well 289 in young cohorts where the changes are closer to linear, non-monotonicity presents 290 major challenges for implementation in older cohorts (D. Belsky, pers. comm.). 291 4. Perpetuation of a simplified model of physiology and epidemiology. There is no 292 controversy surrounding either the complex physiological interdependence of many 293 biomarkers (Cohen 2016; Cohen and others 2012), nor the challenges of considering 294 population composition in epidemiological studies. Nonetheless, much of the
295 literature continues to ignore one or both of these factors, generating not just
296 ungeneralizable results but perpetuating a simplified worldview across generations of 297 researchers.
298 5. Variation in population composition (demographics, diseases, diet, etc.) leads to 299 contradictory findings in the literature for calcium and likely for other biomarkers. 300 Epidemiological studies of biomarkers are particularly sensitive to population 301 composition both because biomarkers generally have linear and often non-302 monotonic relationships with other key variables, notably age and outcomes, and 303 because there is strong interdependence among biomarkers, which are integrated into
305 physiological roles and are implicated in multiple pathologies. 306
307 Potential solutions
308 We suggest that epidemiological studies using biomarkers, particularly in the context of 309 aging, must consider three factors: (1) population composition; (2) non-linear and often 310 non-monotonic relationships between biomarkers and other key variables; and (3) 311 interdependence among biomarkers due to their integration into complex regulatory 312 networks. The first factor is often important because of the second and/or the third, but in 313 practical terms each can be considered as a separate methodological challenge. Each 314 factor alone is a major challenge, and proper incorporation of all three simultaneously 315 may seem daunting. Nonetheless, we are convinced it is both possible and essential to 316 make progress in the field despite these challenges. Here are several suggestions. 317 First, problems related to population composition can be addressed by replication, 318 both across datasets and within data subsets as shown here. Emphasis should be put on 319 results that are robust across populations, or where there is a clear explanation for 320 heterogeneous results. The increasing availability of data from diverse cohorts (Erten-321 Lyons and others 2012) implies that it should rarely be acceptable to publish analyses 322 based on a single cohort without independent replication. This is particularly true for 323 biomarker analyses where there is a high risk of non-replicability. Beyond replication, it 324 is important to consider what physiological processes or diseases might be linked to the 325 biomarker in question and how these might vary across populations, particularly when 326 these processes/diseases are not the focus of the study.
327 Second, multiple methods exist to incorporate non-linearity into analyses, ranging 328 from a simple quadratic term to generalized additive models to cubic splines; indeed, in 329 the case of calcium, several studies have used such methods, demonstrating their 330 importance (Durup and others 2012; Lu and others 2016). Often, optimal biomarker 331 values are intermediate rather than very high or very low, a reflection of the need to 332 maintain homeostasis in a complex system (Cohen 2016), and may also be related to the 333 principle of hormesis (Rattan 2008). This generally produces a non-monotonic
334 association with the outcome (e.g. U- or J-shaped). In a multivariate context, statistical 335 distance approaches account for this (Cohen and others 2015a); in a univariate context, 336 extreme high and low quantiles or absolute values of standard-normal-transformed 337 variables may be used (Martin-Ruiz and others 2011; Seplaki and others 2005). 338 Third, multiple solutions exist to tackle physiological complexity. Biomarker 339 dynamics can be evaluated using a stimulus-response paradigm (Varadhan and others 340 2008). Multivariate biomarker analyses provide promising solutions to the problem of 341 physiological interdependence (Arbeev and others 2016). Both the Pace of Aging (Belsky 342 and others 2015) and Klemera-Doubal biological age (Levine 2013) have produced 343 impressive results despite the above-mentioned caveat with the linearity assumption, 344 likely because errors related to individual markers wash out when enough markers are 345 included. Homeostatic dysregulation, as measured via statistical distance, is also a 346 promising method that does not rely on assumptions of linearity or associations with age 347 (Cohen and others 2015a). Use of such integrative approaches does not necessarily solve 348 all questions of population composition (Cohen and others 2016), but can at least avoid 349 some of the problems of interdependence among markers.
351 not every study will be able to deal with them perfectly. Rather, the point is to consider 352 them both in study design (e.g. longitudinal cohort studies designed to permit analysis of 353 multisystem dynamics) and in interpretation. There may be cases where a single
354 biomarker is linearly related with health outcomes in a stable fashion across populations, 355 but there is every reason to expect such cases to be few and far between, particularly 356 when the outcomes are the generalized health conditions common in aging studies 357 (mortality, frailty, disability, quality of life, physical functioning, cognitive decline, etc.). 358 The burden should be shifted to authors to prove generalizability and validity, rather than 359 to suppose them in the absence of evidence, by favouring the design of studies integrating 360 the above outlined criteria.
361
362 Funding
363 This work was supported by the Canadian Institutes of Health Research (CIHR, grant 364 numbers 119485 and 145585). AAC is also supported by a CIHR New Investigator 365 Salary Award and is a member of the Fonds de recherche du Québec – Santé funded 366 Centre de recherche du CHUS and Centre de recherche sur le vieillissement. GF is
367 supported by the European Union’s Horizon 2020 research and innovation program 368 (grant number 633589).
369
370 References
371 Arbeev, K.G.; Ukraintseva, S.V.; Yashin, A.I. Dynamics of biomarkers in relation to 372 aging and mortality. Mech Ageing Dev. 156:42-54; 2016
373 Bandeen-Roche, K.; Walston, J.D.; Huang, Y.; Semba, R.D.; Ferrucci, L. Measuring 374 systemic inflammatory regulation in older adults: evidence and utility. 375 Rejuvenation research. 12:403-410; 2009
376 Barnwell‐Ménard, J.L.; Li, Q.; Cohen, A.A. Effects of categorization method, regression 377 type, and variable distribution on the inflation of Type‐I error rate when
378 categorizing a confounding variable. Statistics in Medicine. 34:936-949; 2015 379 Beekman, M.; Uh, H.-W.; Van Heemst, D.; Wuhrer, M.; Ruhaak, L.R.; Gonzalez-380 Covarrubias, V.; Hankemeier, T.; Houwing-Duistermaat, J.J.; Slagboom, P.E. 381 Classification for longevity potential: the use of novel biomarkers. Frontiers in 382 Public Health. 4; 2016
383 Belsky, D.W.; Caspi, A.; Houts, R.; Cohen, H.J.; Corcoran, D.L.; Danese, A.; Harrington, 384 H.; Israel, S.; Levine, M.E.; Schaefer, J.D.; Sugden, K.; Williams, B.; Yashin, 385 A.I.; Poulton, R.; Moffitt, T.E. Quantification of biological aging in young adults. 386 Proceedings of the National Academy of Sciences. 112:E4104-E4110; 2015 387 Brown, E.M. Physiology of Calcium Homeostasis. in: Bilezikian J.P.M., R.; Levine, A., 388 ed. The Parathyroids; 2001
389 Bushinsky, D.A.; Monk, R.D. Electrolyte quintet: Calcium. Lancet. 352:306-311; 1998 390 Cohen, A.A. Complex systems dynamics in aging: new evidence, continuing questions. 391 Biogerontology. 17:205-220; 2016
392 Cohen, A.A.; Bandeen-Roche, K.; Morissette-Thomas, V.; Fulop, T. A robust 393 characterization of inflamm-aging and other immune processes through 394 multivariate analysis of cytokines from longitudinal studies. in: Fulop T.,
397 Business Media BV; in press
398 Cohen, A.A.; Li, Q.; Milot, E.; Leroux, M.; Faucher, S.; Morissette-Thomas, V.; Legault, 399 V.; Fried, L.P.; Ferrucci, L. Statistical Distance as a Measure of Physiological 400 Dysregulation Is Largely Robust to Variation in Its Biomarker Composition. PloS 401 One. 10:e0122541; 2015a
402 Cohen, A.A.; Martin, L.B.; Wingfield, J.C.; McWilliams, S.R.; Dunne, J.A. Physiological 403 regulatory networks: ecological roles and evolutionary constraints. Trends Ecol 404 Evol. 27:428-435; 2012
405 Cohen, A.A.; Milot, E.; Li, Q.; Bergeron, P.; Poirier, R.; Dusseault-Belanger, F.; Fulop, 406 T.; Leroux, M.; Legault, V.; Metter, E.J.; Fried, L.P.; Ferrucci, L. Detection of a 407 novel, integrative aging process suggests complex physiological integration. 408 PLOS One. 10:e0116489; 2015b
409 Cohen, A.A.; Morissette-Thomas, V.; Ferrucci, L.; Fried, L.P. Deep biomarkers of aging 410 are population-dependent. Aging (Albany NY). 8:2253; 2016
411 Durup, D.; Jorgensen, H.L.; Christensen, J.; Schwarz, P.; Heegaard, A.M.; Lind, B. A 412 reverse J-shaped association of all-cause mortality with serum 25-hydroxyvitamin 413 D in general practice: the CopD study. J Clin Endocrinol Metab. 97:2644-2652;
414 2012
415 Erten-Lyons, D.; Sherbakov, L.O.; Piccinin, A.M.; Hofer, S.M.; Dodge, H.H.; Quinn, 416 J.F.; Woltjer, R.L.; Kramer, P.L.; Kaye, J.A. Review of selected databases of 417 longitudinal aging studies. Alzheimer's & Dementia. 8:584-589; 2012
418 Fried, L.P.; Tangen, C.M.; Walston, J.; Newman, A.B.; Hirsch, C.; Gottdiener, J.; 419 Seeman, T.; Tracy, R.; Kop, W.J.; Burke, G.; McBurnie, M.A.; Cardiovascular 420 Health Study Collaborative Research, G. Frailty in older adults: evidence for a 421 phenotype. The journals of gerontology Series A, Biological sciences and medical 422 sciences. 56:M146-156; 2001
423 Glei, D.A.; Goldman, N.; Lin, Y.H.; Weinstein, M. Age-Related Changes in Biomarkers: 424 Longitudinal Data from a Population-Based Sample. Res Aging. 33:312-326;
425 2011
426 Gurven, M.; Kaplan, H.; Winking, j.; Rodriguez, D.E.; Vasunilashorn, S.; Kim, J.K.; 427 Finch, C.E.; Crimmins, E. Inflammation and Infection Do Not Promote Arterial 428 Aging and Cardiovascular Disease Risk Factors among Lean Horticulturalists. 429 PLOS One. 4:e6590; 2009
430 Kalyani, R.R.; Varadhan, R.; Weiss, C.O.; Fried, L.P.; Cappola, A.R. Frailty status and 431 altered glucose-insulin dynamics. The Journals of Gerontology Series A: 432 Biological Sciences and Medical Sciences. 67:1300-1306; 2012
433 Kirkwood, T.B.L. Understanding the Odd Science of Aging. Cell. 120:437-447; 2005 434 Klemera, P.; Doubal, S. A new approach to the concept and computation of biological 435 age. Mechanisms of ageing and development. 127:240-248; 2006
436 Larsson, T.E.; Olauson, H.; Hagstrom, E.; Ingelsson, E.; Arnlov, J.; Lind, L.; Sundstrom, 437 J. Conjoint effects of serum calcium and phosphate on risk of total,
438 cardiovascular, and noncardiovascular mortality in the community. 439 Arteriosclerosis, thrombosis, and vascular biology. 30:333-339; 2010
441 mortality more accurately than chronological age? The Journals of Gerontology 442 Series A: Biological Sciences and Medical Sciences. 68:667-674; 2013
443 Liu, Z.; Wang, Y.; Huang, J.; Chu, X.; Qian, D.; Wang, Z.; Sun, X.; Chen, F.; Xu, J.; Li, 444 S.; Jin, L.; Wang, X. Blood biomarkers and functional disability among extremely 445 longevous individuals: a population-based study. The journals of gerontology 446 Series A, Biological sciences and medical sciences. 70:623-627; 2015
447 Loeffen, R.; Winckers, K.; Ford, I.; Jukema, J.W.; Robertson, M.; Stott, D.J.; Spronk, 448 H.M.; ten Cate, H.; Lowe, G.D.; Group, P.S. Associations Between Thrombin 449 Generation and the Risk of Cardiovascular Disease in Elderly Patients: Results 450 From the PROSPER Study. The journals of gerontology Series A, Biological 451 sciences and medical sciences. 70:982-988; 2015
452 Lu, J.L.; Molnar, M.Z.; Ma, J.Z.; George, L.K.; Sumida, K.; Kalantar-Zadeh, K.; 453 Kovesdy, C.P. Racial Differences in Association of Serum Calcium with 454 Mortality and Incident Cardio- and Cerebrovascular Events. J Clin Endocrinol 455 Metab. 101:4851-4859; 2016
456 Martin-Ruiz, C.; Jagger, C.; Kingston, A.; Collerton, J.; Catt, M.; Davies, K.; Dunn, M.; 457 Hilkens, C.; Keavney, B.; Pearce, S.H.; den Elzen, W.P.; Talbot, D.; Wiley, L.; 458 Bond, J.; Mathers, J.C.; Eccles, M.P.; Robinson, L.; James, O.; Kirkwood, T.B.; 459 von Zglinicki, T. Assessment of a large panel of candidate biomarkers of ageing 460 in the Newcastle 85+ study. Mech Ageing Dev. 132:496-502; 2011
461 Martin-Ruiz, C.; von Zglinicki, T. Biomarkers of healthy ageing: expectations and 462 validation. The Proceedings of the Nutrition Society. 73:422-429; 2014
463 Mitnitski, A.; Collerton, J.; Martin-Ruiz, C.; Jagger, C.; von Zglinicki, T.; Rockwood, K.; 464 Kirkwood, T.B. Age-related frailty and its association with biological markers of 465 ageing. BMC Medicine. 13:1; 2015
466 Nemeth, E.; Valore, E.V.; Territo, M.; Schiller, G.; Lichtenstein, A.; Ganz, T. Hepcidin, a 467 putative mediator of anemia of inflammation, is a type II acute-phase protein. 468 Blood. 101:2461-2463; 2003
469 Parfitt, A.M. Equilibrium and disequilibrium hypercalcemia. New light on an old 470 concept. Metab Bone Dis and Rel Res. 13:279–293; 1979
471 Payne, R.B.; Little, A.J.; Williams, R.B.; Milner, J.R. Interpretation of serum calcium in 472 patients with abnormal serum proteins. Br Med J. 4:643-646; 1973
473 Rattan, S.I.S. Hormesis in aging. Ageing Research Reviews. 7:63-78; 2008
474 Reid, I.R.; Gamble, G.D.; Bolland, M.J. Circulating calcium concentrations, vascular 475 disease and mortality: a systematic review. J Intern Med; 2016
476 Sanders, J.L.; Ding, V.; Arnold, A.M.; Kaplan, R.C.; Cappola, A.R.; Kizer, J.R.; 477 Boudreau, R.M.; Cushman, M.; Newman, A.B. Do changes in circulating
478 biomarkers track with each other and with functional changes in older adults? The 479 Journals of Gerontology Series A: Biological Sciences and Medical Sciences. 480 69:174-181; 2014
481 Sanders, J.L.; Newman, A.B. Telomere length in epidemiology: a biomarker of aging, 482 age-related disease, both, or neither? Epidemiologic reviews:mxs008; 2013 483 Schottker, B.; Saum, K.U.; Jansen, E.H.; Boffetta, P.; Trichopoulou, A.; Holleczek, B.; 484 Dieffenbach, A.K.; Brenner, H. Oxidative stress markers and all-cause mortality
486 A, Biological sciences and medical sciences. 70:518-524; 2015
487 Schram, M.T.; Trompet, S.; Kamper, A.M.; de Craen, A.J.; Hofman, A.; Euser, S.M.; 488 Breteler, M.M.; Westendorp, R.G. Serum calcium and cognitive function in old 489 age. J Am Geriatr Soc. 55:1786-1792; 2007
490 Sebastiani, P.; Thyagarajan, B.; Sun, F.; Honig, L.S.; Schupf, N.; Cosentino, S.; Feitosa, 491 M.F.; Wojczynski, M.; Newman, A.B.; Montano, M.; Perls, T.T. Age and Sex 492 Distributions of Age-Related Biomarker Values in Healthy Older Adults from the 493 Long Life Family Study. J Am Geriatr Soc. 64:e189-e194; 2016
494 Seplaki, C.L.; Goldman, N.; Glei, D.; Weinstein, M. A comparative analysis of
495 measurement approaches for physiological dysregulation in an older population. 496 Experimental Gerontology. 40:438-449; 2005
497 Shaker, J.L.; Deftos, L. Calcium and Phosphate Homeostasis. in: De Groot L.J., Beck-498 Peccoz P., Chrousos G., Dungan K., Grossman A., Hershman J.M., Koch C., 499 McLachlan R., New M., Rebar R., Singer F., Vinik A., Weickert M.O., eds. 500 Endotext. South Dartmouth (MA); 2000
501 Szewieczek, J.; Dulawa, J.; Francuz, T.; Legierska, K.; Hornik, B.; Wlodarczyk-Sporek, 502 I.; Janusz-Jenczen, M.; Batko-Szwaczka, A. Mildly elevated blood pressure is a 503 marker for better health status in Polish centenarians. Age. 37:9738; 2015 504 Varadhan, R.; Seplaki, C.L.; Xue, Q.L.; Bandeen-Roche, K.; Fried, L.P. Stimulus-505 response paradigm for characterizing the loss of resilience in homeostatic 506 regulation associated with frailty. Mechanisms of Ageing and Development. 507 129:666-670; 2008
508 Yashin, A.I.; Arbeev, K.G.; Akushevich, I.; Arbeeva, L.; Kravchenko, J.; Il'yasova, D.; 509 Kulminski, A.; Akushevich, L.; Culminskaya, I.; Wu, D.; Ukraintseva, S.V. 510 Dynamic determinants of longevity and exceptional health. Curr Gerontol Geriatr
511 Res; 2010
calcium levels with age, mortality, and frailty vary substantially across
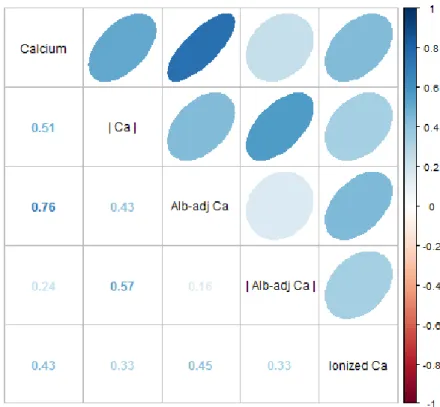
populations
Alan A. Cohen, Véronique Legault, Georg Fuellen, Tamàs Fülöp, Linda P. Fried, and Luigi Ferrucci
Appendix in support of an article published in
Experimental Gerontology
Material and methods
Data sets
We used data from three longitudinal cohort studies of community dwelling older adults, although two contain a small proportion of younger individuals (see Table 1 for details). Invecchiare in Chianti (InCHIANTI) is a prospective population-based study of 1156 adults aged 65–102 and 299 aged 20– 64, randomly selected using multistage stratified sampling from two towns in Tuscany, Italy (Ferrucci and others 2000). The Women’s Health and Aging Study (WHAS) is a population-based prospective study of community-dwelling women drawn from eastern Baltimore City and Baltimore County, originally consisting of two separate studies: WHAS I, which includes 1002 women aged 65+ among the 1/3 most disabled in the population (Fried and others 1995), and WHAS II, which includes 436 women aged 70–79 among the 2/3 least disabled (Guralnik 1995). The Baltimore Longitudinal Study of Aging (BLSA), one of the world's longest studies of aging in humans, is composed of community-dwelling adults in the Baltimore and Washington DC areas aged 21–96 (Shock 1984). A 2003 re-design of methodology was tailored to improve the inference for systems-level questions (Ferrucci 2009). Although the data used in these analyses cannot be freely shared due to confidentiality
constraints related to human medical data, they are all available to researchers submitting an
appropriate research proposal: InCHIANTI at http://www.inchiantistudy.net/obtain_data.html, WHAS at https://jhpeppercenter.jhmi.edu/ec_proposal/login.aspx, and BLSA at
http://www.blsa.nih.gov/researchers. Analyses included 1310 individuals for InCHIANTI, 796 for WHAS I, 430 for WHAS II, and 1290 for BLSA, based on calcium variable availability.
All aspects of dataset collection were approved by the ethics committees at the institutions responsible for data collection, or by the National Institute of Environmental Health Services Internal Review Board for BLSA, and this secondary analysis was approved by the ethics committee (Comité
d’éthique de la recherche en santé chez l’humain) at the Centre de recherche clinique du CHUS,
project # 14-059. Participants signed informed consent for data collection and analysis.
Data analysis
Calcium values were normally distributed in all data sets. Calcium was quantified with or without adjustment for albumin (Goltzman 2005):
Adjusted calcium (mmol/L) = Total calcium (mmol/L) + 0.02 [40 - Albumin (g/L)] (1) Both versions were then centered at zero by subtracting the mean and scaled to have standard deviation (SD) =1 by dividing by SD. We also used absolute values of the above metrics to quantify deviation from the mean. Ionized calcium was only available for 296 individuals of the BLSA dataset, hence analyses with this variable did not have sufficient statistical power and are thus not presented, except to compare to the albumin-adjusted measure (see Fig. A.1).
We used subsets of each cohort to assess the association of calcium and age in different population groups: sex, age (<65 years, 65-80 years, and 80+ years), and race (white or black), as available for each cohort. Initially, we performed analyses in a small subset of subjects from
cohort subsets. All analyses were performed in R v3.2.2. All code is available at Open Science Framework (https://osf.io/wxhc4).
Association of calcium with age
First, we assessed cross-sectional associations between calcium and age using Pearson correlations (cor.test function), applied only to each individual’s first visit with complete calcium measures. Second, to measure longitudinal individual changes, trajectories of calcium with age were estimated using Bayesian mixed models implemented in R using the MCMCglmm package, with uninformative priors (Hadfield 2010). Burn-in, thinning, and number of iterations were adjusted to arrive at an MCMC sample of 1000 retained iterations with minimized auto-correlations in Markov chain samples (<0.1) after model convergence (10,100 iterations and burn-in at 100). Initial models used either a cubic spline of age or a quadratic function, but the quadratic term was rarely significant (data not shown) and were thus excluded from models. Final models included individual-level random intercepts and age at each visit, but not individual slopes. We modeled age in two ways: 1) with a cubic spline (bs function (fda package), using four knots in WHAS, five knots in InCHIANTI and BLSA (due to their larger age range, see Table 1), and three knots for age group subsets; or 2) linearly to estimate individual slopes.
Association with mortality and frailty
To analyze the relationship between calcium and mortality, we performed Cox proportional hazards regression models (coxph function, survival package). We used calcium values and age at first visit, with censoring at age of last contact or death, using a counting process formulation.
We used the number of frailty criteria (between 0 and 5), according to Fried’s phenotype
definition (Fried and others 2001), which are: 1) unintentional weight loss, 2) fatigue, 3) reduced grip strength, 4) reduced physical activity, and 5) low gait speed. Fulfilling three or more of these criteria indicates clinical frailty. We used the number of frailty criteria, rather than frailty state in order to maximize statistical power; however, similar results are obtained using a dichotomous frail-non-frail outcome (data not shown). We did not have frailty measures for BLSA, only at baseline for
InCHIANTI, but at all visits for WHAS. The association between the number of frailty criteria and calcium was assessed using Poisson regression with the glmer function (lme4 package), either considering only the first visit or all visits for WHAS. Age cubic spline was included in models as a covariate as described earlier. Since data were available longitudinally for WHAS, models including subject-level random intercepts were also performed. As Poisson regression may be a questionable choice to model the number of frailty criteria, we compared results to models based on ordered logistic regression (polr function from the MASS package). Similar results were obtained with both models (see Fig. A.10). In our regression models, we also tested an interaction term between the calcium variable and age, but chose to exclude it in final analyses since it was generally far from significant and often prevented model convergence.
Linear regressions on effect sizes
In order to assess the sensitivity of analyses to the choice of calcium variable and population composition, we performed linear regressions (lm function) on the effect sizes obtained with the previous analyses (the dependent variable). Models included a dummy variable indicating the type of calcium variable (unadjusted calcium = 0; alb-adj ca = 1), as well as age, sex, and dataset used as covariates. We also ran Bayesian mixed models (MCMCglmm function) on the full combined dataset to look at the effect of dataset and sex on calcium changes with age, including individual slopes as a
which were included in separate models. Finally, we calculated the heterogeneity (Q) among the different results using the rma.uni function (metaphor package). Heterogeneity analyses were stratified by outcome (age, mortality, frailty). Results were similar with and without stratification by longitudinality for frailty (see Table A.2 and Figs 4 and A.9).
References
Cohen, A.A.; Li, Q.; Milot, E.; Leroux, M.; Faucher, S.; Morissette-Thomas, V.; Legault, V.; Fried, L.P.; Ferrucci, L. Statistical distance as a measure of physiological dysregulation is largely robust to variation in its biomarker composition. PLOS One. 10:e0122541; 2015a
Cohen, A.A.; Milot, E.; Li, Q.; Bergeron, P.; Poirier, R.; Dusseault-Belanger, F.; Fulop, T.; Leroux, M.; Legault, V.; Metter, E.J.; Fried, L.P.; Ferrucci, L. Detection of a novel, integrative aging process suggests complex physiological integration. PLOS One. 10:e0116489; 2015b
Cohen, A.A.; Milot, E.; Yong, J.; Seplaki, C.L.; Fulop, T.; Bandeen-Roche, K.; Fried, L.P. A novel statistical approach shows evidence for multi-system physiological dysregulation during aging. Mech Ageing Dev. 134:110-117; 2013
Ferrucci, L. The Baltimore Longitudinal Study on Aging: a 50 year long journey and plans for the future. Giornale di Gerontologia. 57:3-8; 2009
Ferrucci, L.; Bandinelli, S.; Benvenuti, E.; Di Iorio, A.; Macchi, C.; Harris, T.B.; Guralnik, J.M. Subsystems contributing to the decline in ability to walk: bridging the gap between epidemiology and geriatric practice in the InCHIANTI study. J Am Geriatr Soc. 48:1618-1625; 2000
Fried, L.P.; Kasper, K.D.; Guralnik, J.M.; Simonsick, E.M. The Women’s Health and Aging Study: an introduction. in: Guralnik J.M., Fried L.P., Simonsick E.M., Kasper K.D., Lafferty M.E., eds. The Women’s Health and Aging Study: health and social characteristics of old women with disability. Bethesda, MD: National Institute on Aging; 1995
Fried, L.P.; Tangen, C.M.; Walston, J.; Newman, A.B.; Hirsch, C.; Gottdiener, J.; Seeman, T.; Tracy, R.; Kop, W.J.; Burke, G.; McBurnie, M.A.; Cardiovascular Health Study Collaborative Research, G. Frailty in older adults: evidence for a phenotype. The journals of gerontology Series A, Biological sciences and medical sciences. 56:M146-156; 2001
Goltzman, D. Approach to hypercalcemia. in: Arnold A., ed. Diseases of Bone and Calcium Metabolism; 2005
Guralnik, J.M., Fried, L.P., Kasper, J.D., Simonsick, E.M. & Lafferty, M.E. The Women's Health and Aging Study: health and social characteristics of older women with disability. Washington DC: National Institute on Aging; 1995
Hadfield, J.D. MCMC methods for multi-response generalized linear mixed models: The MCMCglmm R package. Journal of Statistical Software. 33:1–22; 2010
Li, Q.; Wang, S.; Milot, E.; Bergeron, P.; Ferrucci, L.; Fried, L.P.; Cohen, A.A. Homeostatic dysregulation proceeds in parallel in multiple physiological systems. Aging Cell. 14:1103-1112; 2015
Mahalanobis, P.C. Mahalanobis distance. Proc Natl Inst Sci India. 49:234–256; 1936
Shock, N.W. Normal Human Aging: The Baltimore Longitudinal Study of Aging. Vol NIH-84-2450 661 (National Institute of Aging, Washington DC); 1984
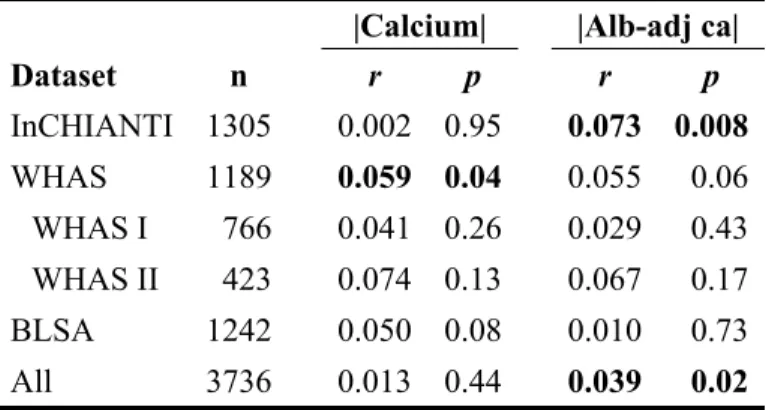
Table A.1. Correlation coefficients between age and calcium level at first visit for absolute values.
|Calcium| |Alb-adj ca|
Dataset n r p r p InCHIANTI 1305 0.002 0.95 0.073 0.008 WHAS 1189 0.059 0.04 0.055 0.06 WHAS I 766 0.041 0.26 0.029 0.43 WHAS II 423 0.074 0.13 0.067 0.17 BLSA 1242 0.050 0.08 0.010 0.73 All 3736 0.013 0.44 0.039 0.02
Table A.2. Heterogeneity of results obtained with different population compositions for associations between calcium and age, mortality, and frailty (see Figs 2-4 and A.7-A.9).
Yearly change Mortality Frailty
Variable Q df p Q df p Q df p
Calcium 206.1 28 <0.001 17.0 25 0.88 66.5 34 0.001 |Calcium| 97.2 28 <0.001 8.3 25 1.00 37.9 34 0.30 Alb-adj ca 430.7 28 <0.001 18.1 25 0.84 37.1 34 0.33 |Alb-adj ca| 89.9 28 <0.001 6.3 25 1.00 31.9 34 0.57
WHAS WHAS I WHAS II BLSA Variable β p β p β p β p Ca 0.010 < 0.001 0.003 0.46 0.027 < 0.001 0.009 < 0.001 |Ca| 0.007 < 0.001 0.002 0.48 0.016 < 0.001 0.001 0.29 Alb-adj ca 0.016 < 0.001 -0.001 0.69 0.047 < 0.001 0.004 0.07 |Alb-adj ca| 0.005 0.02 -0.002 0.51 0.017 < 0.001 0.001 0.47
Supplementary Figures
Figure A.1. Correlations among different versions of calcium measures. Correlations were calculated with 296 individuals from the BLSA cohort. Ellipses above the diagonal indicate correlations visually: blue when positive, red when negative, and darker and narrower when stronger. Correlation coefficients are shown below the diagonal. | Ca |, absolute calcium values; Alb-adj Ca, albumin-adjusted calcium values; | Alb-adj Ca |, absolute albumin-albumin-adjusted calcium values.
Figure A.2. Calcium trajectories with age according to sex. Yearly change in calcium (left panel) and albumin-adjusted calcium (alb-adj. ca; right panel) are plotted as a function of age. Trajectories were estimated using Bayesian mixed models with age as a cubic spline (with 5 knots for InCHIANTI and BLSA, and 4 knots for WHAS) for three longitudinal cohorts (as indicated with different colors), for males (solid lines) or females (dashed lines). WHAS contains only women and age started at 66, while InCHIANTI and BLSA had a small fraction of younger patients and both sexes.
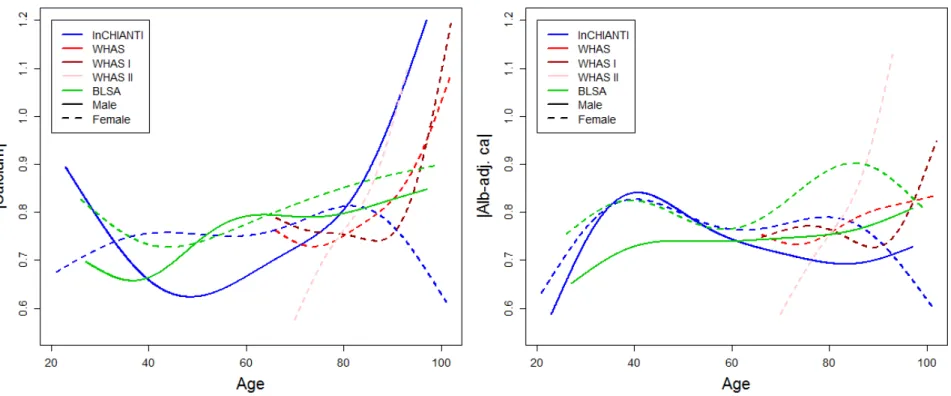
Figure A.3. Absolute calcium trajectories with age according to sex. Yearly change in absolute calcium (|calcium|; left panel) and
absolute albumin-adjusted calcium (|alb-adj. ca|; right panel) are plotted as a function of age. Absolute values indicate deviation from
the mean, and thus dysregulation irrespective of direction. Trajectories were estimated using Bayesian mixed models with age as a cubic spline (with 5 knots for InCHIANTI and BLSA, and 4 knots for WHAS) for three longitudinal cohorts (as indicated with different colors), for males (solid lines) or females (dashed lines). WHAS contains only women and age started at 66, while InCHIANTI and BLSA had a small fraction of younger patients and both sexes.
Figure A.4. Trajectory of calcium values with age estimated for different age groups. Yearly change in calcium (left panel) and
albumin-adjusted calcium (alb-adj. ca; right panel) are plotted as a function of age. Trajectories were estimated using Bayesian mixed
models with age as a cubic spline (with 3 knots) for three longitudinal cohorts (as indicated with different colors), and for different age subsets: younger than 65 years old (dashed lines), 65 to 80 years old (dotted lines), and older than 80 years old (dot-dash lines). Analyses for WHAS were performed either combining WHAS I and WHAS II (red), or with either one (darker red for WHAS I and lighter red for WHAS II). Age started at 66 for WHAS, while InCHIANTI and BLSA had a small fraction of younger patients.
Figure A.5. Trajectory of absolute calcium values with age estimated for different age groups. Yearly change in absolute
calcium (|calcium|; left panel) and absolute albumin-adjusted calcium (|alb-adj. ca|; right panel) are plotted as a function of age.
Trajectories were estimated using Bayesian mixed models with age as a cubic spline (with 3 knots) for three longitudinal cohorts (as indicated with different colors), and for different age subsets: younger than 65 years old (dashed lines), 65 to 80 years old (dotted lines), and older than 80 years old (dot-dash lines). Analyses for WHAS were performed either combining WHAS I and WHAS II (red), or with either one (darker red for WHAS I and lighter red for WHAS II). Age started at 66 for WHAS, while InCHIANTI and BLSA had a small fraction of younger patients.
albumin-adjusted calcium (|alb-adj. ca|; right panel) are plotted as a function of age. Trajectories were estimated using Bayesian
mixed models with age as a cubic spline (with 5 knots for InCHIANTI and BLSA, and 4 knots for WHAS) for three longitudinal cohorts, as indicated with different colors, using centered and reduced variables. Analyses for WHAS were performed either combining WHAS I and WHAS II (solid lines), or with either one (dashed and dotted lines, respectively for WHAS I and WHAS II). Age started at 66 for WHAS, while InCHIANTI and BLSA had a small fraction of younger patients.
Figure A.7. Yearly changes in absolute calcium values with age. Yearly change in absolute calcium (|calcium|; left panel) and
absolute albumin-adjusted calcium (|alb-adj. ca|; right panel) were estimated using Bayesian linear mixed models using centered and
reduced variables, and slopes (points) obtained are plotted with their 95% confidence intervals. Different colors indicate different datasets and text on the right describe the cohort subset on which the analysis was performed. Analyses for WHAS were performed either combining WHAS I and WHAS II (solid lines), or with either one (dashed and dotted lines, respectively for WHAS I and
Figure A.8. Relationships between absolute calcium values and mortality. Estimated hazard ratios (points) together with 95% CIs (segments) are plotted for absolute calcium (|calcium|; left panel) and absolute albumin-adjusted calcium (|alb-adj. ca|; right panel), based on counting process Cox proportional hazards models with centered and reduced variables. See Fig. A.7 for further explanations.
of Fried’s frailty criteria (Fried and others 2001) for absolute calcium (|calcium|; left panel) and absolute albumin-adjusted calcium (|alb-adj. ca|; right panel), adjusting for age and using centered and reduced variables. Estimations (points) together with 95% CIs (segments) are plotted. Longitudinal analyses are shown on the top panels (for WHAS only) and cross-sectional analyses (using the number of frailty criteria at first visit only) are presented on the lower panels. See Fig. A.7 for further explanations.
Figure A.10. Relationships between calcium values and frailty using ordered logistic regression. Ordered logistic regression models were performed on the number of Fried’s frailty criteria at first visit (Fried and others 2001) for unadjusted calcium left panel) and albumin-adjusted calcium (alb-adj. ca; right panel), adjusting for age and using centered and reduced variables. Estimations (points) together with 95% CIs (segments) are plotted. See Fig. A.7 for further explanations.