Universit´e du Qu´ebec
Institut national de la recherche scientifique ´
Energie, Mat´eriaux et T´el´ecommunications
Contributions to QoE management of live IP
media
A dissertation submitted in partial fulfillment of the requirements for the degree of Doctor of Philosophy
By Ahmad Vakili
Evaluation Jury
External Examiner Prof. S. Valaee, University of Toronto External Examiner Dr. J.-D. Decotignie, CSEM
Internal Examiner Prof. T. Falk
Research Director Prof. Jean-Charles Gr´egoire
INRS– ´Energie, Mat´eriaux et T´el´ecommunications
“If we knew what it was we were doing, it would not be called research, would it?” Albert Einstein
i
Abstract
Increased public access to broadband networks has led to a fast-growing demand for Voice and Video over IP (VVoIP) applications such as Internet telephony (VoIP), video conferencing, and IP television (IPTV). While the evaluation of Video (or Speech) com-munication systems has been an important field for both academia and industry for decades, the introduction of VVoIP systems has created a new set of issues that require new evalua-tion methods. Moreover, since we have moved to a unique network for multiple services, it has appeared that traditional QoS measures do not tell a sufficient story and the focus has moved to end user’s perceptual quality. Perceived video quality is affected by distor-tion caused by the encoder and the network impairments. The effect of these distordistor-tions depends on different video specifications such as video content, video resolutions, etc., but these parameters have not been widely used in existing perceptual video quality prediction and management models.
The main goal of our research is the development of a control algorithm for percep-tual video quality for online video streaming applications. This aim has led to five main contributions as follows:
• Investigation and improvement of packet loss probability estimation methods; • Investigation and improvement of One Way Delay (OWD) estimation methods; • Investigation of effects of packet/frame loss on multimedia/video quality according
ii
• Accurate (subjective) measurement of the perceived quality of videos with different codec characteristics (Quantization parameter and frame-rate).
• Investigation of different video bit rate-controlling mechanisms/models to manage the end user’s perceived quality and development of an algorithm to control the per-ceptual video quality for video conferencing applications;
iii
Acknowledgments
It is a pleasure to thank the many people who made this thesis possible.
First and foremost, I would like to express my deepest gratitude to my advisor Professor Jean-Charles Gr´egoire. With his enthusiasm, his inspiration, and his great efforts to explain things clearly and simply, he made the research process more interesting to me. Throughout my PhD period, he provided encouragement, sound advice, good teaching, good company, and lots of fantastic ideas, but he always gave me great freedom to pursue independent work.
I am indebted to my many colleagues for providing a stimulating and fun environment in which I could learn and grow. I am especially grateful to Dr. Keyvan Zarifi, Dr. Vahid Asghari, and Mr. Marcelo Santos.
I am also grateful to the administration staff, especially Madam H`el´en Sabourin, for assisting me in many different ways.
I wish to thank my entire extended family for all their love and encouragement.
Lastly, and most importantly, I wish to thank my lovely wife, Sara, to whom I owe my life, my love, and my soul. This dissertation is dedicated to her who walked this road with me every step of the way. I love you with all my heart and hope that our life together will be filled with love and prosperity.
Ahmad Vakili September 2012
Contents
Abstract i
Acknowledgments iii
List of Figures xi
List of Tables xv
Liste des Figures xvi
Liste des Tables xxi
List of Acronyms xxii
1 Introduction 1 1.1 Overview . . . 1 1.2 Motivation . . . 3 1.3 Goals . . . 7 1.4 Contributions . . . 10 1.5 Document outline . . . 12
vi CONTENTS
2.1 QoE Definition . . . 16
2.2 Multimedia Quality Measurement . . . 17
2.2.1 Subjective Perceived Quality Measurement . . . 18
Subjective Perceived Voice Quality Assessment . . . 19
Subjective Perceived Video Quality Assessment . . . 20
2.2.2 Objective Perceived Quality Measurement . . . 24
Objective Perceived Video Quality Assessment . . . 24
Objective Perceived Voice Quality Assessment . . . 28
2.3 Network Parameters . . . 31
2.3.1 Loss . . . 31
2.3.2 Delay . . . 33
2.3.3 Jitter . . . 35
2.4 Conclusion . . . 36
3 Packet Loss Probability Estimation 37 3.1 Introduction . . . 37
3.2 Previous work . . . 39
3.3 Definitions . . . 41
3.3.1 Input traffic model . . . 41
3.3.2 Packet loss probability . . . 42
3.3.3 Effective bandwidth . . . 43
3.4 Packet Loss Probability Estimator . . . 43
3.5 Simulation Testbed . . . 49
3.6 Numerical Results Analysis . . . 50
3.6.1 Input traffic . . . 50
3.6.2 Individual flow loss . . . 52
CONTENTS vii
3.7 Conclusion . . . 57
4 One-Way Delay Estimation 61 4.1 Introduction . . . 61
4.2 Previous work . . . 63
4.3 OWD Estimation . . . 65
4.3.1 Third-party model . . . 65
4.3.2 More accurate estimation: Improvement of LSE with new constraints 67 4.3.3 Effect of different constraints on the improvement of estimation accuracy . . . 69
4.4 The proposed transmission delay measurement method . . . 70
4.5 Simulations and numeric results . . . 73
4.6 Conclusion . . . 83
5 Loss Effects on Video Quality 85 5.1 Introduction . . . 85
5.2 Previous work . . . 86
5.3 Effect of frame loss position on distortion . . . 88
5.3.1 Definitions . . . 88
5.3.2 Empirical observations . . . 89
5.3.3 Estimation model . . . 89
5.4 Simulation and Numeric Results . . . 93
5.5 Effect of transmission pattern on average P SN R in noisy channels . . . 95
5.5.1 Packet loss model . . . 96
5.5.2 Simulation . . . 99
viii CONTENTS
6 Perceptual Video Quality Management 103
6.1 Introduction . . . 103
6.2 Background . . . 106
6.2.1 Effect of video parameters on Perceptual quality . . . 106
6.2.2 Rate control for congestion and loss avoidance . . . 107
6.3 Effect of video parameters on video bit rate . . . 109
6.4 Subjective assessment experimental setup . . . 110
6.4.1 Subjective test methodology . . . 110
6.4.2 Subjects . . . 112
6.4.3 Test setup . . . 112
6.5 Experimental results . . . 112
6.5.1 Perceived quality and frame rate . . . 112
6.5.2 Perceived quality and compression level . . . 113
6.5.3 Perceived quality and bit rate . . . 114
6.6 Transport and quality control . . . 116
6.6.1 Congestion control algorithm . . . 117
6.6.2 Bandwidth estimation . . . 119
6.6.3 Frame rate and QP selection . . . 120
6.7 Validation . . . 121
6.8 Conclusion . . . 127
7 General Conclusions and Perspectives 129 7.1 Introduction . . . 129
7.2 Conclusions and Contributions . . . 130
7.3 Current Research Limitations . . . 132
CONTENTS ix
A Adaptive Video Streaming Application 137
A.1 Introduction . . . 137
A.2 GStreamer . . . 138
A.3 Application Architecture . . . 139
A.4 Server . . . 139 A.5 Client . . . 140 B R´esum´e de la th`ese 143 B.1 Vue d’ensemble . . . 143 B.2 Motivation . . . 145 B.3 Objectifs . . . 149 B.4 Contributions . . . 152 B.5 Plan du document . . . 162 Bibliography 169
List of Figures
2.1 Stimulus presentation and voting time in the ACR method. . . 23
2.2 Stimulus presentation and voting time in the DCR method. . . 23
2.3 Stimulus presentation and voting time in the PC method. . . 24
2.4 Block diagram showing the operation of PSQM and similar algorithms, . . 29
2.5 Media over IP system. . . 31
3.1 Measurement, estimation, and control loop schematic. . . 39
3.2 Testbed topology. . . 48
3.3 Aggregated input traffic characteristics in the network core. . . 51
3.4 Comparison of the MPEG2 loss ratio with the aggregated traffic loss ratio. . 52
3.5 Comparison of plp (measured loss) and epl (estimated loss with offset). . . 53
3.6 Measurement and estimation of packet loss probability when plp is about -2.5. . . 54
3.7 Measurement and estimation of packet loss probability when plp is about -1.5. . . 55
3.8 PDF of error for estimator which uses (3.29) when buffer size is 10. . . 56
3.9 The comparison of PDF of error for different conditions. . . 59
4.1 Third-party model. . . 66
xii LIST OF FIGURES
4.3 Two end-node connection with Internet. . . 71
4.4 The effect of symmetric constraints on tbc+ tca. . . 76
4.5 The effect of symmetric constraints (propagation and process delays) on tab (i.e., estimated OWD). . . 77
4.6 The effect of asymmetric constraints (transmission delay) on tab(i.e., esti-mated OWD). . . 78
4.7 Testbed topology for cyclic-path simulation. . . 79
4.8 Testbed topology for transmission delay measurement simulation. . . 81
4.9 Forward and backward calculated transmission delay for the G.711 packets (i.e., 250 bytes). . . 82
5.1 P SN R of three types of video which encounter a single frame loss. . . 90
5.2 Accuracy of proposed vs. geometric methods to estimate the P SN R for subsequent frames of the lost frame in Bridge-Close video . . . 94
5.3 Accuracy of proposed vs. geometric methods to estimate the P SN R for subsequent frames of the lost frame in News video . . . 94
5.4 Average P SN R for different loss relative positions to the preceding I-frame 96 5.5 Packet loss model. . . 97
5.6 Bursty sending model in noisy environment . . . 99
6.1 Bit rate versus QP for different frame rates. . . 110
6.2 Bit rate versus frame rate for different QPs. . . 111
6.3 MOS versus QP for different frame rates. . . 113
6.4 MOS versus frame rate for different QP values. . . 115
6.5 MOS versus bit rate for different frame rates. . . 116
6.6 Overview of the perceptual quality control system using the available band-width estimation. . . 117
LIST OF FIGURES xiii
6.8 Testbed topology for simulation. . . 123
6.9 Available bandwidth estimation. . . 123
6.10 Comparison between proposed and TCPF congestion control algorithms from QoE’s point of view. . . 124
6.11 Throughput comparison of our proposed congestion control algorithm and TCPF when the probability of occasional loss is 0.02. . . 125
6.12 Comparison between proposed and constant frame-rate perceptual quality control algorithms. . . 126
6.13 Comparison between proposed and constant-QP perceptual quality control algorithms. . . 127
A.1 Video streaming application architecture. . . 140
A.2 Server pipeline. . . 140
A.3 Client pipeline. . . 141
B.1 Topologie du banc d’essai. . . 153
B.2 Mesure et estimation de la probabilit´e de perte pour un plp de -2,5. . . 153
B.3 Mesure et estimation de la probabilit´e de perte pour un plp de -1,5. . . 154
B.4 Mod`ele de mesure avec tiers. . . 155
B.5 Topologie de test pour la simulation du chemin cyclique. . . 156
B.6 Topologie de test pour la simulation de la mesure du d´elai de transmission. . 156
B.7 D´elais de transmission aller et retour calcul´es pour des paquets G.711 (i.e., 250 bytes). . . 157
B.8 Calcul du PSNR pour trois types de vid´eo avec une perte de trame unique. . 159
B.9 Comparaison des m´ethodes propos´ees et g´eom´etriques pour l’estimation du PSNR (Bridge-Close) . . . 160
B.10 Comparaison des m´ethodes propos´ees et g´eom´etriques pour l’estimation du PSNR (News) . . . 160
xiv LIST OF FIGURES B.11 PSNR moyen pour diff´erentes positions de perte par rapport `a la trame intra
pr´ec´edente. . . 162
B.12 Mod`ele de perte de paquet. . . 163
B.13 Mod`ele de transmission en rafale en environnement bruit´e. . . 163
B.14 D´ebit pour diff´erentes valeurs de QP pour formats QCIF, CIF, VGA. . . 164
B.15 D´ebit contre taux de trame pour diff´erentes valeurs de QP. . . 165
List of Tables
2.1 Voice codecs characteristics [2]. . . 34 3.1 Statistics Synopsis on Loss Probability Estimation for Different Estimators
When plp is About -2.5. . . 57 3.2 Statistics Synopsis on Loss Probability Estimation for Different Estimators
When plp is About -1.5. . . 57 4.1 Simulation detail results for the path from node A to node B . . . 80 5.1 Suggested values of α for three types of video with different bit rates . . . . 91 5.2 Suggested amounts of β for three types of video based on the temporal
distance between the examined frame and the lost frame (cM∗ < n) . . . . 91 5.3 Average P SN R error (dB) for a single P-frame loss, given by proposed
and geometric models . . . 93 5.4 Average P SN Rs and probabilities of different burst length for uniform and
bursty transmission patterns when there is one 80 ms noisy period every second and the packets/frames are sent in a uniform or in bursty pattern. . . 100 6.1 MOSand 95% Confidence Interval (C.I) values for different video clips. . . 114 6.2 Simulation detail results for assessing the protective effect of pre-congestion
LISTE DES FIGURES xvii
Liste des Figures
2.1 S´equence test et temps de vote dans la m´ethode ACR . . . 23
2.2 S´equence test et temps de vote dans la m´ethode DCR . . . 23
2.3 S´equence test et temps de vote dans la m´ethode PC . . . 24
2.4 Sch´ema bloc des op´erations de PSQM et algorithmes similaires . . . 29
2.5 Chaˆıne de transmission m´edia sur IP. . . 31
3.1 Mesure, estimation et boucle de r´eglage . . . 39
3.2 Topologie du banc d’essai . . . 48
3.3 Caract´eristiques des agr´egats de trafic dans le cœur du r´eseau . . . 51
3.4 Comparaison du taux de perte du trafic MPEG2 par rapport `a celui de l’agr´egat. 52 3.5 Comparaison de plp (perte mesur´ee) et epl (perte estim´ee avec perte) . . . 53
3.6 Mesure et estimation de la probabilit´e de perte pour un plp de -2,5 . . . 54
3.7 Mesure et estimation de la probabilit´e de perte pour un plp de -1,5 . . . 55
3.8 Distribution de perte pour une taille de tampon de 10 avec estimateur 3.29 . . . 56
3.9 Comparaison de la distribution de la perte dans diff´erentes conditions . . . 59
4.1 Mod`ele de mesure avec tiers . . . 66
4.2 R´egion d´efinie par l’´equation 4.6. . . 69
4.3 Connexion des nœuds terminaux `a l’Internet . . . 71
4.4 Effet des contraintes sym´etriques sur tbc+ tca. . . 76
4.5 Effet des contraintes sym´etriques sur tab. . . 77
LISTE DES FIGURES xviii 4.7 Topologie de test pour la simulation du chemin cyclique . . . 79 4.8 Topologie de test pour la simulation de la mesure du d´elai de transmission . . 81 4.9 D´elais de transmission aller et retour calcul´es pour des paquets G.711 . . . 82 5.1 Calcul du PSNR pour trois types de vid´eo avec une perte de trame unique . . . 90 5.2 Comparaison des m´ethodes propos´ee et g´eom´etrique pour l’estimation
du PSNR . . . 94 5.3 Comparaison des m´ethodes propos´ees et g´eom´etriques pour l’estimation
du PSNR . . . 94 5.4 PSNR moyen pour diff´erentes positions de perte par rapport `a la trame intra
pr´ec´edente . . . 96 5.5 Mod`ele de perte de paquet . . . 97 5.6 Mod`ele de transmission en rafale en environnement bruit´e . . . 99 6.1 D´ebit pour diff´erentes valeurs de QP pour formats QCIF, CIF, VGA . . . 110 6.2 D´ebit contre taux de trame pour diff´erentes valeurs de QP . . . 111 6.3 MOS contre QP pour diff´erents taux de trame . . . 113 6.4 D´ebit contre taux de trame pour diff´erentes valeurs de QP . . . 115 6.5 MOS contre d´ebit pour diff´erents taux de trame . . . 116 6.6 Aperc¸u du syst`eme de contrˆole de la perception bas´e sur la mesure de bande
passante disponible . . . 117 6.7 Topologie du banc d’essai de la m´ethode d’estimation de la bande passante. . 120 6.8 Topologie du banc d’essai pour les simulations . . . 123 6.9 Estimation de la bande passante disponible . . . 123 6.10 Comparaison des algorithmes de contrˆole de congestion du point de vue
de la QoE . . . 124 6.11 Comparaison des d´ebits des algorithmes pour une probabilit´e de perte
LISTE DES FIGURES xix 6.12 Comparaison du MOS de l’algorithme propos´e par rapport `a un taux de trame
constant . . . 126 6.13 Comparaison du MOS de l’algorithme propos´e par rapport `a diff´erentes
valeurs de QP. . . 127 A.1 Architecture applicative de la transmission vid´eo en continu . . . 140 A.2 Chaˆıne de transmission du serveur . . . 140 A.3 Chaˆıne de r´eception du client . . . 141 B.1 Topologie du banc d’essai . . . 153 B.2 Mesure et estimation de la probabilit´e de perte pour un plp de -2,5 . . . 153 B.3 Mesure et estimation de la probabilit´e de perte pour un plp de -1,5 . . . 154 B.4 Mod`ele de mesure avec tiers . . . 155 B.5 Topologie de test pour la simulation du chemin cyclique . . . 156 B.6 Topologie de test pour la simulation de la mesure du d´elai de transmission . . 156 B.7 D´elais de transmission aller et retour calcul´es pour des paquets G.711 . . . 157 B.8 Calcul du PSNR pour trois types de vid´eo avec une perte de trame unique . . 159 B.9 Comparaison des m´ethodes propos´ees et g´eom´etriques pour l’estimation
du PSNR . . . 160 B.10 Comparaison des m´ethodes propos´ees et g´eom´etriques pour l’estimation
du PSNR . . . 160 B.11 PSNR moyen pour diff´erentes positions de perte par rapport `a la trame intra
pr´ec´edente . . . 162 B.12 Mod`ele de perte de paquet . . . 163 B.13 Mod`ele de transmission en rafale en environnement bruit´e . . . 163 B.14 D´ebit pour diff´erentes valeurs de QP pour formats QCIF, CIF, VGA . . . 164 B.15 D´ebit contre taux de trame pour diff´erentes valeurs de QP . . . 165 B.16 MOS contre d´ebit pour diff´erents taux de trame . . . 166
Liste des Tables
2.1 Caract´eristiques des codecs voix. . . 34 3.1 Synopsis sur l’estimation de la probabilit´e de perte pour diff´erents
estimateurs - plp vaut 2,5. . . 57 3.2 Synopsis sur l’estimation de la probabilit´e de perte pour diff´erents
estimateurs - plp vaut 1,5. . . 57 4.1 R´esultats des simulations pour le chemin de A `a B . . . 80 5.1 Valeurs propos´ees pour α pour 3 types de vid´eo avec d´ebits diff´erents. . . 91 5.2 Valeurs propos´ees pour β pour 3 types de vid´eo pour une
distance temporelle entre trame examin´ee et trame perdue (cM∗ < n). . . 91 5.3 Erreur moyenne du PSNR (dB) pour la perte d’une trame P, selon les
mod`eles propos´e et g´eom´etrique. . . 93 5.4 PSNR et probabilit´es moyennes pour diff´erentes tailles de rafale, pour
des sch´emas de communication uniforme et en rafale, avec une p´eriode de
bruit de 80ms chaque seconde. . . 100 6.1 Valeurs pour le MOS et l’intervalle de confiance de 95% pour diff´erents
clips vid´eo. . . 114 6.2 R´esultats d´etaill´es de la simulation pour ´evaluer l’effet de protection
LIST OF ACRONYMS xxiii
List of Acronyms
ACELP Algebraic Code-Excited Linear Prediction
ACR Absolute Category Rating
ADSL Asymmetric Digital Subscriber Line
AIMD Additive Increase and Multiplicative Decrease API Application Programming Interface
ATM Asynchronous Transfer Mode
AVC Advanced Video Coding
AVI Audio Video Interleave
CCI Call Clarity Index
CELP Code-Excited Linear Prediction
C.I Confidence Interval
CIF Common Intermediate Format
CLT Central Limit Theorem
DCCP Datagram Congestion Control Protocol
DCR Degradation Category Rating
DMOS Degradation Mean Opinion Score
DSCQS Double Stimulus Continuous Quality Scale DSCS Double Stimulus Comparison Scale
DSIS Double Stimulus Impairment Scale
DVC Distributed Video Codin
EM ElectroMagnetic waves
FEC Forward Error Correction
FEPI Frame Error Propagation Index
FIFO First In First Out
LIST OF ACRONYMS xxiv
GAP Good, Acceptable or Poor
GOP Group Of Pictures
GPS Global Positioning System
GUI Graphical User Interface
HMM Hidden Markov Model
IEEE Institute of Electrical and Electronics Engineers
IP Internet Protocol
IPTV IP Television
ISI International Standardized Index
ITU International Telecommunication Union
JND Just Noticeable Difference
LAN Local Area Network
LDT Large Deviation Theory
LSE Least Square Error
MAD Mean of Absolute Difference
ME Mouth-to-Ear
MMRP Markov Modulated Rate Processes
MNRU Modulated Noise Reference Unit
MOS Mean Opinion Score
MPEG Moving Picture Experts Group
MP-MLQ Multi-Pulse Maximum Likelihood Quantization
MSE Mean Squared Error
NGN Next Generation Network
NR No Reference
NTP Network Time Protocol
LIST OF ACRONYMS xxv PAMS Perceptual Analysis Measurement System
PC Pair Comparison
PCM Pulse Code Modulation
PER Packet Error Rate
PESQ Perceptual Evaluation Speech Quality
PLC Packet Loss Concealment
PLP Packet Loss Probability
PLR Packet Loss Ratio
PTT Post, Telegraph, and Telephone
PQR Picture Quality Rating
PSNR Peak Signal to Noise Ratio
PSQM Perceptual Speech Quality Measure PSTN Public Switched Telephone Networks QCIF Quarter Common Intermediate Format
QoE Quality of Experience
QoS Quality of Service
QP Quantization Parameter
RAP Rate Adaptation Protocol
RTP Real-Time Transport Protocol
RTCP Real-time Transport Control Protocol
RR Reduced Reference
RTT Round Trip Time
SAD Sum of Absolute Difference
SAT Service Attribute Test
SLA Service Level Agreement
LIST OF ACRONYMS xxvi SSIM Structural Similarity Index Metric
STP Set-Top Box
SVC Scalable Video Coding
SVM Support Vector Machine
TCP Transmission Control Protocol
TCPF TCP Friendly
TEAR TCP Emulation At Receiver
TFRC TCP Friendly Rate Control
TFWC TCP-Friendly Window-based Congestion Control
UDP User Datagram Protocol
UTC Universal Time Coordinate
VGA Video Graphics Array
VoIP Voice over IP
VQEG Video Quality Expert Group
VTP Video Transport Protocol
VVoTP Voice and Video over IP
VQM Video Quality Models
WAN Wide Area Network
Chapter 1
Introduction
1.1
Overview
In telecommunications, performance is assessed in terms of quality of service (QoS). It is measured either in terms of technology (e.g., for ATM, cell loss, variation, etc.) [1] or at some protocol level (e.g., packet loss, delay, jitter, etc.) [2]. In the days of application-dedicated networks or when inter-networking was the service, such measures were suf-ficient to characterize quality and the potential negative impact on the service, or alter-natively, they were useful as parameters for Service-Level Agreements (SLA) between service providers and users. Today, increased access to broadband networks has led to a fast-growing demand for Voice and Video over IP (VVoIP) applications such as Internet telephony (VoIP), video conferencing, and IP television (IPTV). While the evaluation of Video (or Speech) communication systems has been an important field for both academia and industry for decades, the introduction of VVoIP systems has created a new set of issues that require new evaluation methods. Moreover, since we have moved to a unique network for multiple services, it has appeared that traditional QoS measures do not tell a sufficient story and the focus has moved to Quality of Experience (QoE). QoE is the overall
perfor-mance of a system from the point of view of the users. In other words, QoE is a measure of end-to-end performance at the service level from the user perspective and an indication of how well the system meets the user’s needs [3]. When users talk about quality, they are trying to describe their reaction to, or satisfaction with one or several of these service attributes, according to the nature of the application:
• Connection quality; • Connection usability; • Connection security;
• Connection or disconnection reliability; • ... .
Therefore, although QoE is quite subjective in nature, it is very important that a strategy be devised to measure it as realistically as possible. The ability to measure QoE will give the service provider some sense of the contribution of the network’s performance to the overall level of customer satisfaction in terms of reliability, availability, scalability, speed, accuracy and efficiency. As a consequence, even if a service infrastructure has been prop-erly engineered, we must measure QoE delivered, which is fraught with many practical challenges. Information coding is often a quality reducing process per-se, and hence the quality transmitted to the user is not optimal, independently of any transmission mishap. What is lost, corrupted or otherwise delayed also has an impact on quality, as not all parts of the information are considered equal. For unidirectional real time transfer (e.g., video streaming), information loss and coding are the dominant factors, but for bidirectional on-line communications (e.g., conversation over the internet or video conference) other pa-rameters such as delay and jitter (variation in delay) can be as important as coding and loss [3].
The exponential growth of multimedia applications over the Internet and the importance of the QoE to measure the performance of multimedia services motivated the set up of this research. In this chapter the research questions motivating this project are presented, followed by the research objectives and its main contributions. The rest of this chapter is organized as follows: the motivations of this research are presented in Section 1.2. Section 1.3 introduces the research aims and objectives. The main contributions of this research are summarized in Section 1.4. Section 1.5 briefly describes the outline of the thesis.
1.2
Motivation
QoE is not a new concept by any means. It has long been established in telephony where it was important to measure user satisfaction with the service, and this was done with sub-jective experiences with a large number of users, and set in terms of a Mean Opinion Score (MOS) of quality, from poor to excellent. However, subjective quality measurement tech-niques cannot be used in large-scale experiments due to their large overhead, the high cost of listening experts, and their unrepeatable nature [4, 5]. Furthermore, for pro-active trou-bleshooting of VVoIP performance bottlenecks that manifest themselves as performance impairments such as video frame freezing and voice dropouts, network operators cannot rely on actual end-users to report their subjective perceptual quality. Hence, automated and objective techniques that provide real-time or online VVoIP perceptual quality estimates are vital [5].
QoE combines non-technical parameters such as user perception, experience and ex-pectation with technical parameters such as application- and network-level QoS. From the user’s point of view, the QoE-technical part for multimedia transmission over the Internet can be summarized in a QoE value chain which comprises the following [6]:
multime-dia preparation, etc.
• Network and service providers, network impairments, etc. • User devices, playback applications, etc.
In order to manage the user-perceived quality, it is vital to understand the quantitative relationship between QoE and all these technical parameters in the QoE value chain.
The relationship between QoS (application and network) and QoE helps network and service providers to manage QoS parameters and service provisioning efficiently and effec-tively in order to provide a better QoE to users in a cost-effective, competitive, and efficient manner. The first step in this process is to measure the end user’s satisfaction level of the service quality, while the application and network QoS parameters are being monitored and measured. Contemporary perceived quality measurement techniques are divided into subjective and objective measurements [4]. Subjective evaluation techniques using human users to rate the video, audio, or data quality can provide the most accurate assessment of output quality from the perspective of a service provider’s customers. However, due to their disadvantages already mentioned at the outset of this Section, objective tests for predicting end user perception should be preferred, as more practical [4, 5, 7]. Typically, objective assessment of perceptual quality requires comparison of source and destination informa-tion [2, 3, 8]. Predicting quality would require knowing the informainforma-tion source as well as the effects which network propagation may have on the data. For example, the majority of models and systems which exist for estimating video quality in packet networks typically require detailed knowledge of video content and features, and often rely on deep inspection of video packets [7, 9]. These techniques can be called offline techniques because (a) they require time and spatial alignment of the original and reconstructed information, which is time consuming to perform, and (b) (for video transmission) they are computationally in-tensive due to their per-pixel processing of the video sequences. Another set of objective tests, called Indirectly Objective Tests, use measurements of network impairments (loss,
delay, jitter, duration of the defect) to estimate the impact on quality (video or audio) and could be performed online. These techniques can be applied where there is an established relationship between QoE and QoS [3].
All in all, we can conclude that QoS and QoE are two interdependent concepts in the modern multimedia transmissions over IP networks and hence, they should be studied and managed with a common understanding, from planning to implementation and engineering (optimization). Moreover, although the QoS research field has been extensively studied, measuring network impairments for enhancing the QoE is nevertheless an open research area. For instance, in our observations, earlier research on measuring and modelling the packet loss would generally either increase the burden of probe packets’ bit rate to the available bandwidth [10–12] or not provide real time information [13–15]. Although these studies are undoubtedly useful to understand the general loss characteristics, they cannot be used in real time performance estimation and consequently online control systems. To cope with the shortcomings of the aforementioned methods, many researchers have tried to link the input process to the probability of loss at intermediate nodes [16–22]. However their proposed methods have their own disadvantages such as computational complexity and inaccuracy. In the case of delay, halving the Round Trip Time (RTT) is the most com-mon and simplest method to estimate the OWD. However, in the Internet, sending and receiving paths between two end users which are usually far from each other are most often not symmetric. Moreover, most popular access technologies are intrinsically asym-metric [23–25]. Therefore, deriving the OWD from the RTT cannot lead to an accurate measurement. Synchronization of two end nodes which are connected to the Internet net-work independently is another method for measuring the OWD by reading the time-stamp section in IP/RTP/UDP packet. Network Time Protocol (NTP) [26], Global Position Sys-tem [27], and the IEEE 1588 standard [28] are among synchronization techniques used in special cases [29]. All of these solutions are not fully applicable or ubiquitous in Internet networks [30, 31], or do not resolve the issue of asymmetry. Therefore, the investigation
of how to increase the accuracy of online measurement or estimation of QoS parameters is under consideration in this thesis.
The effects of QoS parameters on QoE have been studied from different perspectives which are reviewed in Chapter 2. For instance, the effects of bit/packet/frame loss and the length of loss on the video quality have been discussed in [32–37] and various loss-quality models have been proposed. However, existing models have not taken into account all as-pects of loss effects on perceived video quality. For example, the results of those which model the impact of error propagation due to a frame loss on perceived quality of transmit-ted compressed video do not have an acceptable correlation with experimental results for all content dynamics. Our research investigates this issue and specifically focuses on the effect of frame loss position on videos with different content dynamics.
QoE measurement techniques may have multiple use. They can be used in network de-sign or in choosing suitable (e.g., voice) codecs to try to meet minimal quality requirements. Similarly in case of streaming video (e.g., TV) service, QoE measurement techniques can help to determine how well the network supports delivering a specific level of quality. They can also be used for monitoring purposes, either in the context of a Service-Level Agree-ments (SLA) or simply for quality assessment. Finally, they can be exploited in an adaptive way to protect quality for a service.
Video streaming is currently commonly employed over the Internet, and it is also expected that video chatting will be one of the key business areas for mobile services through wireless communications (e.g., 3G and 4G). To meet customer expectations, ser-vice providers should know the level of quality which is deemed acceptable by customers. Based on this information, service providers need to manage and control resources effi-ciently. However, managing and deploying more resources not only increases costs but also sometimes is not possible (e.g., in mobile environment, the bandwidth cannot be more than a certain level). Therefore, it seems that designing intelligent applications, which can dynamically adapt themselves with existing networks by managing the video system (e.g.,
bit rate) without adverse effect on end-users’ perceived quality, has become an overwhelm-ingly important issue. In other words, QoE management by video applications is meant to lead to more efficient and economic deployment of network resources while keeping the end user’s satisfaction at an acceptable level. Moreover, since the close cooperation of servers/applications with service providers is not usually feasible, there is a need to develop new multimedia applications which can adapt themselves to the existing network environ-ment and the best effort and competitive nature of the Internet to deliver the best perceptual quality to the end-users. To make a contribution to this subject, we have investigated how video parameters affect the video bit rate and video quality. Contrary to previous stud-ies [38–42], ours specifically addresses the video streaming applications which transmit QCIF-, CIF-, and VGA-size and medium motion videos coded with H.264 (the most per-vasively used video type in video conferencing applications) over the limited bandwidth networks and the perceptual quality is assessed through subjective tests.
1.3
Goals
The preexisting service quality measurement and control methods in IP networks do not re-flect users’ service satisfaction. Thus, to enhance end-user’s perception of quality, we plan to design a system of interworking control between experienced quality, transmission QoS parameters, and application layer at server and client (e.g., video coding specifications). This control system is utilized in video streaming application to optimize the perceived video quality according to the network conditions and manage utilization of the available resources. Due to the scale of project, we consider only the scenarios where the QoS and QoE-monitored communications occur between a client and a server.
As the first step, we seek to investigate what factors affect multimedia quality perceived by end users, how these factors are measured or predicted, and how different explicit or implicit modes of information exchange (e.g., the RT(C)P protocol) can be used to detect
variations in the perceptual quality. In other words, we want to define the characteristics which should be monitored and measured, and then, we plan to find the correlation between the measured characteristics and users’ perception to figure out the role of each piece of information (network’s behaviour and characteristics) in experienced quality. In particular, our focus is to monitor and measure the packet loss and One Way Delay (OWD) as the QoS parameters which affect the QoE.
Due to the broad domain of QoS variations, tracking QoE fluctuations based on QoS parameters would be impossible or very complicated. Therefore, our objective is to explore the relationship between QoE and some specific QoS parameters (i.e., loss and bandwidth). Inasmuch as employing the Internet as a transmission infrastructure for videos is major re-search focus in industry and academia alike and plays an important role in Next Generation Networks (NGN), we concentrate first on determination of perceptual quality as a function of loss pattern for video services such as Video Conference services. Hence, we intend to investigate how the loss pattern affects video quality and more explicitly, if the position of packet/frame loss is important. By answering this question, we propose a video quality model based on frame loss position for different video types. Based on our investigation on the effect of different loss patterns on video quality, we intend to figure out how it is possible for the end users’ applications to minimize the quality degradation.
Since the video bit rate varies because of different video characteristics such as frame rate, resolution, compression level, content, etc., a similar network situation may cause end users to perceive a different level of quality for different videos. To investigate the effect of these video characteristics on the end-users’ perceived quality some studies have been conducted recently. ITU-T Recommendation G.1070 has modelled the perceived video quality as a function of bit rate, frame rate, and packet loss [43]. Tao Liu et al. in [44] have also investigated the effect of bit rate, frame rate, and packet loss on perceived video quality and have extended the perceptual quality estimation method, introduced by ITU-T Rec. G.1070, to a real-time video quality monitoring. Thomas Zinner et al. in [38] have
conducted a measurement study and quantified the effect of 1) video frame rate, 2) scaling method, 3) video resolution, and 4) video content types on the perceived quality by means of the Structural Similarity Index Metric (SSIM) and Video Quality Metric (VQM) full-reference metrics. Objective tests have been used in their study to determine the level of perceptual quality. Furthermore, they have focused on high resolution videos. In [39], Y. Pitrey et al. have evaluated the performance of two AVC and SVC standards for coding the video data in different situations by conducting the subjective video quality tests. McCarthy et al. in [40] have compared the importance of frame rate and quantization (i.e., video quality due to data compression) in the case of watching high motion videos such as a football game in CIF and QCIF sizes. Since the medium motion and lower resolution videos (e.g., videos produced by video conferencing applications) are used widely over the Internet and cellular networks, our research focus is on this type of video.
Considering the mentioned studies, this research intends to accurately answer two main questions: “what is the actual perceived video quality when the video parameters are changed to meet the bandwidth limitation?”; and “what are the best video parameters for a specific video bit rate given the subjective perceived quality by the end users?”. This thesis focuses on investigating the effect of different factors such as frame rate and quantization (QP) on video data bit rate and perceived video quality and, consequently, on controlling the QoE with video parameters according to the bandwidth limitations imposed by the net-work. As it was mentioned earlier, the investigation of different bandwidth measurement methods is one of our objectives. We then proceed to relate these measures to actions at the server which can keep their transmitted video’s perceptual quality within acceptable boundaries (performance assurance). Indeed, a control system, whose feedback is the net-work condition (e.g., estimated bandwidth), controls and adjusts the streaming bit rate by employing a combination of codec characteristics control mechanisms.
• QoE definition and investigation of its measurement methods;
• Investigation and improvement of packet loss probability estimation methods; • Investigation and improvement of One Way Delay (OWD) estimation methods; • Investigation of effects of packet/frame loss on multimedia/video quality according
to codec characteristics;
• Accurate (subjective) measurement of the perceived quality of videos with different codec characteristics (Quantization parameter and frame-rate).
• Investigation of different video bit rate-controlling mechanisms/models to manage the end user’s perceived quality;
1.4
Contributions
The prominent contributions of this research are as follows:
• After reviewing the existing packet loss probability (plp) online-estimation methods, we have proposed an accurate approximation for plp at an intermediate high speed node where a large number of sources are expected to be aggregated. In this method, based on Large Deviation Theory, estimation of the plp at the intermediate nodes is based on the input stochastic traffic process.
(The associated publications are [45, 46].)
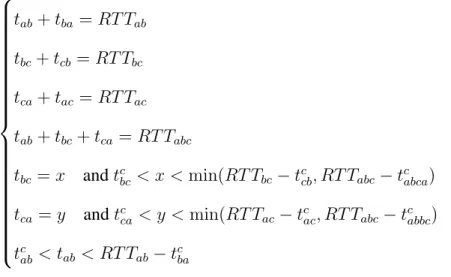
• Different One Way Delay (OWD) estimation/measurement methods have been in-vestigated. A straightforward method to accurately measure the transmission delay (i.e., a deterministic delay’s part) has been introduced. Considering the measured transmission delay, a couple of additional useful constraints to the set of equations
and variables employed in the cyclic-path method have been proposed to improve precision in predicting the OWD. It has been shown that all the proposed methods are free from clock skew awkwardness.
(The associated publication is [47].)
• This research addresses the question of whether or not a specific lost packet/frame, and in particular, its position relative to the I-frames, influences the quality of trans-mitted compressed video. Using the average Peak Signal to Noise Ratio (PSNR) of the received coded video to measure the amount of distortion, we investigate the effect of frame loss position relative to the I-frames on the total distortion for the videos. Based on our empirical results we have proposed a model to estimate the PSNR of the received frames impaired by distortion propagation. Furthermore, af-ter investigating the probability of different burst loss lengths in noisy environments where the duration of data loss is almost constant, we propose a method for im-proving the performance of video streaming over noisy channels based on packet scheduling, without an increase in the bit rate.
(The associated publications are [48, 49].)
• To reach our last objective, extensive measurement studies for investigating the effect of different control parameters (i.e., frame rate and QP) on bit rates limited by net-work bandwidth have been conducted. We have used the results of subjective tests, conducted for measuring the end-users’ perceived video quality, to find the optimum video parameters based on the given network bandwidth and acceptable perceptual quality level; and finally, we propose a video perceptual quality control algorithm based on the mentioned measurements.
1.5
Document outline
This thesis is laid out as follows. Chapter 2 provides a comprehensive definition of QoE and some background information on its measurement methods. Section 2.2 describes the concept of two perceptual quality measurement families: Subjective and Objective. In Section 2.3 network parameters and their effect on multimedia quality perceived by end user are described.
Chapter 3 discusses how to accurately estimate the packet loss probability at a high speed intermediate node in the Internet network in real time. This chapter continues in Section 3.2 by reviewing prior bodies of work on measuring or estimating the packet loss probability. In Section 3.4, we develop a new plp estimator. Section 3.5 and 3.6 present the simulations and their numerical results to demonstrate the effectiveness of our proposed estimator.
Chapter 4 summarizes the state of the art in One Way Delay measurement methods. Section 4.2 reviews prior bodies of work on measuring or estimating the OWD. In Sec-tion 4.3, the three-node model, the cyclic-path/LSE method, and our improvements are explained. In Section 4.4, a method for measuring the transmission delay between two end-nodes is introduced. Simulations and numeric results demonstrate the improvement of the proposed model relative to other models in Section 4.5. The level of accuracy of the proposed method to measure the transmission delay is also demonstrated in that section.
Chapter 5 presents a model to estimate the video quality degradation according to the frame loss position. Prior models for estimating the distortion produced by packet loss is reviewed in Section 5.2. In Section 5.3, we describe the effect of the position of lost frames relative to I-frames on the average P SN R and derive a model that estimates the total propagated distortion. The accuracy of model estimations is demonstrated via simulations in Section 5.4. The effect of packet transmission scheduling on noisy channel performance is examined in Section 5.5.
Chapter 6 states the relation of the video coding parameters and perceived video qual-ity. Section 6.2 introduces different congestion control methods in real-time multimedia transmission as well as recent studies regarding the effect of video parameters on the per-ceived quality. Section 6.3 presents the coding results for different video parameters. The details of subjective video quality measurement tests and their outcomes are presented in Section 6.4 and 6.5. In Section 6.6 our perceptual quality control algorithm is proposed. Simulations and numeric results demonstrate the effectiveness of the proposed algorithm relative to others in Section 6.7.
Finally, we present the conclusions of our work and suggest directions for future re-search in Chapter 7.
Chapter 2
QoE Definition and its Measurement
Methods
Throughout the world, more and more people are choosing the Internet as the infrastructure for communicating with others, conducting their business, listening to a music, or watching video content. Therefore, interest in Quality of Experience (QoE) has spiked over the few last years in industry and academia. In spite of the network used for access, type of device, content listened to or viewed, everybody has some basic expectation about his/her requested service. Depending on different factors such as the type of device being used for connecting to the networks, type of content being requested, amount of money spent for the service, etc., the level of expectation varies among the users. It is the service providers’ job to fulfill the users’ expectations, hence the large number of research efforts have been undertaken on QoE. Still, QoE remains an elusive notion, intrinsically because of its subjective nature. The structure of this chapter is as follows: Section 2.1 presents perspectives on QoE from the literature. Section 2.2 describes the concept of two perceptual quality measure-ment families: Subjective and Objective. In Section 2.3 network parameters and their effect on multimedia quality perceived by end user are described. Section 2.4 concludes
the chapter.
2.1
QoE Definition
The most commonly used definition of the QoE is probably the one given by the ITU-T SG12 [52], which defines QoE as:
“The overall acceptability of an application or service, as perceived subjectively by the end user.”
Although this definition is not wrong, it is not complete and does not consider all aspect of the QoE. A better definition of the QoE which has been produced in 2009 Dagstuhl Seminar [53] states the QoE as:
“The degree of delight of the user of a service, influenced by content, network, device, application, user expectations and goals, and context of use.”
This definition is more general and better than the ITU-T SG 12’s one, but it is not com-prehensive enough to provide a meaningful insight into all features such as the temporal aspects of the QoE and the utility-related aspects of the experience. Since the most recently research on QoE have focused on multimedia applications and services, most QoE defini-tions explain the QoE from an Audio or Video users’ point of view. Although the focus of this research is on multimedia and specifically on Video, it is worthwhile to introduce an encyclopedic definition of the QoE. A good example of a high-level QoE definition has been stated by Varela [54] as:
“The user’s subjective assessment, be it qualitative or quantitative, of the degree of fulfillment of his or her expectations with respect to the utility and/or enjoyment derived from the use of a certain service or application, over a given period of time, for well-defined usage intent and context, and considering the user’s own psychological and
socioe-conomic context.”
This generic definition of QoE can be used as a template which can then be specialized to specific fields, user profiles, societal contexts, etc.
Due to the large variety of disciplines encompassed by the notion of QoE, it is not possible to cover all its aspects in a single research, nor to reveal it through a unique test. In our research, we have only focused on what an ordinary user sees or hears; the quality level of a specific video clip or audio in a relatively controlled environment. Therefore, only technical aspects which influence the experienced quality are considered and the other non-technical issues surrounding QoE (e.g., socio-economic context of the users) will remain for future study. Thereby in this dissertation, the QoE term will be used interchangeably with perceptual quality. Although this perceptual quality cannot properly be defined, it can be measured. The perceptual quality in question is dependent on a few factors such as network QoS parameters and video coding specifications which are quite well understood. For pro-active troubleshooting of multimedia application performance bottlenecks that manifest to end-users as performance impairments such as video frame freezing and voice dropouts, service providers and network operators first monitor and measure the quality of service that the end-users encounter [5]. In other words, to indicate how well the system meets the user’s needs we should measure the end-to-end performance at the service level from the user’s perspective [3]. To measure the perceived quality of multimedia different methods which are discussed in the rest of this chapter, are proposed by researchers.
2.2
Multimedia Quality Measurement
Multimedia quality can be measured or estimated either subjectively or objectively. Sub-jective quality measurement methods, as implied by their name, are carried out by human subjects to assess the overall perceived media quality. They are the most reliable method of measuring the quality. However, the subjective methods are time and labor consuming and
expensive. Thus, objective assessment methods which produce the results comparable with those of subjective methods, are needed. In objective tests, assessing the perceptual quality can be made by intrusive or non-intrusive measurement. The source data is required by intrusive measurements, whereas non-intrusive methods do not need to access the video or audio original data.
2.2.1
Subjective Perceived Quality Measurement
Subjective multimedia quality measurement tests are basically laboratory experiences in which subjects are exposed to the media samples and asked to rate the samples’ quality. There are different types of subjective test depending on what quality aspects is evaluated or what kind of application is assessed. The subjective assessment is classified in two main categories: qualitative assessment and quantitative assessment.
The qualitative methods attempt to describe the end users’ perception of quality and the motivation behind users’ decisions made during interaction [55–57]. The results of qualitative methods do not necessarily translate well into numeric scales. The qualitative methods are usually more suited to the sociologic aspects, for instance, when the goal is to evaluate the price of a multimedia service or to know how different people react to variation of the perceived quality. On the other hand, quantitative methods focus on the technical aspects of quality and they are used and studied more widely in literature than qualitative ones. The main idea behind this type of assessments is to ask a group to rate the media samples according to the specific scale. The Mean Opinion Score (MOS) is the most frequently used score which presents the results of these tests and it summarizes the group’s assessment of the perceived quality.
There exist several protocols to perform the subjective assessments of the quality of multimedia. The most frequently used ones are those recommended in ITU standards such as ITU-T Rec. P.910 [58] and ITU-R BT.500-10 [59] for video, ITU-T P.800 [60] for voice,
and ITU-T P.920 [61] for interactive multimedia.
Depending on the purpose of the assessment, several procedures are proposed in these standards. In most widely used protocols, the performance of the system under test is rated directly (absolute category rating, ACR) or relative to the subjective quality of a reference system (degradation category rating, DCR) [62].
The following opinion scales, which are the most widely used by ITU-T, can be utilized in an ACR: excellent, good, fair, poor, and bad or 5, 4, 3, 2, and 1 [2, 62]. The arithmetic mean of all the collected opinion scores (among participants in a test) is the MOS.
To measure the degradation caused by some encoding or transmission scheme, the DCR is more appropriate. In a DCR test, assessors are asked to rate the perceived degradation of the video or voice sample with respect to a high quality reference clip; the subjects are instructed to rate the conditions according to this five-point degradation category scale: degradation is imperceptable (5), perceptible but not annoying (4), slightly annoying (3), annoying(2), or very annoying (1). The mean value of the results is called the Degradation Mean Opinion Score (DMOS) [63].
Subjective Perceived Voice Quality Assessment
In VoIP the most widely used subjective quality assessment methodology is opinion rating, which is defined in ITU-T Recommendation P.800 [64]. The performance of the system under test is rated directly (ACR) or relative to the subjective quality of a reference system (DCR) [62].
In a DCR test for voice quality, the subjects are asked to rate the conditions according to this five-point degradation category scale: inaudible (5), audible but not annoying (4), slightly annoying(3), annoying (2), and very annoying (1).
Any subjective test is constructed under a subjective test protocol. One of the most famous protocols is the Service Attribute Test (SAT). This test was developed by Satellite
Business Systems in the early 1980s [2].
The challenge of the evaluation of the MOS is to make it experiment-independent to erase differences in testing date/tester and the mix of quality levels in the experiment. Therefore, ITU-T Recommendation P.810 in 1984, proposed the opinion equivalent-Q method, in which the Modulated Noise Reference Unit (MNRU) is used. MNRU is a reference system that outputs a speech signal and speech-amplitude-correlated noise with a flat spectrum. The ratio of signal to speech correlated noise in dB is called the Q value. This condition helps subjective experiments be reproducible [62].
Note that the above mentioned methods are appropriate for assessing voice quality in one-way speech communications (one speaker, multiple listeners), and not for two-way interactive speech communications.
Kiatawaki et al. in [65], conducted conversational experiments by having two parties and using an adjustable delay speech system. They studied the effect of delay on conversa-tional experience but they did not consider packet loss and variations in delay (jitter).
ITU P.805 describes a subjective test for evaluating M OSCQSscore of a conversational
quality [66]. This method requires asking two subjects to participate in the conversation over a communication system to complete a specific task. They are asked to rate the quality of conversation using an ACR. The average of opinions of several users (test participants) defines the conversational quality of the system being tested.
Subjective Perceived Video Quality Assessment
For video, as with voice, subjective tests use human viewers to rate the video quality. Sub-jective tests are done either informally or using formal techniques. Informal assessment of video quality is often done by a service provider craftsperson on site and technical experts (golden eyes) in the video system head end or during commissioning [3]. Formal subjec-tive assessments use many highly qualified experiment participants who view various video
clips in tightly controlled environments and rate the quality. Generally TV subjective video picture quality tests are performed following the guidelines established in ITU-R Recom-mendation 500 (ITU-R, 2002) better known as Rec. 500 [3, 59]. Rec. 500 recommends detailed guidelines for standard viewing conditions, criteria for selection of subjects and video test sequences, assessment procedures and methods for analyzing the collected video quality scores.
The most known and frequently used methods in this standard are:
• Double Stimulus Continuous Quality Scale (DSCQS): With DSCQS, viewers are shown pairs of video sequences (the impaired sequence and the reference sequence) randomly. Viewers watch each pair twice. After the second watching, viewers are instructed to rate the quality of each sequence in the pair. The difference between two scores is used to quantify changes in quality [59]. The DSCQS is widely accepted as an accurate test method which has a low sensitivity to context effects (see Appendix 3 in [59]).
• Single Stimulus Continuous Quality Evaluation (SSCQE): The SSCQE allows view-ers to dynamically rate the quality of an arbitrarily long video sequence, using a slider mechanism with an associated quality scale (e.g., from bad to excellent which is equivalent to a numerical scale from 0 to 100). The SSCQE method is more use-ful for evaluating real-time quality monitoring systems. Proponents of the SSCQE methodology claim that it can be used to assess long video sequences with time-varying quality, whereas DSCQS cannot [59].
• Double Stimulus Comparison Scale (DSCS): In DSCS, viewers are shown a pair of video sequences. Like the DSCQS method, the pair of video sequences are watched randomly, but unlike DSCQS, the pair is shown once instead of twice. In DSCS, the assessors directly rate the difference between the first and second video sequence
on a discrete seven point scale (as opposed to DSCQS where two video sequences are rated separately on a continuous quality scale). The viewers indicate whether the video quality of the second clip was much better, better, slightly better, the same, slightly worse, worse, or much worse than the first clip.
All these methods are mainly intended for television signals and are well described in ITU-T Recommendation T.500.11 [59]. The modified versions of these methods for as-sessing the video clips’ quality has been proposed by ITU-T Recommendation P.910 [58] and Video Quality Expert Group (VQEG) [67] which are listed below:
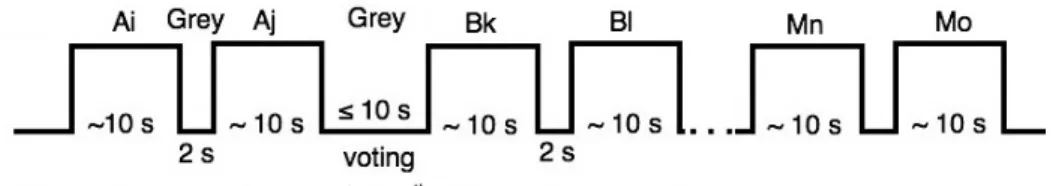
• Single stimulus-ACR: In the ACR method, the video sequences are presented one at a time and are rated by assessors independently on a category scale. The ACR method is also called Single Stimulus Method. Figure 2.1 illustrate the time pattern for the stimulus presentation.The presentation time may vary according to the content of the test material. The voting time is equal or less than 10 s. The five level scale from Bad to Excellent is used for rating the overall quality in ACR method. A nine or eleven-level scale may be used when the higher discriminative power is required (Annex B in [58]). Hidden reference removal method is provided by VQEG [67] to utilize the ACR method. In this method the reference video is also viewed by subjects who are not aware of watching the original video along with the other test videos. The reference video rating scores are withdrawn from the results of the corresponding test. It helps us to insure the subject’s rating accuracy.
• Double Stimulus Impairment Scale (DSIS)-DCR: In the DCR method, the video sequences are presented in pairs; the reference video is always presented as the first stimulus in each pair, while the second stimulus is the degraded video. The DCR method is also called double stimulus impairment scale method. The time pattern for the stimulus presentation and voting is illustrated in Fig. 2.2. The five level
Figure 2.1: Stimulus presentation and voting time in the ACR method.
Figure 2.2: Stimulus presentation and voting time in the DCR method.
scale from Imperceptible to Very annoying is used for rating the degradation in DCR method.
• Pair Comparison method (PC): In the PC method, the video sequences are presented in pairs; the first and second stimulus are the same sequence which is passed through two different systems under test. Viewers are asked to make a judgment on which element in a pair is preferred in the context of the test scenario. The time pattern for the stimulus presentation and voting in PC method is illustrated in Fig. 2.3.
To insure the subject’s rating accuracy, the subjective tests designed for our research were based on Single Stimulus Hidden Reference Removal which is described in detail in 6.4.
Figure 2.3: Stimulus presentation and voting time in the PC method.
2.2.2
Objective Perceived Quality Measurement
Subjective tests have been used for a long time, yet they are still quite useful means of accu-rately gauging likely user perception of service quality. However, because of the necessary involvement of a relatively large number of test participants and the extensive sampling re-quirements, such tests tend to be labour-intensive and relatively expensive. Consequently, one of the major goals for developing test and evaluation methodologies for voice or video quality has been to achieve assessments of similar quality by means of analysis of data that can be acquired quickly and inexpensively via objective measurements.
Objective Perceived Video Quality Assessment
Picture quality assessment from the end-user point of view depends on many factors such as size and resolution, sharpness, contrast, color saturation, viewing distance, user environ-ment, naturalness, and distortion.
We can classify objective video quality measurement in four categories [3]: • based on models of human video perception
• based on video signal parameters
• based on the duration of the network impairment in the video signal
The Picture Quality Rating (PQR) method is based on human video perception [68]. The PQR value for a video field is a nonstandard video quality metric based on the JND-metrix human-vision algorithm [69], which accumulates Just Noticeable Difference (JND) values for image blocks of 32 pixels by 32 lines by 4 fields deep [68].
The Peak Signal to Noise Ratio (PSNR) method is the most famous method and is based on video signal parameters. PSNR estimates QoE by performing frame to frame peak signal-to-noise ratio comparisons of the original video sequence and reconstructed video sequence obtained from the sender-side and receiver-side, respectively. PSNR for a set of video signal frames is given by Equation (2.1) [3, 5, 70, 71].
P SN Rdb = 20 log10(
Vpeak
RM SE) (2.1)
where Vpeakis the maximum possible pixel value of the frame.
The recommended methods to obtain PSNR of a video signal are outlined in ANSI T1.801.03-1995 and the utility of this objective measurement of video quality is well-documented [3, 67, 68]. Because PSNR uses sender video data to compare received data to calculate and predict end-user perception, it is called Full Reference (FR) or intrusive mea-surement methods. To implement PQR and PSNR as FR meamea-surement methods, special software and hardware are required. PQA 300 is the system which is used for measuring PQR and PSNR [69]. This system needs both sender and receiver side video signals simul-taneously. Therefore, if sender and receiver are not located in one place, both video signals should be recorded and inserted into PQA 300 (or other systems) for achieving the PQR or PSNR results.
It is not always feasible to use Full Reference or even Reduced Reference (RR) methods since the reference may not be available. In addition, even the No Reference (NR) method would be prohibitively expensive to deploy widely for ongoing performance monitoring
when there are many independent video streams to monitor as each of the streams would require separate decoders. Hence designing and implementing other methods which are based on network impairment parameters for estimating quality is vital. Moreover, the net-work impairment-based methods are advantageous compared with above-mentioned ones due to their online applicability.
Venkataraman et al. in [72] have discussed the effect of network events such as losses, jitter, and delay on video quality. To study this correlation they have used the PSNR and Video Quality Model (VQM) methods to estimate the quality. They have shown that PSNR reacts sharply with a noticeable drop initially with increasing packet error rate (PER). At high PERs, PSNR is almost constant.
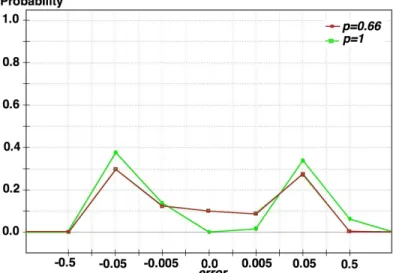
The behaviour of the VQM method for lower PERs is the same as PSNR but at higher PERs, much unlike PSNR, VQM continues to rise. Other studies confirm the behaviour of these methods in lower PERs too. For example, Boyce et al. in [73] have noticed that packet loss rates as low as 3% translated into frame error rates as high as 30% in MPEG video. They have shown that PSNR and VQM have similar behavior with delay. PSNR and VQM remain constant due to pure delay alone, decreasing marginally at high delay. High delay causes packet losses in the network. They have also shown that PSNR reacts strongly to values of jitter exceeding 0.05 s, dropping rapidly but VQM can tolerate jitter levels of around 0.06 s.
In most recent studies for estimating the end-user perceived quality, researchers have tried to focus on one or two network impairment parameters. Reibman et al. in [9] have estimated video QoE by processing bitstreams and they have shown the impact of packet losses. They have presented three methods: FullParse (parsing all the packet’s bits and the impact of packet losses on video quality), QuickParse (extracts only high-level information from the video bitstream and the impact of packet losses on video quality) and finally NoParse (which rely only on the number of packet losses and the average bit-rate). They have concluded that there is a trade-off between simplicity and accuracy and they have
shown a correlation between the NoParse method’s results and reality greater than 70%. The NoParse method estimates the number of packet losses simply by counting the number of observed losses in the video bitstream. Thus, this method can be implemented at the end-user’s to estimate video quality online. Since this method utilizes bitstream, it can employ a simple software along with the receiver program.
Shu Tao et al. in [7] have developed a model to characterize the relationship between video distortion and packet loss. In general the loss-distortion model has been based on the impact of network losses on video quality as a function of application-specific parame-ters such as loss recovery technique, codec bit rate, video characteristic, packetization, etc. They have introduced a relative quality metric (rPSNR) that measures video quality against a quality benchmark that the network is expected to provide. This method estimates video quality without parsing or decoding the transmitted video bit stream and without knowl-edge of video characteristics. They have demonstrated the robustness and accuracy of the rPSNR-based method through several simulations and experiments. rPSNR can be com-puted solely based on parameters, some of which are predefined or determined according to the application configurations while others can be obtained through simple network mea-surements; therefore it can be categorized as an online video quality assessment method. rPSNR can be implemented by installing monitoring software in the client device.
Prasad Calyam et al. in [5] have introduced a framework that can provide online esti-mates of VVoIP QoE on the network path without requiring any video sequences nor end user involvement. They have estimated end-users’ perception of video and voice quality in term of Good, Acceptable or Poor (GAP) grades of perceptual quality solely from the on-line measured network parameters. To validate their framework, they have compared their result with the subjective test. This method needs to be trained. For training, a subjective test should be deployed. Prasad Calyam et al. in [74] have introduced a set of methods to reduce the number of test cases per human subject for providing rankings without compro-mising the ranking data required for adequate model coverage. Since subjective tests are
![Figure 2.4: Block diagram showing the operation of PSQM and similar algorithms, from [3].](https://thumb-eu.123doks.com/thumbv2/123doknet/5405924.126067/59.918.269.715.136.358/figure-block-diagram-showing-operation-psqm-similar-algorithms.webp)