HAL Id: halshs-01093252
https://halshs.archives-ouvertes.fr/halshs-01093252
Submitted on 10 Dec 2014HAL is a multi-disciplinary open access archive for the deposit and dissemination of sci-entific research documents, whether they are pub-lished or not. The documents may come from teaching and research institutions in France or abroad, or from public or private research centers.
L’archive ouverte pluridisciplinaire HAL, est destinée au dépôt et à la diffusion de documents scientifiques de niveau recherche, publiés ou non, émanant des établissements d’enseignement et de recherche français ou étrangers, des laboratoires publics ou privés.
knowledge infrastructure
Antoine Gourlay, Erwan Bocher, Gwendall Petit
To cite this version:
Antoine Gourlay, Erwan Bocher, Gwendall Petit. Towards a WPS platform dedicated to an urban knowledge infrastructure. Inspire Conference 2001, European Commission, Jun 2011, Edinburgh, United Kingdom. �halshs-01093252�
Antoine Gourlay, Erwan Bocher, Gwendall Petit
Atelier SIG, IRSTV, FR CNRS 2488, Ecole Centrale de Nantes, 1 rue de la Noë, BP 92101, 44321 Nantes Cedex 3
1. Introduction
The Institute for Research on Urban Sciences and Techniques (IRSTV) is a Research Federation founded by CNRS (French National Center for Scientific Research) and France’s Ministry of Research brings together fifteen research laboratories in order to lead an interdisciplinary research in the field of urban environment and especially in the development of knowledge, models, tools and methodologies for the management, the design, the decision-making and the evaluation of city planning policies. With this aim in view, the IRSTV gathers about two hundreds researchers, engineers and administrative staff.
The research federation structures projects within three main fields:
- Interdisciplinary urban observation system (urban remote detection)
- Integrated urban environment modeling (urban micro-climatology, environmental noise analysis, GIS and urban data modeling)
- Governance, design and sustainable management of cities.
This interdisciplinarity created a discrepancy in the various usages of geographic information: data storage and modeling, tools used to manage it and processing workflows used were very heterogeneous [1]–[5]. The diversity of GIS software, of data storage formats, of ways to describe the data lead to a compartmentalization of urban geographic knowledge, which was going against the purpose of the IRSTV: to develop an integrated view of all urban data, methods, tools and protagonists that contribute to sustainable city planning and management.
In order to resolve this paradox, and to strengthen the federative attitude within IRSTV, a Geographic Information System (GIS) for urban modeling and city planning was outlined in the regional project MEIGEVille (Integrated environment modeling and sustainable urban planning) [7]. The purpose of this
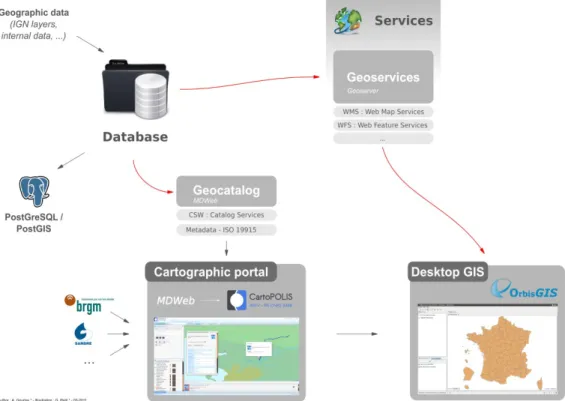
Figure 1 - IRSTV Spatial Data Infrastructure (SDI) and GIS
2 GIS was to lay out the bases for an urban knowledge gathering tool, analysis methods and management techniques [7].
A GIS team (“Atelier SIG”) is thus created in December 2006 to build and maintain two platforms:
- a Spatial Data Infrastructure (SDI)
- a community-based Geographic Information System (GIS)
Using several documents describing good practices for geographic data exchange [6][9][11], the Atelier SIG built an interoperable architecture consisting of (Erreur : source de la référence non trouvée) [1]–[3]:
- a data repository
- a server application providing geographic data services that use OGC standards (WMS, WFS, WCS…)
- a web portal for displaying, searching and browsing geographic data
- a GIS software called “OrbisGIS” for data displaying, querying, processing and sharing
The project presented in this paper aims at enforcing the INSPIRE Directive [9] on a local scale by extending the capabilities of this SDI in order to providing on-demand geospatial web processing using the WPS Standard. This would enhance the current uses of the SDI by pooling all the processes built by
3 IRSTV researchers and engineers – noise mapping, flooding modeling, atmospheric pollutant dispersion, etc. – and by creating a geospatial knowledge repository to study cities. These processes would then be accessible to the federation’s partners: local authorities, agencies, citizens, private organizations and companies.
This project is supported by three scientific research projects: the SOGVille project, and the two ANR projects VegDUD and EvalPDU.
2. The WPS Standard
The OGC Web Processing Services (WPS) Interface Standard [17] provides a standardized mechanism to invoke geospatial processing services as web services. It defines in detail how inputs and outputs are to be handled, as well as how clients can request the execution of a process.
The specification requires that Extensible Markup Language (XML) be used for all communication. XML documents are made up of elements that act as container for data. These elements can be nested and can be given attributes that describe them. The main benefit of XML is that it is readable by humans, which makes designing and debugging much easier.
A WPS service can expose any number of processes of any kind as web services. WPS defines three operations to communicate with a server:
- GetCapabilities return information on the WPS service, its capabilities and its available processes
- DescribeProcess returns a full description of a process, including inputs and output
- ExecuteProcess invokes a process and returns its output(s)
These actions are accessible through commonly used protocols such as HTTP GET and POST, as well as SOAP and WSDL.
From a user point of view, GetCapabilities gives access to the list of available processes. Then
DescribeProcess is called for those processes to retrieve their descriptions. For every process, a data structure is returned containing the process name, an optional description, a version number, the details about its inputs and outputs, and two other parameters:
- If data output(s) from the process can be requested to be stored by the WPS server as web-accessible resources
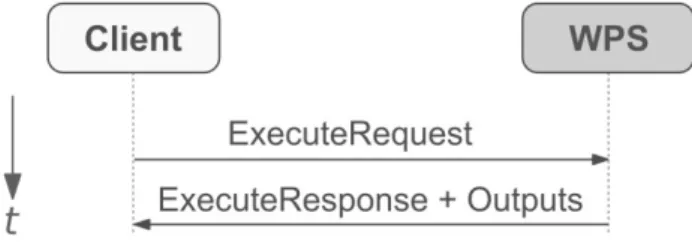
Figure 2 - ExecuteRequest with ouputs in the response
4 - If the Execute operation can return quickly and give an asynchronous status update while the operation is running
Inputs and outputs can be of three different types: - A complex data structure (e.g. a GML fragment). Lists of supported formats, encoding and schemas (for XML-based data) are provided for each process
- A simple literal value, directly embedded in the execute request. Possible values are also provided
- A Bounding Box value, i.e. an envelope defined in concordance with a Coordinate Reference System (CRS)
Once a software client has called DescribeProcess
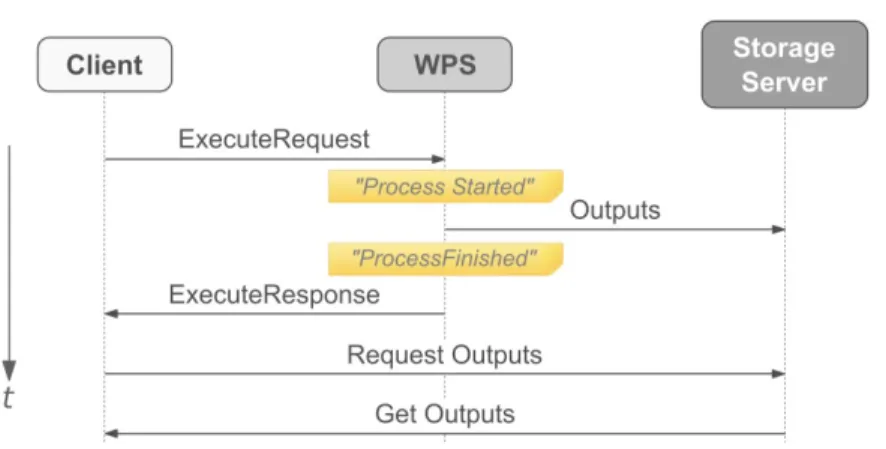
and has gathered from the user the necessary inputs to call the process, it can build the necessary parameters for ExecuteProcess. Normally, the response is returned only after process execution is completed. If the process succeeds, the response document contains either the outputs (Erreur : source de la référence non trouvée), or links to the outputs stored in web-accessible locations (Erreur : source de la référence
non trouvée). In the special case of a single complex output, the output can be returned directly instead of the XML response document.
Figure 3 – ExecuteResponse with outputs on a web-accessible server
5
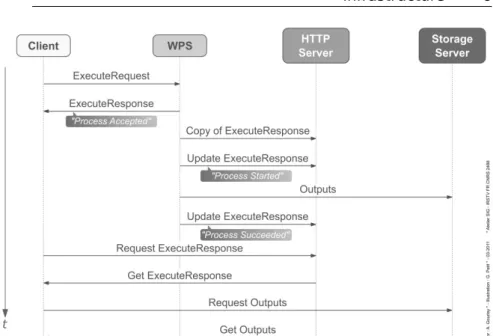
However, if instructed the server can return a URL from with the response can later be retrieved. This response document can be regularly updated to provide feedback to the caller through a process status (Erreur : source de la référence non trouvée).
The process status can be “ProcessAccepted”, indicating that it has be queued and will be processed; “ProcessStarted”, indicating that the process is currently running; “ProcessSucceeded”, signifying that the processing is over; or “ProcessFailed”, meaning that a problem occurred during the execution. In the latter case, an error code is also returned in the response document.
3. Existing tools supporting WPS
We distinguish two different categories of tools supporting the WPS Standard: web servers for data processing, and GIS desktop software & libraries that are consumers of such processes.
Figure 4 - ExecuteResponse with support for status report during execution
Figure 5 - gvSIG
Figure 6 - GRASS GIS
Figure 7 - OpenJUMP
6
A. Web Servers for data processing
These servers expose processing functionality that is usually found on desktop GIS software – for example data transformation, analysis or re-projection.
One implementation of the WPS Standard is 52°North WPS (52north.org), with native support for GRASS (grass.osgeo.org) and SEXTANTE (sextantegis.com). Another solution is part of degree 3 (wiki.degegree.org), an project for the Java platform. The PyWPS software (pywps.wald.intevation.org) also implements the WPS Standard, with native support for GRASS GIS. Finally, the ZOO Project (zoo-project.org) also provides an implementation.
All software platforms listed above provide a full WPS 1.0.0 compliant implementation, and most of them provide connectors for several other GIS like
Figure 8 - uDig in JGrass
7 GRASS GIS. See [19] and [20] for a detailed comparison.
B. GIS Desktop software & libraries
Few Desktop GIS provide native support for WPS, but plugins are available. The GIS gvSIG (gvsig.org), GRASS GIS (grass.osgeo.org), OpenJUMP (openjump.org) and uDig (udig.refractions.net) all support querying WPS processes via plugins (Figures 5-8). The libraries SEXTANTE (sextantegis.com) and OpenLayers (openlayers.org) can also use or display a WPS process result. See [19] and [20] for a detailed comparison.
4. Integration of the WPS standard into
IRSTV’s Spatial Data Infrastructure
A. IRSTV’s SDI
A Spatial Data Infrastructure (SDI) is a group of tools interconnected using international standards defined by the Open Geospatial Consortium (OGC). The SDI currently available at IRSTV consists of five modules (Erreur : source de la référence non trouvée):
- A spatial relational database management system (RDBMS) housing national geographic data (databases from the French National Mapping Institute (IGN)) as well as data produced by IRSTV (statistics, processed satellite images, simulation results…). Geographic data is described, structured and queried using the Simple Feature SQL norm [14].
- A server that exposes geo-services. This application makes geographic data available using the Web Map Services (WMS) [16] and Web Feature Services (WFS) norms [15].
- A geographic data catalog (Geocatalog). It contains geographic metadata using the norm ISO 19115, exposing information such as temporal and spatial extend of the data, its origin, etc.
- A cartographic website that enables users to query the geocatalog, as well as remote catalogs as long as they respect the OGC Catalogue Service (CSW) standard. Based on
Figure 9 - IRSTV's current Spatial Data Infrastructure
8 the CartoPOLIS and MDWeb platforms, it enables users to display geographic data and any associated metadata.
- A Geographic Information System (GIS) called “OrbisGIS”. Completely developed at IRSTV by the Atelier SIG, OrbisGIS has all the functionalities that make a GIS: data reading, writing and edition, map creation… It contains an abstraction layer called “Gdms” that encapsulate both alphanumeric and geographic data (geometric and raster) into a relational tabular view as would any Relational Database Management System such as PostgreSQL/PostGIS. This layer allows the use of standard SQL, with support for the Simple Feature SQL norm, as a querying language for advanced processing. Thus OrbisGIS is a user interface for this data management layer.
All the modules of the SDI are based on Open Source components and are themselves Open Source. This choice originated in the highly research-specific
needs of the federation, the desire to invest into people instead of software and the will to reuse and share with other actors faces with the same challenges. This is also in line with the public utility duties of a state research federation like IRSTV.
9 WPS aims at providing processes as on-demand web services. The point is to make it become the key to an SDI where:
- Processes can be pooled among a large user base, and their results cached and shared. - The content of a process is exactly the same
whether it runs in OrbisGIS or on a server as a WPS process.
- The procedure of submitting a script to become a WPS process is simple and does not requires any extra knowledge about WPS. This would add to IRSTV’s Spatial Data Infrastructure a new kind of web services: geo-processing services. The different research laboratories could then provide their specialized algorithms as a service, as well as the data they produce, within a coherent multidisciplinary urban knowledge platform (Erreur : source de la référence non trouvée).
Gdms – the data management engine used in OrbisGIS – uses standard SQL syntax [8] for its treatments, with support for OGC Spatial functions [14] and other functions provided by researchers for the specific needs of the federation. These additional functions cover fields from hydrography to triangulation. OrbisGIS can be used to both process and display data – inputs and results – at the same time (Erreur : source de la référence non trouvée).
Figure 10 - IRSTV's SDI with geoprocessing services
Figure 11 – OrbisGIS with data and a SQL Script
10
A user can describe a geometric operation, for example a buffer on a set of line, with a simple SQL
“CREATE TABLE AS” instruction. This will generate a new data file with the updated geometries.
Such a script should be able to run as a WPS service as long as some metadata about inputs and outputs is provided, as well as a name and a description.
The objective is to use the specific data management layer Gdms and its specialized functions
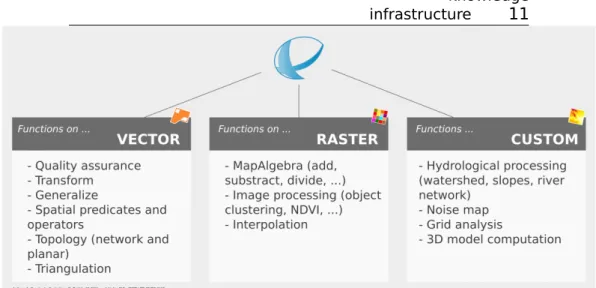
Figure 12 - Functions from OrbisGIS available for use in scripts on the WPS Server
11
to build a WPS-accessible processing server. This server would be able to reuse all processes currently working in OrbisGIS that are available within IRSTV, as well as enabling the creation of new scripts that reuse specific functions in fields like hydrology (Erreur : source de la référence non trouvée).
To that end, we designed a SQL descriptive meta-language that a user can supply to WPS-enable a script without altering its content. The metadata is present at the beginning of the script, enclosed in SQL comments so as not to change the behavior of the script.
A very simple script to filter only valid features from an input data set would look like this:
-- @script
-- @identifier FilterValidData -- @title Filter
-- @abstract Filters the content of a
-- spatial table to keep only valid geometries -- @/abstract
-- @input TABLE myTable ( the_geom GEOMETRY ) -- @output TABLE result
-- @/script
CREATE TABLE result AS SELECT * FROM myTable WHERE ST_IsValid(the_geom)
This script can run in OrbisGIS or in a spatial DBMS as long as the table “myTable” is present, and can run as a WPS service if a spatial table – whatever format it is in – is provided, as long as it has a geometry field, that will be called “the_geom” in the script – the default geometry name in OrbisGIS.
5. Implementation
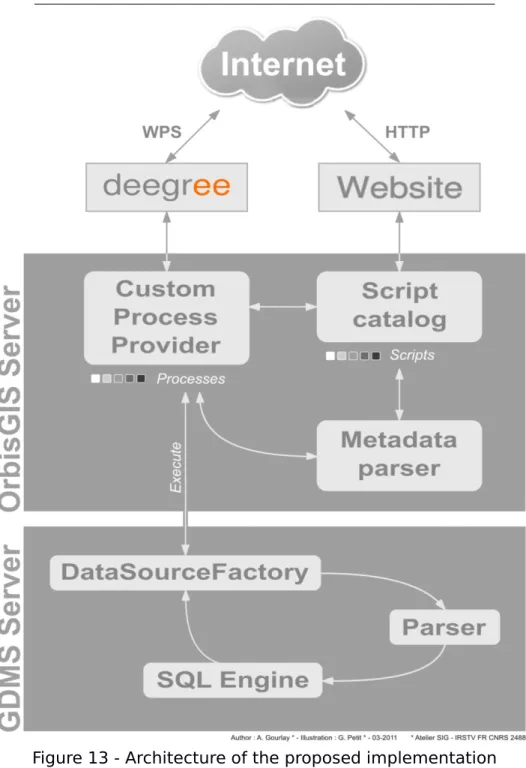
Figure 13 - Architecture of the proposed implementation
12
The inclusion of WPS in the SDI is implemented as a module-based architecture on an application server (Erreur : source de la référence non trouvée).
- The deegree 3 WPS frontend is used to handle client request. This particular implementation was chosen over 52° North for a couple of reasons:
o It only implements the WPS Standard: there is no dependency over Geotools or any other library that has duplicated functionalities with Gdms Server
13 - The OrbisGIS Server layer provides a custom Process Provider to deegree that looks into a script catalog. It also comes with a web frontend for submitting scripts. When a process is executed, it registers with Gdms Server the inputs as DataSource objects, asks for the script to be executed, and then retrieves the output DataSource objects. The Gdms Server layer is the one processing the actual script. It is a spatial federated database management system that runs on the Java Virtual Machine (JVM). The built-in SQL engine parses the script, performs any necessary query optimization and runs the instructions. It features a LL(*) combined lexer/parser built with ANTLR and a custom SQL grammar, a parallel query engine written in Scala, and a solid layer written in Java for data access, memory management, concurrency and transaction management.
When a GIS calls GetCapabilities, the following happens:
1. Deegree asks OrbisGIS Server the list of all available processes.
2. OrbisGIS Server queries its catalog and returns a list of script with some details.
3. Deegree sends the response, with the list of processes and its own WPS-specific data.
Then when a GIS calls DescribeProcess, the following happens:
1. Deegree asks OrbisGIS Server for a specific process.
2. OrbisGIS queries its catalog and returns the details for the script.
3. Deegree send the response, with the detailed information required by the WPS Standard. Finally when a GIS calls ExecuteProcess with a specific process, the following happens:
1. Deegree asks OrbisGIS Server for the process. 2. OrbisGIS Server finds the script in its catalog
and wraps it in a deegree Process. 3. Deegree starts the process.
4. The process gets all inputs and gives them to Gdms Server to be registered as DataSource
inputs for the current execution.
5. Gdms Server parses, optimizes and validates the script against the available DataSource. 6. Gdms Server runs the script.
14 7. OrbisGIS Server saves the DataSource
registered as outputs, discard the whole session (all other data or state is lost) and returns to deegree the outputs.
8. Deegree sends the response to the GIS.
This whole process relies on the meta-language being added by the user and interpreted by the server.
B. The meta-language
The meta-language is added by the client to the SQL script before sending, but is parsed and used at a different level:
- The SQL script is parsed in Gdms Server and executed by the built-in SQL engine.
- The meta-language is parsed in OrbisGIS Server for extracting metadata about the script, and is subsequently completely ignored.
The meta-language was design with a very simple syntax. It requires that:
- All lines have to start with two dashes (--) followed by a space
- A key-value pair is given inline as: -- @key some value
- Or with this syntax if is spans over multiple lines:
-- @key a long value that spans over -- multiple lines
-- @/key
- The whole metadata is a key-value pair whose key is named “script”:
-- @script -- @key value -- @key2 value2 -- ...
-- @/script
Expected key-value pairs are described in the following table:
Name Description Multiplicity
Identifi
er unambiguous name for the process One Title human readable process
title One
15 ct process, input and output
Versio
n Informativeinformation version Zero or one Input Describes an input, see
below
Zero, one or more
Output Describes an output, see below
Zero, one or more
Inputs can be formatted as follows: -- @input TYPE name params
The first value after “INPUT” is either TABLE, LITERAL, or BOUNDINGBOX, and specify the type of the input parameter.
- TABLE means this input should be a complex data structure. Gdms Server takes care of converting the received data to a table-like structure. The “params” item can be a SQL table definition that defines a contract for the input table.
For example, the following defines an input that contains geometry information:
-- @input TABLE myTable ( the_geom GEOMETRY ) OrbisGIS Server will check the input against that schema before running the content of the script.
- LITERAL means this input is a constant value provided by the caller. The value can be reference in the script directly using its name. -- ...
-- @input LITERAL buffer_size INT -- @/script
CREATE TABLE result AS SELECT
ST_BUFFER(the_geom, buffer_size) FROM myTable; The “param” after the name is a valid SQL Type.
- BOUNDINGBOX means this input is a Bounding Box. It will be converted for use by the script to a geometry value with the shape of the box. Outputs can be formatted the same way as inputs:
-- @output TYPE name params
The first value after “INPUT” is either TABLE, LITERAL, or BOUNDINGBOX, and specifies the type of the input parameter:
- TABLE means this output is of complex type, produced by a CREATE TABLE call or equivalent. There is no need for any parameter.
16 - LITERAL means this output is a single value output. It is produced by a CREATE TABLE with one column and one row.
-- ...
-- @output LITERAL count LONG -- @/script
CREATE TABLE count AS SELECT COUNT(*) FROM myTable;
- BOUNDINGBOX means this input is a Bounding Box. It is produced like a LITERAL value of type Geometry, except the Bounding Box of the geometry is returned.
C. Input and output formats
The purpose of the meta-language is to abstract the description of the process from the technical details of WPS. Also, the process should only work with data, not with specific data structures. Thus the server provides the necessary abstraction through the “Tables” accessible in the script, so that all data structures supported by the server are supported for any process.
The data structures currently supported by Gdms Server are:
- AutoCAD Drawing Exchange Format (DXF) – input only
- Character Separated Values (CSV) - Esri Shapefile (SHP, SHX, DBF; zipped) - dBase file (DBF)
- Gdms native format (GDMS)
- MapInfo Interchange Format (MIF/MID) – input only
- Solene geometry & attributes (CIR, VAL) – input only
- Virtual Reality Modeling Language (VRML) – input only
- TIFF, JPG, or PNG with ArcView world file - Esri ASCII Grid (ASC)
Other formats might be added in the future to Gdms, thus making them accessible to be input/output in a WPS process.
D. Pushing scripts to the server
OrbisGIS Server comes with a web frontend. The current prototype only allows the upload of a script through a basic web form. A complete website will be added with support for:
- browsing of the script catalog and catalog management,
17 - a web service for submitting scripts directly
from OrbisGIS.
6. Applications
As outlined by the WPS Specification, a WPS Service can be used for any kind of geospatial processing, from a simple buffer computation to a specialized urban area density diachronic analysis process.
Three examples are provided below: - a simple geometry buffer computation
- an example from the hydrology toolbox at the IRSTV: drainage network extraction
- an example from the field of urban area analysis: urban area density diachronic analysis
A. Simple script: geometry buffer
A common and simple use of a geo-processing service would be to compute a fixed-sized buffer around a set of geometries.
Such an operation would look like that in OrbisGIS as a SQL Script:
CREATE TABLE buffered AS SELECT ST_BUFFER(the_geom, 10) FROM input;
Provided there is a table “input” with geometry data registered in the current set of sources in OrbisGIS, this short script will produce the expected buffered geometries.
WPS-enabling this script is very easy in this case: -- @script
-- @identifier Buffer -- @title Geometry buffer -- @abstract Computes a buffer -- around all given geometries -- @/abstract
-- @input TABLE ( the_geom GEOMETRY ) -- @input LITERAL buffer_size INT -- @output TABLE buffered
-- @/script
CREATE TABLE buffered AS SELECT
ST_BUFFER(the_geom, buffer_size) FROM input; The metadata describes 2 input values:
- a table with geometries
- a literal integer value specifying the buffer size The metadata also defines a single output table that will contain the buffered geometries. The script is now ready to be uploaded to the webserver.
Once the user has connected to the web site and uploaded the script (or, in the future, deployed the script from OrbisGIS), any WPS client software can
18 browse the WPS Service, find the new process and execute it.
B. Hydrology: drainage network extraction Geographic Information Systems are used in conjunction with hydrology to map physical water behavior over the territory. Often a raster Digital Elevation Model (DEM) is used to produce morphologic and hydrologic indicators. Coupled with data about land usage and city planning, they can then give answers as to the hydrological behavior of a particular area.
In this example a hydrological drainage network and a watershed are extracted from a DEM (raster) called “dem_chezine”. The process follows these steps: - the DEM is filtered to remove any depression
(sinks are harmful to the process) [18] -- Filter to fill sinks
CREATE TABLE filled AS SELECT
ST_FillSinks(raster, 0.1) AS raster FROM dem_chezine;
- then a topographic direction grid is produced using the D8 algorithm
-- Compute the direction grid CREATE table dir AS SELECT
ST_D8Direction(raster) AS raster FROM filled; - then an accumulation grid is extracted as
described in [12]
-- Compute the accumulation grid CREATE table acc AS SELECT
ST_D8Accumulation(raster) AS raster FROM dir; - a theoretical drainage network is then
produced by connecting pixels whose accumulation value is above 1500 and sorting them using Strahler’s ordination method. -- Ordination of Strahler, allowing prioritization of the streams
CREATE TABLE strahler AS SELECT
ST_D8StrahlerStreamOrder(d.raster, a.raster, 1500) FROM dir d, acc a;
- finally the obtained rivers are converted to geometries and filtered to keep only streams of order lower than 6 (removing the smaller streams).
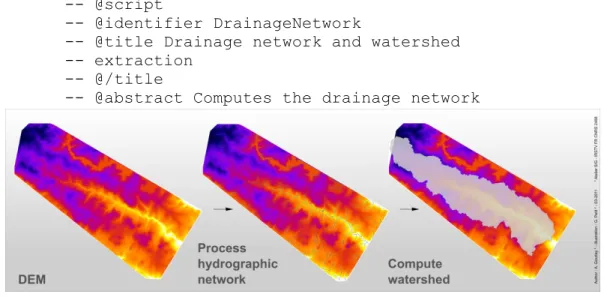
Figure 14 - drainage network and watershed extraction
19 CREATE TABLE allrivers AS SELECT
ST_VectorizeLine() FROM strahler ; -- Filter out streams of order > 6.
CREATE TABLE rivers_low_6 AS SELECT * FROM allrivers WHERE gid < 6;
This produces the expected drainage network. Another hydrology-specific function can then be used to extract the watershed from the network: the function extracts the outlet of the network from “river_low_6” and climbs back through the accumulation grid in order to produce the watershed. CREATE TABLE watershed_chezine AS SELECT ST_D8Watershed(acc.raster, ‘river_low_6’) FROM acc;
The whole process can be run in OrbisGIS and produce the expected data as shown on Erreur : source de la référence non trouvée.
This script can be converted and exposed as a WPS process with the following metadata:
-- @script
-- @identifier DrainageNetwork
-- @title Drainage network and watershed -- extraction
-- @/title
-- @abstract Computes the drainage network
-- and the associated watershed from -- a DEM raster
-- @/abstract
-- @input TABLE dem_chezine ( raster RASTER ) -- @output TABLE river_low_6
-- @output TABLE watershed_chezine -- @/script
This metadata describes a single raster input (the necessary DEM) and two outputs: the drainage network and the watershed.
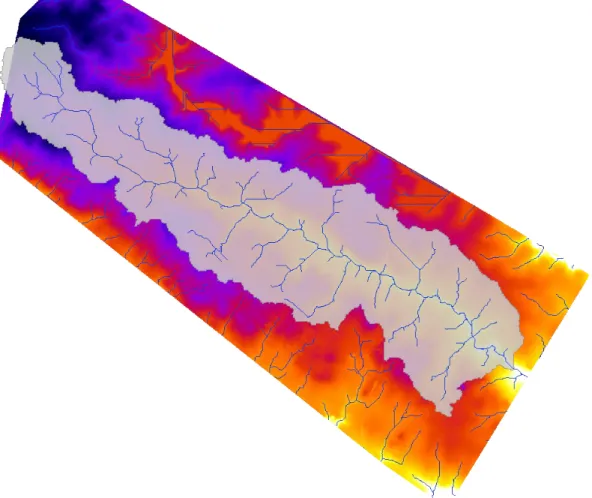
Figure 15 - outputs of the WPS process (stacked)
20 The whole script can then be uploaded to the WPS Server with OrbisGIS Server and run the same way, to produce exactly the same result (Erreur : source de la référence non trouvée).
C. Urban areas: density diachronic analysis Urban areas are characterized by an evolution of the land from cultivated parcels to urbanized ones. This third example studies the evolution of urbanized land density between 1999 and 2004 on the same study area.
The script processes a follow:
- the study area is covered by a regular 200 meter wide square grid
CREATE TABLE maillage AS SELECT
ST_CreateGrid(200,200) FROM study_area;
- then the data of “urban” type from 1999 is divided up between cells by intersecting them CREATE TABLE gridIntersect_urban_99 AS SELECT ST_intersection(a.the_geom,b.the_geom) AS
21 the_geom, a.gid FROM maillage a,
ocs99_1_chezine b WHERE ST_isValid(b.the_geom) AND ST_intersects(a.the_geom,b.the_geom)
AND b.C_NIVEAU=1;
- the resulting set of geometries is exploded and filtered to keep only polygons
CREATE TABLE exploded_99 AS SELECT
ST_Explode() FROM gridIntersect_urban_99; CREATE TABLE filterPointsAndLines_99 AS SELECT * FROM exploded_99 WHERE
ST_Dimension(the_geom) = 2;
- then all polygons within a cell are united together and there area is computed
CREATE TABLE union_urban_99 AS
SELECT ST_Union(the_geom) AS the_geom, gid FROM filterPointsAndLines_99 GROUP BY gid; CREATE TABLE UrbanDensityPerCell_99 AS SELECT ST_Area(the_geom) AS area, gid FROM union_urban_99;
- finally, the density is computed by dividing the cell area by the previously computed area CREATE TABLE density_99 AS
SELECT a.the_geom, a.gid, b.area as area, b.area/ST_Area(a.the_geom) AS density FROM maillage a, UrbanDensityPerCell_99 b WHERE a.gid=b.gid;
- the same steps are repeated for the 2004 data set.
CREATE TABLE gridIntersect_urban_04 AS
SELECT ST_intersection(a.the_geom,b.the_geom) AS the_geom, a.gid
FROM maillage a, ocs04_1_chezine b WHERE ST_isValid(b.the_geom)
AND ST_intersects(a.the_geom,b.the_geom) AND b.C_NIVEAU=1;
CREATE TABLE exploded_04 AS SELECT
ST_Explode() FROM gridIntersect_urban_04; CREATE TABLE filterPointsAndLines_04 AS SELECT * FROM exploded_04 WHERE
ST_Dimension(the_geom) = 2;
CREATE TABLE union_urban_04 AS SELECT ST_Union(the_geom) AS the_geom, gid
22 CREATE TABLE UrbanDensityPerCell_04 AS
SELECT ST_Area(the_geom) AS area, gid FROM union_urban_04;
CREATE TABLE density_04 AS
SELECT a.the_geom, a.gid, b.area as area, b.area/ST_Area(a.the_geom) AS density FROM maillage a,UrbanDensityPerCell_04 b WHERE a.gid=b.gid;
- to conclude, the density difference per cell is computed.
CREATE TABLE Evol_MOS_urban AS SELECT a.the_geom, a.gid,
((b.area - a.area)/ST_Area(a.the_geom))*100 AS diff_density
FROM density_99 a, density_04 b WHERE a.gid=b.gid;
To be exposed as a WPS process, the inputs and outputs need to be described. The process has only one output “Evol_MOS_urban”, but 3 inputs:
- the data set from 1999, called “ocs99_1_chezine” in the script
- the data set from 2004, called “ocs04_1_chezine” in the script
- the study area called “study_area”, which is used to compute the grid.
The resulting metadata is: -- @script
-- @identifier UrbanDensityComparison
-- @title Urban density diachronic analysis -- @abstract Computes the urban density
-- difference per 200 meter wide cell between -- two data sets
-- @/abstract
-- @input TABLE ocs99_1_chezine
-- ( the_geom GEOMETRY, C_NIVEAU INT ) -- @/input
-- @input TABLE ocs04_1_chezine
-- ( the_geom GEOMETRY, C_NIVEAU INT ) -- @/input
-- @input TABLE study_area -- ( the_geom GEOMETRY ) -- @/input
-- @output TABLE Evol_MOS_urban -- @/script
Figure 16 - output grid with high densities in red and low ones in yellow
23 The script can then be turned into a WPS process and its result consulting into any WPS-compatible GIS
software (Erreur : source de la référence non trouvée).
7. Conclusion & Future work
A. Future work on IRSTV’s SDI
WPS is currently a young technology with a great future: exposing geospatial processes as web services is becoming more and more essential at every scale, from the European INSPIRE Directive to the efforts of local cities to gather and use their spatial data.
The on-going project within IRSTV’s Spatial Data Infrastructure is part of this wider scheme. Although still a prototype, it is being fully developed and will be completely integrated into the SDI in August. A WPS client within OrbisGIS will also be developed to complete the system. This will be an opportunity to gather feedback from potential users, and form a task group dedicated to the improvement of the processing and sharing capabilities of the SDI.
This platform will then be used on a daily basis within IRSTV, as well as by the federation’s partners.
B. A feedback on the WPS Standard
The WPS Standard was released in 2007 with the objective of initiating the standardization of on-demand processing as web services. This is completely in line with the current trend of Internet-based services, “Cloud Computing”, and “Software as a Service” (SaaS). However there are still few implementations of the standard and even fewer use case scenarios clearly defined and displayed on the web. This study is also an opportunity to produce real
24 use cases with real data in one of the many fields on-demand processing can be applied to.
This experimentation is also an occasion to test a full scale implementation of an on-demand geospatial processing service with the WPS Standard. It outlined a potential improvement on the WPS Standard in its current form.
The standard defines a very abstract model for a web service, with the possibility to add profiles for specific uses. There is however no standardized WPS profile for dealing with geographic data yet.
A consequence of this is that geospatial processes deal with inputs and outputs in term of GML format, Shapefile format, etc. instead of Geometry objects, i.e. they are not provided with an abstraction over the particular implementation details of the file formats. Moreover, there already is a standard defining an abstract way of describing and accessing geometric data: the Simple Feature Access (SFA) Implementation Standard [13].
A profile extension could define a way for geospatial processes to be described with SFA’s Geometry objects, and for the WPS Service to be responsible for reading/writing a set of supported formats. The WPS Service implementation would thus, when a client calls DescribeProcess, fill out the input and output structure parts about the supported file formats.
This would provide an abstract model of a geospatial processing web service that abstracts both sides of the service – the client-to-WPS interface and the WPS-to-process interface – using existing OGC Standards. Such a profile dedicated to geospatial processing could also provide ways to specify geometric requirements/constraints on input data as specified by the Simple Feature standard, instead of file formats constraints. For example, an input could be required to provide Polygon objects, or only objects with a spatial dimension of 2, whatever the actual format is as long as it is supported by the WPS Service.
This abstraction is the ambitious idea behind the use of WPS described in this paper and being implemented within the IRSTV.
C. Personal feedback
As a general engineering student with a specific interest in computer science, this one-year long project was an occasion to learn a lot in several different fields:
- Working for the IRSTV gave me a tour into the wide domains of urban modeling, city planning, hydrology, etc. This was a unique opportunity to use my technical knowledge to
25 contribute to much applied sciences, as well as grasping scientific knowledge, both interesting and that might prove useful in the future.
- Studying the WPS Standard was an occasion to dive into the fields of geomatics, geographic information science and geodesy.
- Using and creating Open-Source software, and in this case an Open-Source computing platform that would benefit many actors, was a perfect example of building, sharing and contributing to a community-based collaborative platform. Being part of a young and dynamic team with people with different backgrounds also contributed to this collaborative approach to innovation and science.
- Working on this implementation was a wonderful opportunity to do heavy software engineering using state-of-the-art technologies like Scala and widely recognized industry standards like Java or SQL.
References
[1] E. Bocher, “Projet d’infrastructure de données spatiales”, presented at Plenière de l’IRSTV, Nantes, 2007.
[2] E. Bocher et al., “OrbisGIS: A GIS for scientific simulation”, presented at the Libre Software Meeting (LSM), Amiens, France, 2007.
[3] E. Bocher et al., “Urbsat : outil d’extraction d’informations géographiques et de production d’indicateurs”, presented at the Journées Information géographique et observation de la Terre, Strasbourg, France, 2007.
[4] E. Bocher, “Audit sur les données du Secteur Atelier Pluridisciplinaire”, IRSTV, Nantes, France, Internal Rep., 2008.
[5] E. Bocher et al., “GDMS: an abstraction layer to enhance Spatial Data Infrastructures usability”, in 11th AGILE Int. Conference on Geographic
Inform. Sci., Girona, Spain, 2008.
[6] W. Clinton, “Coordinating geographic data acquisition and access: The National Spatial Data Infrastructure”, Executive Order 12906, Apr. 13, 1994.
[7] G. Hegron, “MEIGEVille, Modélisation environmentale intégrée et gestion durable de la ville”, Région des Pays de la Loire, France, Appel à projets régionaux, 2006.
[8] Information technology – Database languages – SQL, ISO/IEC 9075(1-4, 9, 11, 13, 14), 2008.
26 [9] INSPIRE, “Directive of the European Parliament
and of the Council establishing an Infrastructure for Spatial Information in the European Community (INSPIRE)”, The European Parliament and Council, Directive 2007/2/EC, Mar. 14, 2007.
[1
0] C. Michael and D. P. Ames, “Evaluation of theOGC Web Processing Service for Use in Client-Side GIS”, OSGeo Journal, vol. 1, May 2007. [1
1] D. Nebert. (2004, Jan. 25). Data Infrastructures: the SDI Cookbook Developing Spatial(v2.0) [Online]. Available: www.gsdi.org
[1
2] J. Ocallaghan, D. Mark, “The extraction ofdrainage networks from digital elevation data”,
Comput. Vision, Graph., and Image Process., vol. 28, no. 3, pp. 323-344, Dec. 1984.
[1
3] OpenGIS Implementation Standard forGeographic information – Simple feature access – Part 1: Common architecture, OGC Standard 06-103r4, 2006.
[1
4] OpenGIS Implementation Specification forGeographic Information - Simple feature access - Part 2: SQL option, v1.2.1, OGC Standard 06-104r4, 2006.
[1
5] OpenGIS Web Feature Service 2.0 InterfaceStandard, v2.0, OGC Standard 09-025r1 also ISO/DIS 19142, 2010.
[1
6] OpenGIS Web Map Service (WMS)Implementation Specification, v1.3.0, OGC Standard 06-042, 2006.
[1
7] OpenGIS Web Processing Service
, v1.0.0, OGC Standard 05-007r7, 2007.
[1
8] O. Planchon, “A fast, simple and versatilealgorithm to fill the depressions of digital elevation models”, CATENA, vol. 46, no. 2-3, pp.159-176, 2002.
[1
9] S. Steiniger and E. Bocher, “An Overview onCurrent Free and Open Source Desktop GIS Developments”, Int. J. of Geographic Inform. Sci., vol. 23, no. 10, pp. 1345-1370, 2009.
[2 0]
S. Steiniger and A. J. S. Hunter, “Free and Open Source GIS Sorfware for Building a Spatial Data Infrastructure”, Geospatial Free and Open Source Software in the 21st Century: Proc. of the first Open Source Geospatial Research Symp., to be published.
![Figure 1 - IRSTV Spatial Data Infrastructure (SDI) and GIS 2GIS was to lay out the bases for an urban knowledgegathering tool, analysis methods and managementtechniques [7].](https://thumb-eu.123doks.com/thumbv2/123doknet/11602533.299565/3.892.214.676.593.965/figure-irstv-spatial-infrastructure-knowledgegathering-analysis-methods-managementtechniques.webp)