Zebrafish Bone and General Physiology Are
Differently Affected by Hormones or
Changes in Gravity
Jessica Aceto1, Rasoul Nourizadeh-Lillabadi2, Raphael Marée3, Nadia Dardenne4,
Nathalie Jeanray1, Louis Wehenkel3, Peter Aleström2, Jack J. W. A. van Loon5,6☯, Marc Muller1☯*
1 Laboratory for Organogenesis and Regeneration, GIGA- Research, University of Liège, B-4000, Liège, Sart-Tilman, Belgium, 2 BasAM, Norwegian University of Life Sciences, Vetbio, 0033 Dep, Oslo, Norway, 3 GIGA & Department of Electrical Engineering and Computer Science, University of Liège, Liège, Belgium, 4 Unité de soutien méth. en Biostatistique et Epidémiologie, University of Liège, B23, Sart Tilman, Liège, Belgium, 5 DESC (Dutch Experiment Support Center), Department of Oral and Maxillofacial Surgery / Oral Pathology, VU University Medical Center & Academic Centre for Dentistry Amsterdam (ACTA), Amsterdam, The Netherlands, 6 ESA-ESTEC, TEC-MMG, NL-2200 AG, Noordwijk, The Netherlands
☯ These authors contributed equally to this work. *[email protected]
Abstract
Teleost fish such as zebrafish (Danio rerio) are increasingly used for physiological, genetic and developmental studies. Our understanding of the physiological consequences of al-tered gravity in an entire organism is still incomplete. We used alal-tered gravity and drug treat-ment experitreat-ments to evaluate their effects specifically on bone formation and more
generally on whole genome gene expression. By combining morphometric tools with an ob-jective scoring system for the state of development for each element in the head skeleton and specific gene expression analysis, we confirmed and characterized in detail the de-crease or inde-crease of bone formation caused by a 5 day treatment (from 5dpf to 10 dpf) of, respectively parathyroid hormone (PTH) or vitamin D3 (VitD3). Microarray transcriptome analysis after 24 hours treatment reveals a general effect on physiology upon VitD3 treat-ment, while PTH causes more specifically developmental effects. Hypergravity (3g from 5dpf to 9 dpf) exposure results in a significantly larger head and a significant increase in bone formation for a subset of the cranial bones. Gene expression analysis after 24 hrs at 3g revealed differential expression of genes involved in the development and function of the skeletal, muscular, nervous, endocrine and cardiovascular systems. Finally, we propose a novel type of experimental approach, the "Reduced Gravity Paradigm", by keeping the de-veloping larvae at 3g hypergravity for the first 5 days before returning them to 1g for one ad-ditional day. 5 days exposure to 3g during these early stages also caused increased bone formation, while gene expression analysis revealed a central network of regulatory genes (hes5, sox10, lgals3bp, egr1, edn1, fos, fosb, klf2, gadd45ba and socs3a) whose expres-sion was consistently affected by the transition from hyper- to normal gravity.
OPEN ACCESS
Citation: Aceto J, Nourizadeh-Lillabadi R, Marée R, Dardenne N, Jeanray N, Wehenkel L, et al. (2015) Zebrafish Bone and General Physiology Are Differently Affected by Hormones or Changes in Gravity. PLoS ONE 10(6): e0126928. doi:10.1371/ journal.pone.0126928
Academic Editor: Paul Eckhard Witten, Ghent University, BELGIUM
Received: December 18, 2014 Accepted: April 9, 2015 Published: June 10, 2015
Copyright: © 2015 Aceto et al. This is an open access article distributed under the terms of the Creative Commons Attribution License, which permits unrestricted use, distribution, and reproduction in any medium, provided the original author and source are credited.
Data Availability Statement: Raw data and complete lists of analyzed data are publicly available at Arrayexpress (https://www.ebi.ac.uk/arrayexpress/) under the accessions: E-MTAB-3285, E-MTAB-3286, E-MTAB-3289, and E-MTAB-3290.
Funding: This work was supported by the "Fonds de la Recherche Fondamentale Collective"; 2.4555.99/ 2.4542.00/2.4561.10, the SSTC; PAI: P5/35, the University of Liège; GAME project, the European Space Agency projects LSS-003 and AO-99-LSS-006, the Belgian Space Agency Prodex projects FISH-GSIM and FISH-SIM. JvL received grant
MG-Introduction
For many years, the zebrafish has been recognized as an excellent model system for vertebrate developmental biology. More recently, it is increasingly used to study vertebrate physiology, pathology, pharmacology and toxicology [1–5]. Its main advantages are easy maintenance, high fertility, rapid and external development, easy observation of all developmental stages, small size, transparency of the embryos and close contact with surrounding medium (water) al-lowing easy administration of drugs. In addition, its genome is sequenced and extensively an-notated together with well established forward and reverse functional genomics and access to already generated and characterized mutants and transgenic lines of fish (zfin.org).
Skeletal development in zebrafish was first more widely addressed in large scale mutagenesis screening initiatives, resulting in identification of a number of genes required for early forma-tion of the head skeleton [6,7]. Cranial cartilage is the first skeletal structure to be detected as early as 3 days post-fertilization (dpf), while first calcified intramembranous bone structures start to form at about the same time. Perichondral bone elements slowly build up on the exist-ing cartilage matrix durexist-ing the followexist-ing days. In mammals, one of the major genes involved in osteoblast differentiation is Runx2. In zebrafish, its ortholog runx2b is similarly required for os-teoblast differentiation [8] and the onset of osteoblast specific genes [9], such as members of the dlx family [10] and osterix (osx) [11,12], again with mammalian orthologs. Other expressed genes code for bone extracellular matrix (ECM) proteins osteocalcin (Osc2)[13], collagen10a1a (Col10a1a)[14], Bglap, Spp1 and collagen1a1a (Col1a1a) [9,15,16]. The latter is mutated in the chihuahua (chi) mutant, a model for the human condition of osteogenesis imperfecta. Final-ly, correct calcification of the bone ECM depends on transcellular epithelial calcium uptake through the calcium channel Trpv5/6 [17] and the precise control of phosphate/pyrophosphate homeostasis by the Entpd5 diphosphohydrolase, expressed in osteoblasts [18] together with the widely expressed phosphodiesterase Enpp1 [19]. Taken together, these observations indi-cate an extensive similarity of the molecular pathways governing bone physiology between tele-osts and mammals, validating the zebrafish as a vertebrate model in this field [16,20–22].
During space flight, human passengers experience profound alterations of their skeletal and muscular system, as well as blood circulatory and immune systems [23–25]. Microgravity is the main differential factor of the environment in space and is probably responsible for the rapid bone loss (osteoporosis) observed in space. Various fish species, such as carp [26], gold-fish [27–31], or cichlids [32–39] have been utilized in the past for evaluating the effects of al-tered gravity. More recently, smaller fishes such as swordtail [37,40], medaka [41–46] and zebrafish [47–51] have attracted more attention. Most analyses using fishes have concentrated on the impact of altered gravity on graviperception [33,52], the vestibular system [37,53,54] and its involvement in motion sickness [38,55–57]. Several studies also revealed that general embryogenesis of various organisms is not affected by gravity conditions (review in [46,49,50,
58]).
Here, we investigate the effect of increased gravity on the general physiology of zebrafish lar-vae by using a Large Diameter Centrifuge (LDC) [59] to study whole genome gene expression. We investigate in more detail the effects on head skeleton development and we validate our ap-proach by studying the effects of drug treatments (VitD3 and PTH) known to affect bone for-mation. Finally, we propose a novel approach to study the effects of microgravity by growing zebrafish in hypergravity for 5 days (from 0–5dpf) before returning them to normal gravity, the Reduced Gravity Paradigm, RGP [60]. The hypothesis for this paradigm dictates that simi-lar effects as observed from the transition going from 1g into micro-g are observed going from a hypergravity level towards a 1g acceleration, a special kind of simulated microgravity or
Zebrafish Bone and General Physiology in Hyper-Gravity
057 from the Netherlands Organisation for Scientific (NWO) Research Earth and Life Sciences via the Netherlands Space Office NSO.
Competing Interests: Co-author Marc Muller is a PLOS ONE Editorial Board member. This does not alter the authors' adherence to PLOS ONE Editorial policies and criteria.
‘relative microgravity’. However, it may be expected that the magnitude of the effects applying RGP is reduced as compared to the 1g -μg transition.
Materials and Methods
Animal procedures
Zebrafish (Danio rerio) were maintained under standard conditions [61] in the GIGA zebrafish facility (licence LA2610359). Briefly, zebrafish (Danio rerio) of the AB strain were reared in a recirculating system from Techniplast, Italy at a maximal density of 7 fish/l. The water charac-teristics were as follows: pH = 7.4, conductivity = 500μScm-1, temperature = 28°C. The light cycle was controlled (14 h light, 10 h dark). Fish were fed twice daily with dry powder (ZM fish food) adapted to their age and once daily with fresh Artemia salina nauplii (ZM fish food). Lar-vae aged less than 14 days were also fed twice daily with a live paramecia culture. Wild type em-bryos were used and staged according to [62].
The day before breeding, wild-type adult male and female zebrafish were set up in several breeding tanks, separated by a clear plastic wall. After the light was turned on the next morn-ing, walls are removed, eggs are generated by natural mating and collected from 30 minutes to 2 hours after spawning. After sorting, clean eggs are moved to Petri dishes and incubated at 28°C in E3 medium (5 mM Na Cl, 0.17 mM KCl, 0.33 mM CaCl2, 0.33 mM MgSO4, 0.00001%
Methylene Blue). All protocols for experiments were evaluated by the Institutional Animal Care and Use Committee of the University of Liège and approved under the file numbers 568, 1074, and 1264 (licence LA 1610002).
Chemicals
Parathyroid hormone (PTH; Merck-Calbiochem, Overijse, Belgium) stock solution (1μg/ml) was prepared in DMSO and stored in aliquots at -20°C. Vitamin D3 (cholecalciferol, VitD3; Sigma-Aldrich, Diegem, Belgium) stock solution (200μl/ml) in DMSO was stored in aliquots at -20°C for maximum one month.
Chemical treatments
The chemical protocol was inspired by Fleming and collaborators experiments [63]. Larvae at 5dpf were transferred into a 6 well plate (Millipore) containing E3 medium supplemented with the required chemical or vehicle (DMSO) as negative control. The medium was changed every day at the same time. Final concentrations in E3 were at 10ng/ml for PTH and 200ng/ml for VitD3. Each well contained 20 fish in 4ml. They were treated for 1day (n = 50–60 larvae) to perform microarrays and for 5days, from 5 to 9 or 10dpf, to observe the longer-term effects of treatments by different staining (n = 20–30 larvae). Plates were placed into the dark and incu-bated at 28°C. The larvae were euthanized by tricaine overdose (0.048% w/v) and directly sub-mitted to an RNA extraction at 6dpf (for microarrays) or a 4% para-formaldehyde (PFA; Sigma-Aldrich, Diegem, Belgium) fixation at 6, 9 or 10dpf (for staining).
Hypergravity experiments in the Large Diameter Centrifuge
A Large Diameter Centrifuge (LDC) was used for hypergravity experiments. It is composed of a central axis linked to 2 perpendicular arms, each arm terminating in 2 opposing gondolas where it is possible to install an incubator containing the samples. The arms provide an 8m di-ameter for rotation and can provide centrifugal forces of maximum 20g. The zebrafish larvae were incubated in 20 ml E3 in a Petri dish placed in an incubator within a gondola for 3g experiments, and placed either in an incubator on the centrifuge axis (axe) or outside of the
centrifuge for 1g controls. In this setting, the medium represents less then 5 mm of water col-umn and thus the 3g acceleration causes an increase in hydrostatic pressure of maximum 0.0015 bar, as compared to the 1bar atmospheric pressure [64].
Staining methods
Acid-free protocols were adapted [65] to perform Alcian blue (8 GX Sigma-Aldrich, Diegem, Belgium) staining of cartilage structures and Alizarin red S (Sigma-Aldrich, Diegem, Belgium) staining of calcified structures. At 6, 9 or 10dpf, the larvae were fixed in 4% PFA for 2h at room temperature and rinsed several times with PBST.
Cartilage was stained overnight in 10 mM MgCl2, 80% EtOH and 0.04% Alcian blue. The
larvae were washed in different concentrations of ethanol (80%, 50%, 25%) to remove excess staining. Pigmentation was bleached in a H2O2solution (H2O23%, KOH 0.5%) and finally the
larvae were rinsed 3 times in a solution of 25% glycerol / 0.1% KOH and 50% glycerol, 0.1% KOH and finally stored in this solution at 4°C.
During acid-free bone structure staining with Alizarin red, bleaching was performed imme-diately after fixation, before the staining. After the bleaching, long rinses (at least 20min each) in a 25% glycerol, 0.1% KOH solution are necessary to prevent the fading of the staining. The larvae are stained in a 0.05% Alizarin red solution in water for 30min in the dark on low agita-tion, rinsed in a 50% glycerol, 0.1% KOH solution to remove excess staining and kept at 4°C in the same solution.
Images of stained larvae (n = 20–30 larvae) were obtained on a binocular (Olympus, cell B software).
Image analysis
Image analysis was performed on the pictures of larvae stained with Alcian blue for cartilage or Alizarin red for bone. Individual cartilage and bone elements were identified according to [10,
15,66–68]. For morphometric analysis, images were uploaded into the CYTOMINE environ-ment [69] and manually annotated by positioning 21 landmarks for larvae stained for cartilage (Fig 1A) as previously defined in the CYTOMINE ontology. 29 landmarks were placed for lar-vae stained for bone in hormonal treatments (Fig 1C), of which 15 were selected for the hyper-gravity experiments. The program then defines the positions of all selected landmarks and computes all the distances (in pixels) and angles (in radian) of all the possibilities between two points of interest. These data were exported into an Excel file and a selection of interesting measures was conducted by performing principal component analysis on data obtained from differently treated larvae to identify invariable or redundant measures. The measures selected were: for cartilage (Alcian blue): Anterior to Ethmoid plate, Anterior to Posterior, Articulation down to Articulation up, Ceratohyal ext. down to Ceratohyal ext. up, Ceratohyal ext. down to Ceratohyal int. down, Ceratohyal ext. up to Ceratohyal int. up, Ethmoid plate to Posterior, Hyosymplectic down to Hyosymplectic up; and for bone (Alizarin red): Anguloarticular down to Anguloarticular up, Anterior to Notochord, Anterior to Parasphenoid a, Branchiostegal ray 1 down to Branchiostegal ray 1 up, Entopterygoid down to Entopterygoid up, Maxilla down to Maxilla up, Opercle down to Opercle up, Parasphenoid a to Parasphenoid b, Parasphenoid b to Parasphenoid c, area of the parasphenoid triangle: parasphenoid a, b, and c, and finally the an-gles between parasphenoid a and b, a and c, b and c.
Statistics were performed using GraphPad Prism5. A t-test was used for control versus treat-ment experitreat-ments, while a one way ANOVA was used for multiple comparisons.
Morphometric analysis did not inform about the extent of ossification within each larva. Thus, a systematic structure analysis was generated. Each bone structure was classified based
Fig 1. (A-D) Cartilage and bone elements of the head skeleton in 10dpf zebrafish. (A) Alcian blue staining of head cartilage representing the landmarks used for morphometry. (B) Schematic representation of the different head cartilage elements. anterior limit (an), articulation (ar), ceratobranchial pairs 1 to 4 (cb1-4), ceratohyal (ch), ethmoid plate (et), hyosymplectic (h), Meckel's cartilage (mk), palatoquadrate (pq), posterior limit (po). (C) Alizarin red staining of cranial bones representing the landmarks used for morphometry. (D) Schematic representation of the different cranial bone elements with 29 landmarks used for chemicals treatments and 15 landmarks for the 3g and the relative-hypergravity. The 15 landmarks are anguloarticular (aa), anterior (an), branchiostegal ray1 (br1), entopterygoid (en), maxilla (m), notochord (n), opercle (o), parasphenoid (p). Note that the parasphenoid is a triangular bone defined by its anterior summit (a) and two posterior summits (b,c). The 29 landmarks include the 15 named before with branchiostegal ray2 (br2), cleithrum (c), ceratobranchial 5 (cb), ceratohyal (ch), dentary (d), hyomandibular (hm). (E-J) 10dpf zebrafish larvae after 5 days chemical treatments. (E-G) Alcian blue staining of cartilage. (H-J) Alizarin red staining of bone. (E,H) Controls in DMSO. (F,G) no significant effect of, respectively VitD3 and PTH on cartilage development, nor on chondrocyte shape or size (inlays showing close-up). I: increase of bone development after VitD3 treatment. (J) decrease of bone development after PTH treatment. Ventral views, anterior to the left, (E-J) scale bar = 250μm.
on the progress of development into one of the four following categories: absent, early ossifica-tion, advanced ossification and over ossification. When values were considered as quantitative, comparison between two groups (control versus chemical treatment or hypergravity in 1g>3g) was assessed by a Student t-test, while comparison between different treatments ("relative mi-crogravity" experiment) was assessed by an analysis of variance (ANOVA). A contingency table considered ordinal values distributed among the 4 classes (from absent to over ossifica-tion) or only 3 classes when one class was not present in the sample. Association between clas-ses and treatment was asclas-sessed by X² test and by an ordinal logistic regression and the odds ratio (OR). The "relative microgravity" experiment was analyzed in addition by grouping the 3g, 3g>1g and 3g>axe versus the 1g sample.
Statistical analyses were performed using the Statistica Software (version 10). Results were considered statistically significant at the 5% critical level (p< 0.05).
RNA extraction and reverse transcription
Larvae at 6dpf, after 24h treatment, were used for the RNA extraction. Total RNA was ex-tracted of 60 larvae per experiment using Trizol, followed by the RNeasy Mini kit (Qiagen, Hil-den, Germany) according to the manufacturer’s instructions and conserved at -80 degrees using. They were treated with Rnase-free Dnase Set (Qiagen, Hilden, Germany). After extrac-tion, the quality and concentration of total RNA was evaluated by electrophoresis on capillary gel and the ratio of absorbance at 260/280nm by spectrophotometer (Bioanalyzer 2100, Agilent Technologies, Diegem, Belgium). Synthesis of cDNA was performed from 1μg of total RNA, which was reverse transcribed (Transcriptor iScript cDNA Synthesis Kit, Bio-Rad, Nazareth, Belgium) according to the manufacturer’s instructions.
Real Time-PCR
Gene-specific oligonucleotide primers were designed using Primer3 software to span exon-exon junctions to avoid detection of genomic DNA contamination (seeS1 Tablefor primer se-quences) and synthesized by Eurogentec (Seraing, Belgium) or Integrated DNA Technology (Leuven, Belgium). cDNA was used as template for quantitative Real-Time PCR with the Sensi-Mix SYBR Kit (Bioline, London, UK), containing Sybr green. Reactions were performed on an Applied Biosystems 7900 HT sequences Detection System (Applied Biosystems, Foster City, CA) using the onboard software (SDS 2.4). Purity of the amplicons was checked by melting curves at the end of each reaction. Ct values were exported from the onboard software as a text file and imported into a customized Microsoft excel spreadsheet. 1μl of the RT reaction (1/20 of the total cDNA) was added to 1X SYBR green master mix (Bioline, London, UK), 150 nmol of each primer in 15μl total volume. Samples were run in triplicate in optically clear 384-well plates (ABgene), sealed with optical adhesive film (Applied Biosystems). "No template" con-trols were run for all reactions, and all RNA preparations were subjected to sham reverse tran-scription to check for the absence of genomic DNA amplification. The relative transcript level of each gene was obtained by the 2-ΔΔCtmethod [70] and normalized relative to the gapdh (glyceraldehyde-3-phosphate deshydrogenase) housekeeping gene chosen from a panel of 3 genes (gapdh, ef1-a, ß-actin) as the most stably expressed throughout our experiments (not shown). Data from biological replicates were averaged and shown as mean normalized gene expression ± SD.
Cycling parameters: 50°C x 2 min, 95°C x 10 min, then 40 cycles of the following 95°C x 15 s, 62°C x 20 s. A melting temperature-determining dissociation step was performed at 95°C x 15 s, 60°C x 15 s, and 95°C x 15 s at the end of the amplification phase.
Microarray expression experiments
For microarray expression analysis, four replicates from each treatment (control and drug or gravity treatment) were analyzed in 2+2 dye-swap hybridizations. Oneμg total RNA was line-arly amplified one round and labeled, using Amino Allyl Message Amp II aRNA amplification kit (Ambion-Life Technologies, Gent, Belgium) as previously described [71]. Fiveμg of the re-sulting antisense RNA (aRNA) from the exposed and control groups was labeled either with Cy3-dUTP or Cy5-dUTP (GE Healthcare Bio-Sciences AB, Uppsala, Sweden). The labeled tar-gets were examined for amplification yield and incorporation efficiency by measuring the aRNA concentration at 260 nm, Cy3 incorporation at 550 nm, and Cy5 at 650 nm using Nano-drop (Thermoscientific, Wilmington, DE, USA). A good aRNA probe had a labeling efficiency of 30–50 fluorochromes every 1000 bases. One to 5 μg of each labeled aRNA target was mixed, 9μl 25× fragmentation buffer (Agilent Technologies, Diegem, Belgium) added, and the final volume adjusted to 225μl with RNase-free H2O followed by incubation for 30 min at 60°C. The hybridization solution was prepared by adding 220.5μl of 2× hybridization buffer (Agilent Technologies, Diegem, Belgium) and 4.5μl sonicated herring sperm DNA (10 μg/μl; Promega, Madison, WI, USA) to the labeled target aRNA. Microarray slides (4x44K zebrafish V2 or V3, Agilent Technologies, Diegem, Belgium) were prehybridized at 42°C, 60 min using 0.1% bovine serum albumin (BSA) Fraction V, 5× SSC, and 0.1% sodium dodecyl sulfate (SDS). Hybridiza-tion was performed at 60°C in 16 h using gasket slides, hybridizaHybridiza-tion chamber, and oven (Agi-lent Technologies, Diegem, Belgium) according to Agi(Agi-lent 60-mer oligo microarray processing protocol. Microarray slides were then washed 3 × 5 min in 0.5 × SSC, 0.01% SDS (first wash at 42°C and next two at room temperature). Finally, slides were washed 3 times in room temp with 0.06× SSC and dried immediately with centrifugation at 800×g for 1 min.
Microarray slides were scanned using a GenePix 4000B (Axon instrument, Foster City, CA). Scanning was performed at a level just before saturation of several spots. Raw data generated from Genepix were imported into the Bioconductor package LIMMA and corrected for back-ground [72]. For within-array and between-array normalization, print tip Loess and scale were used, respectively [72]. An empirical Bayes moderated t-test [72,73] was applied to detect dif-ferently expressed genes across treated and control samples. The p values were corrected for multiple testing using the Benjamini–Hochberg (BH) [74] method and p-values<0.1 were se-lected as differently expressed genes. The generated gene list was further filtered for genes with low intensity and with small changes in expression. In the averaged normalized MA-Plot, the majority of genes were clustered in between M values of ±0.4 (fold change ±1.3) and selected to be threshold criteria for differently expressed gene list. The VitD3 data were obtained on a SureScan Dx instrument (Agilent Technologies, Diegem, Belgium) and analyzed using the GeneSpring software (Agilent Technologies, Diegem, Belgium) by applying the same settings.
Raw data and complete lists of analyzed data are publicly available at Arrayexpress (https:// www.ebi.ac.uk/arrayexpress/) under the accessions: 3285, 3286, E-MTAB-3289, and E-MTAB-3290.
Ingenuity Pathway Analysis
For pathway and biological function analysis of significantly differently expressed genes, Ingenuity pathway analyses (IPA, QIAGEN Redwood City;http://www.ingenuity.com) were used. The lists with differently expressed genes generated by the microarray analysis were translated into mammalian (human, mouse, and rat) orthologs using the Unigene & Gene Ontology Annotation Tool and uploaded to IPA. The IPA software is an online exploratory tool with a curated database for over 20,000 mammalian genes and 1.9 million published litera-ture references. IPA’s database together with EntrezGene, Gene Ontology, etc., integrates
transcriptomics data with mining techniques to predict and build gene networks, pathways, and biological function clusters. The output results are given scores and p-values that are com-puted based on the number of uploaded genes in the cluster or network and the size of the net-work or cluster in the Ingenuity knowledge database. Fisher’s exact test is used to determine the probability that each associated biological function is due to chance alone. Scores for IPA networks are the negative logarithm of the p-value, indicating the likelihood of the focus genes (genes uploaded to IPA) in a network being found together due to random chance. Scores of 2 or higher have at least a 99% likelihood of not being generated by chance alone.
Results
Effects of drug treatments on head skeletal formation
To characterize in detail the process of cartilage and bone formation in zebrafish, we first wanted to examine the effects of chemical treatments known to affect skeletal development. Treatment of zebrafish larvae with vitamin D (VitD3) was previously shown to result in en-hanced bone formation, while continuous treatment with parathyroid hormone (PTH) led to decreased bone formation [63]. We decided to confirm and extend these findings by compar-ing the effects on skeletal formation to those on gene expression.
VitD3 and PTH treatments were performed continuously from 5dpf to 10dpf. Control and treated larvae were stained by Alcian blue for cartilage extracellular matrix (ECM) and with Alizarin red to detect the calcified bone matrix. At this stage, the head cartilage is well formed and a complete set of cartilage elements is observed (Fig 1A and 1B). In contrast, although ossi-fication begins at 3dpf and the first bone structures are visible at 5dpf, the bone skeleton con-tinues its formation until 30dpf [68]. Nevertheless, at 10dpf, a number of bone elements are observed in the head region, the first vertebral centrae are formed, while others only begin to be calcified (for example the branchiostegal ray2) (Fig 1C and 1D).
In three independent experiments, 27–29 ventral view images of Alcian blue- or Alizarin red-stained larvae were obtained. After 5days of VitD3 or PTH treatment, cartilage stays un-changed as compared to the control by general observation. The structures are well formed, complete with the glycosaminoglycans present in the cartilage matrix judging from the similar staining intensity (Fig 1E–1G). In a close-up view (Fig 1E–1G, inlays), no difference could be observed in cell shape or size between the different treatments. Considering bone calcification, a general observation revealed a clear increase of bone development upon VitD3 treatment (Fig 1I). Some structures appear in advance, such as the retroarticular (Fig 1Iarrowhead) bone and the preopercular (not shown) bone, while some other structures are thicker such as the dentary or the ceratohyal, or longer such as the branchiostegal ray2. Nevertheless, the general morphology was unchanged. In contrast, continuous PTH treatment led to a general decrease of bone formation and to a complete absence of some structures, such as the anguloarticulars and branchiostegal ray2 (Fig 1J).
Based on these images, we applied two complementary approaches to obtain a more objec-tive qualitaobjec-tive and quantitaobjec-tive description of the skeleton. The first one is a morphometric approach that evaluates the general aspect of the head skeleton by measuring the distances be-tween and the relative position of all detected bone elements. The images were introduced into the CYTOMINE software (seeMaterials and Methods, [69]) and each image was annotated by positioning specific landmarks representing the different skeletal elements. For larvae stained for cartilage, 21 landmarks were defined (Fig 1A), while 29 points of interest were positioned within the Alizarin red-stained bone skeleton (Fig 1C). In these pictures, we consider the head separated horizontally in 2 parts. Some structures are unique and located on the symmetry axis, while others are paired and localized symmetrically, such as the dentary, maxilla,
entopterygoid, and hyosymplectic. To facilitate recognition, these were labelled“up” and “down”. The software then computes the distances between selected landmarks and the angles formed by lines drawn between selected points.
Morphometric analysis in VitD3-treated larvae cartilage revealed an increase of the distance between articulation (ar) "up" and "down", leading to a broader jaw as compared to untreated animals, while all the other distances remained unchanged (S1A and S1C Fig). Morphometric cartilage analysis of larvae treated with PTH for 5 days revealed an increase in length of the cer-atohyal cartilages (ch,S1B Fig). Analysis of the bone skeleton after VitD3 treatment revealed a significant increase of the distance between maxillae (m,Fig 2A), consistent with a broader jaw as already observed by cartilage morphometry. The length of the head skeleton is also increased upon VitD3 treatment with a longer distance between the anterior part of the head (an) and the notochord (n) or the parasphenoid (p). Other measures are not significantly modified (Fig 2A and 2C). PTH treatment led to a significant decrease of the size of the parasphenoid (p,Fig 2C). Some structures are missing, such as the anguloarticular (aa), branchiostegal ray2 (br2), ceratohyal (ch) and/or maxilla (m) and a significant broadening of the posterior head skeleton is revealed by the increased distance between left and right ("up" and "down") branchiostegal rays1 (br1), entopterygoids (en), and opercula (o) (Fig 2B).
The second approach consists in the evaluation of the intensity and progression of bone for-mation of the different bone structures, and their level of ossification. In each image, every bone structure is assigned a score, ranging from absent (red), early ossification (yellow), ad-vanced (green) or over-ossified (purple) in comparison to a typical image of a control larva of the same age. The distribution of the scores obtained for the different elements in VitD3- or PTH-treated larvae and the corresponding controls is shown inFig 3and the results of the sta-tistical analysis are given inS2andS3Tables.
After 5 days VitD3 treatment, all the structures are present and some are over-ossified like the hyomandibular, the entopterygoid, the dentary and the ceratohyal bones. Early (delayed) ossification is decreased for all the structures shown, as compared to controls, while advanced ossification increased in the maxilla, branchiostegal ray1, branchiostegal ray2 and anguloarti-cular (Fig 3A). Statistical analysis (S2 Table) reveals that only the anguloarticular and the max-illa up do not change significantly in this condition. All the other structures (br1, br2, m down, ch, d, en, hm) are significantly increased, with the hyomandibulars, entopterygoids and cera-tohyals displaying the most drastic effect. These results confirm a very significant positive effect of VitD3 treatment on bone formation.
PTH treatment resulted in nearly opposite effects to VitD3. Only the entopterygoid and the branchiostegal ray1 are present in each fish (Fig 3B) with the branchiostegal ray1 unaffected and the entopterygoid displaying 60% of early ossification in PTH-treated larvae compared to 3,45% in controls. All the other structures were absent in at least 20% of the total 27 fish ana-lyzed. The strongest effect was seen in the anguloarticular bone with 94% of absence compared to 21% absence, 19% early ossification and 60% of advanced ossification in the controls. Specif-ic statistSpecif-ical analysis confirmed that PTH treatment signifSpecif-icantly (p<0,001) reduced nearly all the structures except branchiostegal ray1 (S3 Table).
To obtain a global score describing the head skeleton in the different conditions, the individ-ual structure scores in each image were added up and a mean global score was obtained show-ing that VitD3 treatment significantly increases bone development (from a score of 26±3 in the controls to 33±4 in the VitD3 treatment), while PTH treatment significantly decreases ossifica-tion to approximately half of untreated control (from a score of 27± 4 to 13±5,5).
In summary, these complete image analyses reveals that VitD3 treatment conserves the gen-eral skeletal morphology, but leads to a longer head and a larger jaw. Bone calcification is stron-ger for most elements, and some elements calcify earlier. In contrast, PTH treatment conserves
Fig 2. Morphometric analysis results of bone matrix staining after 5 days chemical treatments. The distances are measured in pixels. Mean± SD and t-test analysis were calculated for each measure on at least 20 individuals.* p < 0.05, ** p < 0.01 and ***p < 0.001. (A) Distances after VitD3 treatment. (B) Distances after PTH treatment. (C) Area of the parasphenoid bone results after 5 days PTH or VitD3 treatment. Abbreviations as inFig 1. A) Analysis of the
the general cartilage morphology except for an increased length of the ceratohyal. In bone, PTH treatment leads to a general decrease of ossification. Some structures are missing and the parasphenoid is significantly decreased.
Modification of gene expression upon drug treatment
To gain deeper insight into the molecular mechanisms involved in the observed skeletal modi-fications, we analyzed the expression of several genes selected for their known function in bone formation. One class of genes codes for structural proteins such as collagens (Col1a1, Col1a2, Col10a1a) or bone specific ECM proteins such as secreted acidic cysteine rich protein (Sparc, previously named osteonectin or Osn), secreted phosphoprotein 1(Spp1, previously named osteopontin or Osp) and bone gamma-carboxyglutamate protein (Bglap, previously named osteocalcin or Ocn). The second class of interest consists of those genes coding for factors in-volved in regulation of cartilage and bone differentiation, including the pth1a gene coding for PTH as well as transcription factor genes dlx5a, dlx6a, runx2b and osx.
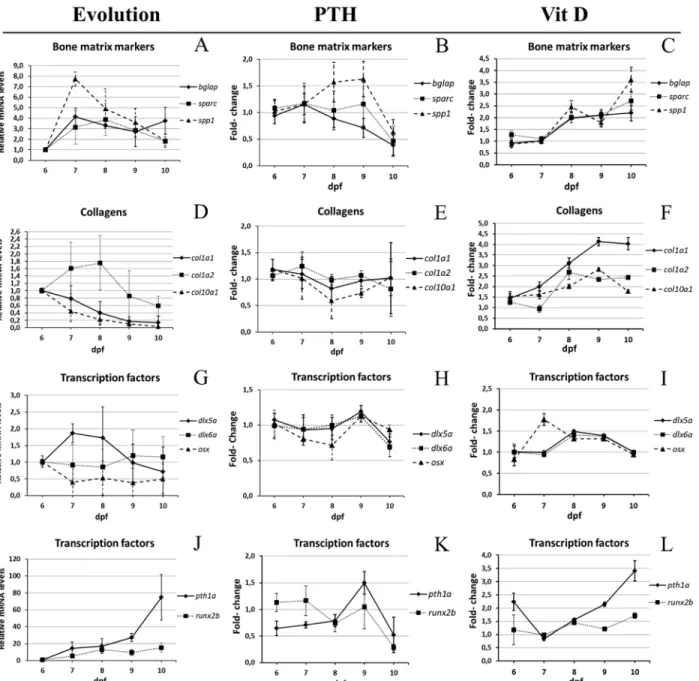
We first decided to follow the expression of these genes during the 6–10dpf period in un-treated animals, using the glyceraldehyde-3-phosphate dehydrogenase (gapdh) house-keeping gene as reference (selected from 3 candidate housekeeping genes, seeMaterials and Methods). Compared to their expression at 6dpf, we observe an increase of sparc, bglap, spp1 and col1a1 at 7dpf, followed by a decrease at 8dpf for sparc, bglap and spp1, while the col1a1 gene peaked at 8dpf and decreased its expression at later stages (Fig 4A and 4D). The pth1a gene expression strongly increased 76-fold during the 6–10dpf period, while runx2b displayed a 10-fold in-crease. The transcription factor gene dlx5a displayed an expression peak at 7 and 8dpf and de-creased after that, while dlx6a was unaffected and osx surprisingly revealed a 2-fold decrease from 6 to 7dpf (Fig 4G and 4J).
We then investigated the modulation of expression of these genes during drug treatment starting at 5dpf. Compared to untreated controls, VitD3 treatment led to a clear and significant increase in expression of all the structural protein genes: sparc, bglap, spp1, col1a1 and, to a less-er extent col1a2 and col10a1a (Fig 4C and 4F). These results correlate well with the observed in-crease in bone calcification observed at 10dpf. Among the regulatory factor genes, only pth1a revealed a strong up-regulation that increased during the treatment, while dlx5a and dlx6a were transiently induced at 8 and 9dpf. Finally, runx2b displayed a weak but significant in-crease up to 1.5-fold at 10dpf, and osx1 was only transiently induced 2-fold at 7dpf (Fig 4I and 4J).
On the other hand, relative to untreated controls, PTH treatment resulted in a transient in-crease of spp1 at 8–9dpf, while sparc, and bglap were unchanged before a dein-crease at 10dpf (Fig 4B). Surprisingly, no significant effect of PTH treatment was observed on the expression of the collagen genes (Fig 4E). Among the regulatory factors, osx expression remained constant, while pth1a, dlx5a, dlx6a and runx2b declined at 10 dpf (Fig 4H and 4K). Taken together, these ob-servations are consistent with the observed decrease in bone matrix calcification at 10dpf.
bone skeleton after VitD3 treatment revealed a significant increase of the distance between maxillae (m), consistent with a broader jaw as already observed by cartilage morphometry. The length of the head skeleton is also increased upon VitD3 treatment with a longer distance between the anterior part of the head (an) and the notochord (n), and between an and the parasphenoid (p) bone. Other measures are not significantly modified (A, C). B) PTH treatment caused an increase of the distance between the anterior part of the head and the summit“a” of the parasphenoid, mainly due to a significant decrease of the size of the parasphenoid (p) (C). Some structures are missing, such as the anguloarticular (aa), branchiostegal ray2 (br2), ceratohyal (ch) and/or maxilla (m). However, a significant broadening of the posterior head skeleton is revealed by the increased distance between left and right ("up" and "down")
branchiostegal rays1 (br1), entopterygoids (en) and also the opercula (o) (B). doi:10.1371/journal.pone.0126928.g002
Whole genome analysis of gene expression modulation by drugs
To obtain a global view of the physiological changes caused by PTH and VitD3 treatment, we performed a microarray whole genome expression analysis. We compared 6dpf control larvae to larvae treated between 5dpf and 6dpf with the corresponding compounds, in order to cap-ture early regulatory events rather then secondary regulations leading ultimately to the ob-served modulations of bone formation at 10dpf.
Four independent experiments were carried out and total RNA was extracted from control and VitD3-treated 6dpf larvae. A complete list of genes affected more than 1.3-fold (log2 fold change 0.4) by VitD3 treatment is given inS4 Table(p-value<0.1). Six genes were selected
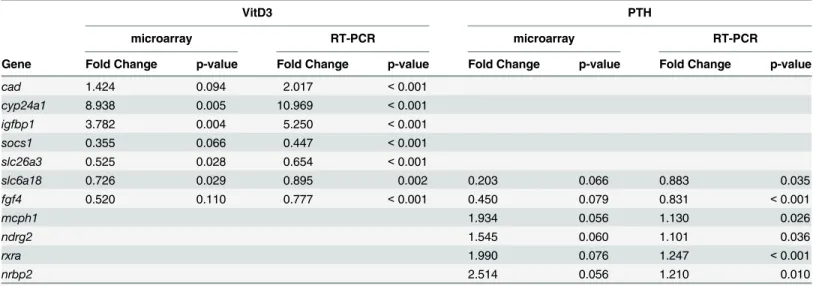
from the list for validation by RT-qPCR, which demonstrated the reliability of the microarray data (Table 1). Confirming that the VitD3 pathway was indeed activated, the most highly duced gene is cyp24a1, encoding a member of the cytochrome P450 superfamily of enzymes in-volved in the degradation of 1,25-dihydroxyvitamine D3. Modulation of the insulin pathway is indicated by the significant induction of igfbp1 and igf2. According to Ingenuity Pathway Anal-ysis (IPA; Materials and Methods), other biological functions that were affected by vitamin D treatment (S5 Table) are related to lipid, small molecule, amino acid, carbohydrate and drug metabolism, followed by organismal and cardiovascular system development. A striking fea-ture of the affected genes list is the abundance of genes involved in molecular transport, from ion channels to ATP-dependent pumps (S4 Table), consistent with a profound adaptation to the changes in metabolism that were also previously observed [75–77]. Among the transcrip-tion regulatory factors, we note the decreased expression of ppara and of foxo3, involved in lipid metabolism, as well as fosb and twist1, while klf11 and klf13 were significantly induced (S4 Table). As these experiments were performed using mRNA from the entire larvae, we at-tempted to focus on individual organ systems by filtering the affected gene set against available databases of genes involved in muscle or cartilage/bone function (GO annotation of human gene orthologs using IPA knowledge base). A network of regulatory interactions could be con-structed, comprising genes common to both systems and genes specific for each organ (S2 Fig). Major hubs, such as the protooncogene MYC controlling cell proliferation, components of the insulin-like pathway such as IGFBP1 and IGF2, or the cytokine receptor regulator SOCS1 are common to both systems. Specific to muscle, regulators such as PPARA or FOXO3 are down-regulated, while STAT3, mediating the cytokine receptor response, is up-regulated. Interesting-ly, muscle structural genes such as TTN (Titine) are inhibited. Other affected genes are bone-specific transcription factors, such as ATF4 and FOSB, a member of the WNT pathway (WNT3) or the carbohydrate (glycoprotein)-binding protein LECT1 (Lectin1).
PTH treatment between 5dpf and 6dpf resulted in less modulation of gene expression (S6 Table). Six genes were selected from the list to include up- and down-regulated genes for inde-pendent confirmation of the microarray expression results by RT-qPCR (Table 1). Interesting-ly, we observed a decrease (2.5-fold) in the expression of the endogenous pth1a gene (PTH in
S6 Table), thus confirming the previous RT-PCR results (Fig 4K) and suggesting that the PTH
Fig 3. Extent of bone formation in 10dpf larvae after 5days chemical treatments. Bone development is classified for each element into different categories: Absent (no structure present; red), early ossification (beginning of the bone ossification; yellow), advanced ossification (the structure is present and already developed as the control; green) and over ossification (the structure is more developed compared to the control; purple). Cumulated frequencies in % are represented for each element. As no significant difference was observed for paired structures between left and right (up and down), their scores have been combined. Statistical analysis was performed by X² of Pearson and a logistic regression. (A) Cumulated frequency after 5days VitD3 treatment. To obtain this, values were attributed to each element according to its category and added up for each larva: 0 for absent, 1 for early, 2 for advanced, and 4 for over ossification (B) Cumulated frequency after 5days PTH treatment.
treatment was effective, as the larvae exerted a compensatory response by decreasing endoge-nous PTH production. In rat and human osteoblastic cells, PTH receptor mRNA was shown to be down-regulated upon PTH treatment [78,79], in contrast we observe a significant induction (1.9-fold) of PTH receptor (pth1rb), suggesting more complex regulatory networks in using an in vivo model as opposed to in vitro cultures. Additional affected genes are the repressed cyp21a2 and hsd3b7, indicating a decrease in steroid degradation. The increased expression of rxra nuclear receptor mRNA (S6 Table) contrasts with the observed VitD3 effects (S4 Table),
Fig 4. Expression of bone-specific genes during development between 6 and 10dpf. (A,D,G,J) Specific mRNA levels at 6dpf relative to the gapdh house-keeping gene were used as reference, and then compared to the corresponding level in larvae of different age. (E-F,H-I,K-L) Specific mRNA levels in treated larvae were determined relative to the gapdh reference house-keeping gene and then compared to the corresponding level in untreated controls of the same age. (A-C) Bone matrix markers bglap, sparc, spp1. (D-F) Collagens col1a1, col1a2, col10a1a. (G-I) Transcription factors dlx5a,dlx6a and osx. (J-L) Parathyroid hormone pth1a and transcription factor runx2b.
doi:10.1371/journal.pone.0126928.g004
where pathways involving Rxra and its nuclear receptor dimerization partner Ppara were down-regulated (S4andS5Tables). IPA comparison between PTH and VitD3 effects reveals that, unlike the general metabolic effects exerted by VitD3, the most prominent biological func-tions affected by PTH treatment were related to cell development, signaling and embryonic de-velopment (S7 Table). The most highly developmentally affected systems were hematopoiesis and the skeletal, muscular and cardiovascular systems. Further analysis revealed up-regulation of a number of genes involved in or dependant on calcium metabolism, such as calreticulin (CALR), integrinα9 (ITGA9), calcitonin receptor like (CALCRL) or arginine vasopressin re-ceptor a1 (AVPR1A). Comparison of the genes affected by the two hormones exerting opposite effects on bone formation, VitD3 and PTH, revealed only 12 genes in common (Fig 5A and 5B). Using these 12 genes allows building a regulatory network around the protooncogene MYC and containing several genes that are differentially regulated in these two conditions (Fig 5A and 5C), suggesting opposing effects on mitochondrial (GSR), pyrimidine (CAD) or lipid metabolism (CES1).
Effects of hypergravity on bone and general development
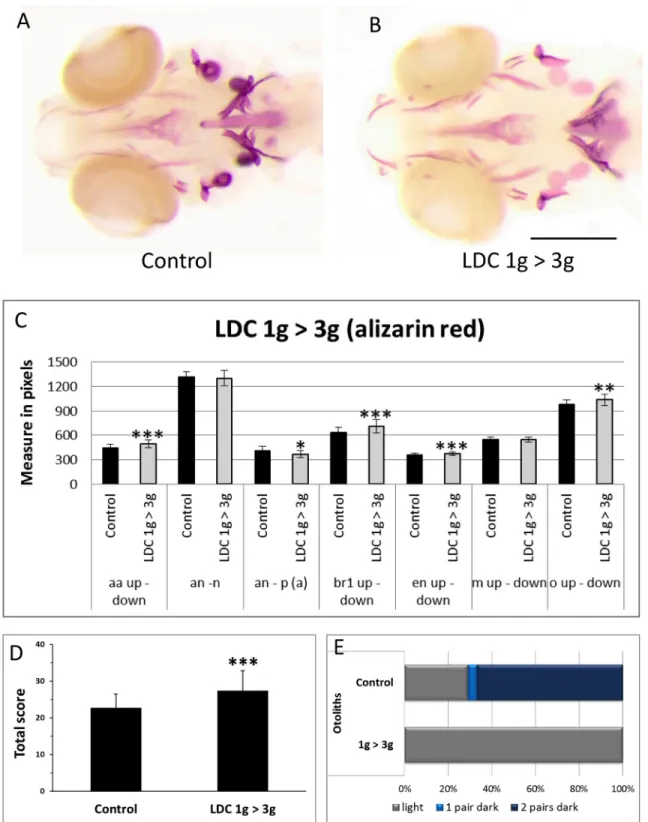
To compare the effects caused by bio-chemical or hormonal treatment on bone formation to those exerted by bio-physical/mechanical constraints, we investigated the effects due to in-creased gravity using the large diameter centrifuge (LDC) at the European Space Agency, ESA (Noordwijk, Netherlands). In a first experiment, zebrafish larvae were grown at normal gravity (1g) until 5dpf. One half of the population was brought to 3g hypergravity in the LDC for an-other 4 days, while the an-other half was kept at 1g (seeFig 6). At 9dpf, the larvae were stained with Alizarin red for bone matrix (Fig 7A and 7B) and analyzed as described above. No differ-ence was observed between the two samples when total length of the larvae or size of the eye or lens was determined (not shown). In the morphometric analysis, the 3g larvae present a larger head skeleton with a significant increase of the distance between the 2 anguloarticular bones, branchiostegal rays1, entopterygoid and the opercles (Fig 7C). In bone formation analysis (S3A
Table 1. Comparison of fold change values from the microarray dataset with those observed by RT-qPCR for VitD3 and PTH treatment.
VitD3 PTH
microarray RT-PCR microarray RT-PCR
Gene Fold Change p-value Fold Change p-value Fold Change p-value Fold Change p-value
cad 1.424 0.094 2.017 < 0.001 cyp24a1 8.938 0.005 10.969 < 0.001 igfbp1 3.782 0.004 5.250 < 0.001 socs1 0.355 0.066 0.447 < 0.001 slc26a3 0.525 0.028 0.654 < 0.001 slc6a18 0.726 0.029 0.895 0.002 0.203 0.066 0.883 0.035 fgf4 0.520 0.110 0.777 < 0.001 0.450 0.079 0.831 < 0.001 mcph1 1.934 0.056 1.130 0.026 ndrg2 1.545 0.060 1.101 0.036 rxra 1.990 0.076 1.247 < 0.001 nrbp2 2.514 0.056 1.210 0.010
The fold change and statistical significance (p-values) are given from the microarray data and the RT-qPCR confirmation experiments. The data for the genes selected for confirmation of microarray results, respectively for VitD3 or PTH, are shaded in grey. slc6a18 and fgf4 were chosen for their regulation by PTH and the results for VitD3 regulation are also shown
Fig,S8 Table), the anguloarticular, branchiostegal ray2 and hyomandibular presented a clear over ossification, while the ceratohyal presented a significantly higher proportion of advanced ossification. In contrast, the dentary, maxilla and entopterygoid were not significantly affected (S3A Fig). The global score obtained by addition of the scores of all the separate structures re-vealed a significant increase of bone formation (from a score of 23± 4 to 27± 5.5) (Fig 7D). A clearly weaker calcification was observed in the otoliths. More than 60% of the controls show 2 pairs of dark otoliths (Fig 7A, 7B and 7E) compared to only lightly stained otoliths in the 3g group.
In addition, total mRNA was extracted from the larvae at 6dpf and whole genome gene ex-pression was compared between larvae exposed for 1 day to 3g and 1g controls. The number of genes found to be modulated by hypergravity was 499, although the extent of induction or repression was surprisingly low (S9 Table), but significant as confirmed by RT-qPCR for 5 se-lected genes (S10 Table). Interestingly, among the affected biological functions (S11 Table),
Fig 5. Comparison of genes affected after PTH or VitD3 treatment between 5–6dpf. (A) List of common genes and their respective log2(fold change) in the two conditions. (B) Comparison of the number of genes affected by PTH or VitD3 treatment. The number of probes resulting in different hybridization signals is given, with the numbers in parenthesis and the graph showing the numbers of IPA-annotated genes. (C) Network constructed using the common genes and extended using the genes affected in one of the two conditions. The color overlay indicates the fold change after VitD3 (left) or PTH (right) treatment. Genes up-regulated (red), down-regulated (green), (*) indicates that the gene is represented by two or more probes on the microarray. doi:10.1371/journal.pone.0126928.g005
cellular and organism developmental processes ranked highest, only molecular transport appears in second position. More specifically, development and function of the skeletal and muscular sys-tem and connective tissue ranked highest, followed by the nervous and endocrine syssys-tems and fi-nally hematological and cardiovascular systems. Among the specifically affected genes, many transporter and ion channel genes are present, reminiscent of the observations after VitD3 treat-ment. Interestingly, among the transcription factors, vitamin D receptor (vdr) is weakly, but sig-nificantly down-regulated, similar to the nuclear receptor pparg. Other prominent transcription factor genes are the homeo-box containing pou3f3 and its potential partners meis1 and onecut1. Construction of specific networks in three different organ systems using IPA (S4 Fig) revealed the inhibition of hubs like MYC, PPARG, vitamin D receptor (VDR), NFKBIA inhibitor in all sys-tems, but also an extensive network specific to the cardiovascular system with, interestingly, a down-regulation of the growth factor receptor/Ras mediator gene GRB2.
Effects of reduced gravity on bone and general development: "relative
microgravity"
As an approach to investigate some of the effects on zebrafish physiology to be expected when going into real microgravity, we applied a protocol that we would qualify as "Reduced Gravity Paradigm" or "relative microgravity". The principle is to grow the zebrafish larvae for a defined
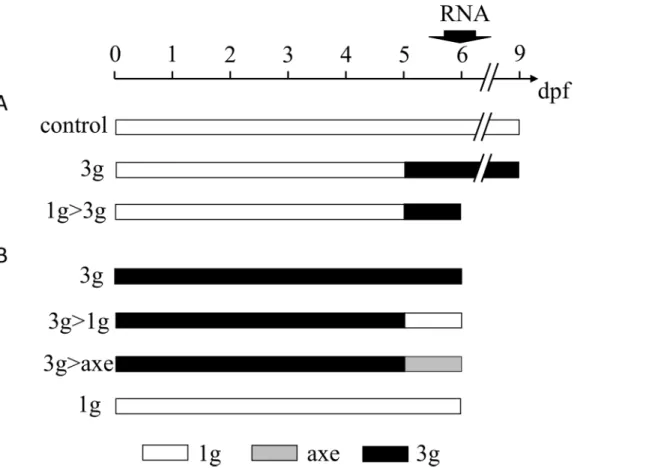
Fig 6. Schematic overview of the different hypergravity experiments. (A) larvae are placed at hypergravity at 5dpf until 9dpf (3g), while (control) larvae are kept at normal gravity for 9 days. Total mRNA was extracted at 6dpf and batches of larvae were fixed at 9dpf for Alizarin red staining of bone matrix. (B) Experiment in which the control larvae were placed at 3g and kept at 3g until 6dpf (3g), or returned at 5dpf to 1g outside (3g>1g) or on the axis of the centrifuge (3g>axe) for one day. An additional batch of larvae was kept at normal gravity until 6dpf (1g). RNA extraction and Alizarin red staining are performed at 6dpf. For abbreviations see legend toFig 1.
Fig 7. Effect of 3g hypergravity between 5–9dpf on bone formation. (A,B) Alizarin red staining of 9dpf control larvae (A) and larvae treated for 4 days in 3g hypergravity after 5 days at 1g (B). Ventral view, anterior to the left. (C) Comparison of morphometric measurements for some selected distances within the heads of control and 3g-treated larvae. Mean± SD and t-test analysis were calculated for each measure on at least 20 individuals. * p < 0.05, ** p < 0.01 and***p < 0.001. (D) Global score for bone formation in control and 3g treated larvae. (E) Comparison of cumulated frequencies of, respectively light, 1 pair dark or two pairs dark otoliths in control and 3g treated larvae. For abbreviations see legend toFig 1.
doi:10.1371/journal.pone.0126928.g007
period (5 days) in a hypergravity environment (this case 3g), before returning them to normal gravity for one additional day (Fig 6B). The effect of this decrease in gravity on bone formation and gene expression was then investigated.
Zebrafish fertilized eggs were subjected at 4hpf to 3g hypergravity until 5dpf. For compari-son, a parallel batch was grown at normal gravity outside of the centrifuge chamber (1g). The morphology of the embryos and larvae was monitored every day by microscopic observation, no striking effect was observed on developmental processes such as segmentation, organogene-sis or hatching time. Only a clearly decreased (delayed) pigmentation was observed at 24hpf (Fig 8A and 8B), which was rapidly resolved as pigmentation was indistinguishable in 1g and 3g embryos at 2dpf.
At 5dpf, the larvae exposed for 5 days to 3g in the LDC, were separated in three distinct batches, one was left in the LDC for another day (3g) while the other two were returned to nor-mal gravity for one day. One batch was kept in a separate incubator outside of the centrifuge chamber (3g>1g); the other was placed in an incubator positioned on the axis of the LDC (3g>axe), in order to maintain a rotation movement without increasing the gravitational force. The 1g batch continued to grow at normal gravity outside of the centrifuge chamber for the en-tire 6 days.
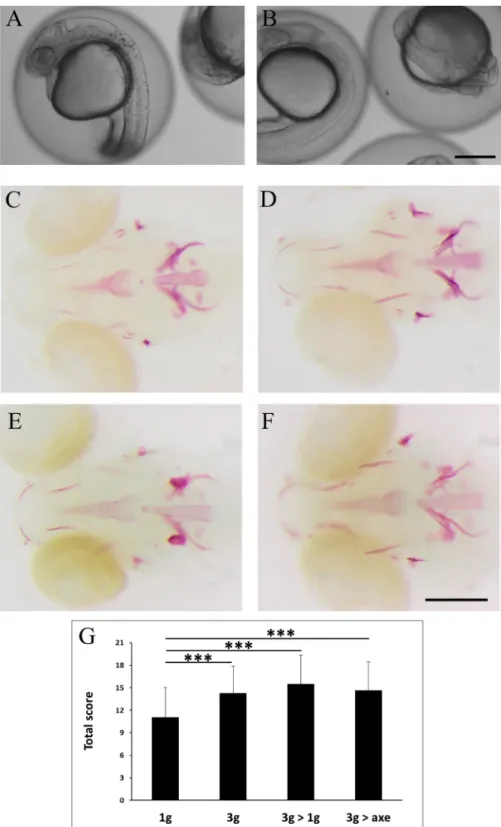
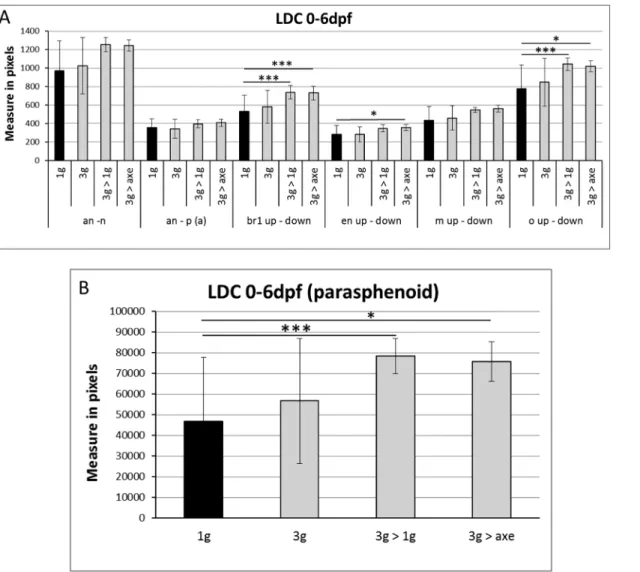
At 6dpf, all larvae were collected and stained for calcified structures using Alizarin red. Compared to larvae grown for 6 days at 1g, the bone structures in the head of all 3g exposed larvae appeared more intense (Fig 8C–8F), more specifically the anguloarticular, maxillary and, to a lesser extent the ceratohyal, hyomandibular and branchiostegal ray 1 (S12 Table). The global score was significantly increased in all samples exposed to 3g for 5 or 6 days (Fig 8G). Morphological analysis revealed a significant increase in the distance between branchiostegal rays 1, enteropterygoids and opercles, and an increase in the parasphenoid area (Fig 9).
A central gene network is rapidly activated in reduced gravity
At 6dpf, all larvae were collected and used for mRNA extraction. Gene expression was deter-mined by micro-array analysis, larvae exposed to 3g for the entire 6 days were chosen as con-trol (S13–S15Tables). Relative to this hypergravity sample, a remarkable similarity was observed in the biological functions affected in the normal gravity larvae (Table 2). Among the top ten functions modulated in each condition we found, on the one hand cell growth and pro-liferation, development, death and survival, organization and function, on the other hand em-bryonic and organismal (organ) development with a focus on connective tissue and
cardiovascular development in the 6 days control at 1g. Only 3g>axe larvae presented 7 affect-ed genes relataffect-ed to "auditory and vestibular system", relataffect-ed to their stay on a purely
rotating position.
When comparing the affected genes in the three conditions, it appears that 16 genes are common to all three (Fig 10), while 20 genes are common only to the 1g samples between days 5 and 6 (3g>1g and 3g>axe). Respectively, 69 and 20 genes are common between the static 1g for 1 day (3g>1g) or rotating 1g (3g>axe) for 1 day and the larvae having spent all 6 days at 1g (1g). Several genes, mostly common to all three conditions, were selected and the modulation of their expression was confirmed by RT-qPCR (S16 Table). Regulatory networks were con-structed using the genes common to all three conditions, but also using those common to the 1g for one day condition (3g>1g and 3g>1axe) (Fig 11). Strikingly, a network composed of 7 genes (FOS, FOSB, EGR1, EDN1, SOCS3, GADD45B, KLF2) that were affected in exactly the same manner in all three conditions could be constructed, indicating that they represent a cen-tral network that is affected by gravitational conditions. Most importantly, these cencen-tral genes were affected to the same extent, relative to the 3g for 6 days control, whether the larvae were
Fig 8. Effect of "relative microgravity" between 5–6dpf on bone formation. (A, B) comparison of pigmentation at 24hpf in 1g (A) and 3g (B) larvae. (C-F) Alizarin red staining of larvae kept at 1g until 6dpf (1g, C), control larvae kept at 3g until 6dpf (3g, D), larvae kept at 3g until 5dpf and returned to 1g off the centrifuge (3g>1g, E) or on the axis (3g>axe, F), Ventral view, anterior to the left. (G) Global scores for bone formation in control and the different treated larvae.
doi:10.1371/journal.pone.0126928.g008
kept at 1g during the entire experiment or only for the last day, suggesting that their expression levels are specific to this gravitational condition and are rapidly (within one day) adapted to new conditions. Five additional genes (MVP, HBE1, HES5, SOX10, LGALS3BP) were only af-fected after 1 day at lower gravity (both 3g>1g and 3g>1axe), indicating that they may be actu-ally involved in the mechanism for rapid adaptation to lower gravity. Further analyses were performed using all the genes common to any two of the conditions (S5 Fig), also analyzed ac-cording to their potential function in individual organ systems (S6 Fig). By extending the net-work that way, other nodes become apparent, such as the nuclear receptor PPARG, the protein chaperone HSP90AA1 and the regulatory peptide endothelin (EDN1) (S5 Fig). Expression of NFKBIA, a target gene for the NFkB pathway coding for an inhibitor of this pathway, was de-creased in two conditions, potentially causing the dede-creased expression of the antiproliferative factor BTG2 [80] observed in all three conditions.
Finally, we compared the genes affected in the 1g>3g experiment, which experienced a shift from 1g to 3g on day 5, with those affected in the 3g>1g experiment where the larvae were re-turned to 1g after 5 days at 3g. Among the affected genes, 41 were common to both
Fig 9. Morphometric analysis of bone elements at 6dpf after "relative microgravity”. The distances are measured in pixels. Mean ± SD and t-test analysis were calculated for each measure on at least 20 individuals. (A) Distances between the different cranial bone elements. (B) Area of the parasphenoid bone.* p < 0.05 and ***p < 0.001. For abbreviations see legend toFig 1.
Table 2. Biological functions associated to "relative microgravity"-affected genes.
1g 3g> axe 3g> 1g
Category p-value N p-value N p-value N
Cellular Growth and Proliferation 5.71E-11-4.98E-03 181 6.87E-07-6.95E-03 70 5.78E-09-3.15E-03 213
Cell Cycle 1.15E-10-4.98E-03 93 3.61E-05-7.6E-03 20 8.79E-06-2.63E-03 85
Organismal Survival 8.1E-09-8.1E-09 119 1.23E-04-7.24E-03 46 1.87E-06-3.23E-03 139 Cellular Development 4.9E-08-4.98E-03 156 6.89E-08-8.09E-03 60 2.17E-06-3.31E-03 205
Connective Tissue Development and Function 4.9E-08-4.98E-03 44 1.55E-04-6.95E-03 26 1.91E-05-3.3E-03 75
Tissue Development 4.9E-08-4.6E-03 104 6.89E-08-8.11E-03 65 2.26E-06-3.31E-03 177 Cell Death and Survival 1.79E-07-4.99E-03 157 6.01E-09-8.25E-03 59 1.49E-10-3.35E-03 203 DNA Replication. Recombination. and Repair 1.11E-06-4.98E-03 77 4.27E-03-7.37E-03 7 2.22E-03-2.63E-03 8
Cardiovascular System Developt and Function 9.78E-06-3.03E-03 28 1.1E-05-7.81E-03 28 3.76E-06-3.02E-03 92
Hematological System Developt and Function 9.78E-06-4.98E-03 57 4.53E-05-8.11E-03 32 6.3E-06-3.31E-03 114 Cellular Assembly and Organization 1.75E-05-4.98E-03 80 4.21E-06-7.65E-03 42 1.83E-05-3.02E-03 90 Cellular Movement 2.64E-05-4.55E-03 94 2.43E-04-7.89E-03 35 1.82E-06-3.02E-03 132
Cell Morphology 3.38E-05-3.03E-03 89 2.43E-04-7.65E-03 47 7.12E-08-2.7E-03 144
Amino Acid Metabolism 4.27E-05-4.98E-03 23 2.37E-03-6.69E-03 3 1.08E-05-1.83E-03 13 Small Molecule Biochemistry 4.27E-05-4.98E-03 100 1.6E-05-7.6E-03 36 1.08E-05-2.74E-03 72 Embryonic Development 4.66E-05-4.98E-03 83 6.89E-08-7.81E-03 52 2.46E-07-3.22E-03 141
Organismal Development 4.66E-05-4.93E-03 85 6.89E-08-7.81E-03 63 2.46E-07-3.22E-03 203
Cell-To-Cell Signaling and Interaction 7.89E-05-4.39E-03 27 6.44E-05-7.6E-03 17 2.07E-03-2.07E-03 7 Cellular Function and Maintenance 1.27E-04-4.39E-03 67 4.21E-06-7.65E-03 37 1.83E-05-3.02E-03 148
Energy Production 1.72E-04-2.24E-03 22 5.95E-03-7.37E-03 6
Lipid Metabolism 1.72E-04-4.98E-03 60 6.84E-05-7.6E-03 30 4.52E-05-2.74E-03 58
Renal and Urological Developt and Function 1.72E-04-2.93E-03 25 2.04E-04-7.6E-03 5 2.56E-03-2.56E-03 2 Nucleic Acid Metabolism 1.74E-04-3.03E-03 36 1.6E-05-7.37E-03 15 2.63E-03-2.63E-03 3 Tissue Morphology 1.75E-04-4.98E-03 80 4.53E-05-7.81E-03 47 2.49E-06-3.15E-03 129
Cellular Compromise 2.25E-04-9.79E-04 13 5.37E-04-7.6E-03 15 4.79E-04-9.19E-04 9
Molecular Transport 2.25E-04-4.98E-03 89 1.6E-05-7.6E-03 41 4.52E-05-2.74E-03 106 Lymphoid Tissue Structure and Developt 2.29E-04-4.55E-03 24 1.18E-03-6.38E-03 17 2.24E-05-3.01E-03 36
Gene Expression 4.45E-04-4.39E-03 83 2.04E-04-7.81E-03 37 6.97E-08-2.28E-03 134
Carbohydrate Metabolism 5.2E-04-3.1E-03 43 6.84E-05-7.52E-03 19 2.63E-03-2.63E-03 3
Hematopoiesis 5.21E-04-4.55E-03 10 2.78E-03-7.76E-03 14 6.3E-06-3.31E-03 70
Hair and Skin Development and Function 6.67E-04-4.49E-03 19 1.88E-03-1.88E-03 6 8.79E-06-3.35E-03 47 Nervous System Developt and Function 8.28E-04-4.98E-03 40 8.72E-06-7.6E-03 46 2.37E-05-2.7E-03 76
Organ Morphology 8.73E-04-3.03E-03 18 3.32E-05-6.97E-03 33 4.58E-06-3.11E-03 87
Organ Development 1.06E-03-4.24E-03 33 1.25E-06-7.6E-03 35 2.26E-06-3.01E-03 109 Skeletal and Muscular Developt and Function 1.06E-03-4.28E-03 34 1.55E-04-7.6E-03 23 2.26E-06-3.11E-03 67 Immune Cell Trafficking 1.54E-03-1.71E-03 3 8.11E-03-8.11E-03 5 2.23E-04-2.79E-03 53
Reproductive System Developt and Function 1.54E-03-4.6E-03 10 2.37E-03-7.6E-03 8 1.21E-03-2.81E-03 21
Visual System Development and Function 1.7E-03-1.71E-03 6 1.25E-06-4.5E-03 17 4.58E-06-1.78E-03 35 Post-Translational Modification 1.71E-03-4.98E-03 4 8.8E-05-5.83E-03 15 3.03E-04-1.43E-03 48 Digestive System Development and Function 2.64E-03-4.24E-03 8 1.17E-04-8.04E-03 24 6.28E-05-1.79E-03 52
Hepatic System Development and Function 2.64E-03-4.24E-03 6 2.04E-04-6.95E-03 15 1.02E-04-7.51E-04 28
Protein Synthesis 2.98E-03-2.98E-03 41 8.8E-05-3.54E-03 27 2.6E-04-2.24E-03 66
Vitamin and Mineral Metabolism 3.55E-03-3.55E-03 8 1E-03-3.18E-03 6 2.56E-03-2.56E-03 2
Organismal Functions 4.98E-03-4.98E-03 2 6.73E-04-4.27E-03 8 3.15E-03-3.15E-03 13
Protein Trafficking 4.98E-03-4.98E-03 2 2.45E-03-2.45E-03 19
Cell Signaling 8.8E-05-5.02E-03 14 6.4E-04-1.05E-03 46
(Continued ) Zebrafish Bone and General Physiology in Hyper-Gravity
experiments (Fig 10) that could be assembled in a regulatory network (S7 Fig). Two regulatory genes attracted our attention due to their increased expression in the 3g environment (note the fold change relative to the 1g control in the 1g>3g, and relative to the 3g sample in the 3g>1g experiment): SOX3 is a transcription factor shown to be involved in neural, pituitary and cra-niofacial development [81], while the HEY1 gene is a target of Notch signaling and was shown to regulate bone homeostasis [82]. Two other genes, coding for embryonic hemoglobin HBE1 and the oligopeptide transporter SLC15A1 were down-regulated at 3g.
Discussion
Zebrafish present remarkable degrees of similarity with mammals in the molecular mecha-nisms involved in their developmental biology and physiology. Moreover, their ease of hus-bandry, high fecundity, and small size paves the way for a possible future space experiment, triggering the proposal of their use for the study of gravitational biology [83–89]. We decided to explore the effects of increased gravity (hyper-g) on zebrafish larvae using the large diameter centrifuge (LDC). This device allows applying a well-controlled and constant centrifugal force (1g-20g) by minimizing, through the large diameter of the rotating arms, the possible effects of Coriolis force [64].
Our aim was to concentrate on the effects on bone formation, therefore we chose to start the experiments at 5dpf, when perichondral ossification is taking place within all major cranial car-tilage elements and intramembranous bone formation is ongoing. We evaluated the effects on cartilage and bone formation by staining these structures after several days of treatment, at 9 or 10dpf. For a more detailed, more accurate and more objective evaluation of skeletal develop-ment, we developed two different, but complimentary methods for analyzing images of stained zebrafish larvae. The first one uses a number of landmarks placed manually within the images (using the software environment CYTOMINE) and allows automatic extraction of distances and angles between these landmarks, ultimately resulting in a morphometric description of the head skeleton. The second one is based on manually assigning a developmental score to each cranial bone element within each image, enabling us to calculate a mean score for each element and a global score for each individual.
To validate these approaches, we performed two treatments of zebrafish larvae whose effects had been previously described [63]. The first treatment uses exogenous vitamin D3 (VitD3) [90] to increase bone formation, indeed the general VitD3 metabolism in teleosts is similar to that in mammals, teleosts possess two vitamin D receptors (VDRs) and knock-down of VDRa expression causes a decrease of calcium ion uptake [90]. PTH and related peptides are known hypercalcemic agents in mammals, however their function is more controversial in teleosts, de-pending on the species [91]. Although teleosts do not present a parathyroid gland, they do
Table 2. (Continued)
1g 3g> axe 3g> 1g
Category p-value N p-value N p-value N
Protein Degradation 3.54E-03-3.54E-03 13 2.24E-03-2.24E-03 13
Behavior 3.61E-04-3.82E-03 22 5.52E-06-3.15E-03 77
Auditory and Vestibular System Developt and Function 5.5E-04-3.82E-03 7
Ingenuity Pathway Analysis of the lists of genes affected at 6dpf after 6 days at 1g (1g), or after 5 days at 3g and returned to 1g on the centrifuge axis (3g>axe) or outside of the centrifuge room (3g>1g), each time compared to 3g hypergravity treatment for 6 days (3g). Columns indicate respectively the function, the range of p-values (significance) associated to various sub-functions, and the number of genes concerned (N).
produce PTH in the gills, probably in cells identified by the expression of gcm2, a gene whose orthologues are required for parathyroid development in chicken and mouse [92,93]. PTH ad-ministration induced hypercalcemia in fugu (Tetraodon nigrividans) by inducing both osteo-blast and osteoclast function and by decreasing scale calcium content [94]. Genes homologous to the mammalian PTH-related peptides (PTHrP) were found in teleosts, they are more widely expressed [95], they increase calcium uptake in sturgeon (Acipenser nacarii) [96]and were shown to play different roles in craniofacial development in zebrafish [97]. Blocking PTH sig-naling through the use of a PTH/PTHrP antagonist resulted in a decreased hypercalcemic
Fig 10. Number of genes affected in the various hypergravity experiments. The absolute number of probes resulting in a statistically significant hybridization signal is given for each condition. In parentheses, the corresponding number of genes with an annotation in IPA is given, while the Venn diagrams represent the number of genes unique to each condition and genes common to two or three conditions.
doi:10.1371/journal.pone.0126928.g010
Fig 11. Network of genes affected in "relative microgravity" experiments. A network was constructed using the genes common to all three experiments, or the genes common only to 3g>1g and 3g>axe. Color overlay indicates the fold change relative to the 3g sample taken as control. Genes up-regulated (red), down-regulated (green), (*) indicates that the gene is represented by two or more probes on the microarray. doi:10.1371/journal.pone.0126928.g011