HAL Id: halshs-01828656
https://halshs.archives-ouvertes.fr/halshs-01828656
Preprint submitted on 3 Jul 2018HAL is a multi-disciplinary open access
archive for the deposit and dissemination of sci-entific research documents, whether they are pub-lished or not. The documents may come from teaching and research institutions in France or abroad, or from public or private research centers.
L’archive ouverte pluridisciplinaire HAL, est destinée au dépôt et à la diffusion de documents scientifiques de niveau recherche, publiés ou non, émanant des établissements d’enseignement et de recherche français ou étrangers, des laboratoires publics ou privés.
Container Port Hierarchy and Connectivity based on
Network Analysis
Nikola Kutin, Marie-Sabine Saget, Thomas Vallée
To cite this version:
Nikola Kutin, Marie-Sabine Saget, Thomas Vallée. Container Port Hierarchy and Connectivity based on Network Analysis. 2018. �halshs-01828656�
EA 4272
Container Port Hierarchy and
Connectivity based on Network
Analysis
Nikola Kutin*,**
Marie-Sabine Saget*
Thomas Vallée*
2018/10
(*) LEMNA - Université de Nantes
(**) National University of Management (Cambodge)
Laboratoire d’Economie et de Management Nantes-Atlantique Université de Nantes
Chemin de la Censive du Tertre – BP 52231 44322 Nantes cedex 3 – France
http://www.lemna.univ-nantes.fr/ Tél. +33 (0)2 40 14 17 17 – Fax +33 (0)2 40 14 17 49
Docum
ent
de Tra
vai
l
W
or
ki
ng P
ape
r
1
CONTAINER PORT HIERARCHY AND CONNECTIVITY BASED ON
NETWORK ANALYSIS
Nikola KUTIN, Marie-Sabine SAGET, Thomas VALLEE
Nikola KUTIN
Laboratoire d'Economie et de Management de Nantes-Atlantique (LEMNA), University of Nantes, Nantes, France & National University of Management, Phnom Penh, Cambodia
Marie-Sabine SAGET
IAE-Nantes, University of Nantes, Nantes, France
Thomas VALLEE
Laboratoire d'Economie et de Management de Nantes-Atlantique (LEMNA), University of Nantes, Nantes, France
This work was supported by the European Union’s Erasmus+ Programme, Key Action 2, Capacity building in the field of higher education under DOCKSIDE Project (www.dockside-kh.eu), Grant number 573790-EPP-1-2016-1-FR-EPPKA2-CBHE-SP.
2
CONTAINER PORT HIERARCHY AND CONNECTIVITY BASED ON
NETWORK ANALYSIS
Nikola KUTIN, Marie-Sabine SAGET, Thomas VALLEE
Abstract
This study aims to analyze port hierarchy between 153 container ports. For this purpose, a network analysis was conducted. Particular attention was paid to 68 ports from the ASEAN+31 community. We have created five director weighted networks at both port and
country levels. Results reveal that the prevailing structure of the global maritime network is hub and spoke, and that the port rankings change according to different centrality measures. Regarding the intra-ASEAN+3 connectivity, ASEAN member states form a cluster of interconnected ports. A comparative analysis shows that both the Export and Maritime connectivity networks have similar patterns, which indicates that the containerized trade within ASEAN+3 has the same features as the intra-regional exports.
Keywords: Network, ASEAN, Trade, Shipping, Connectivity, Centrality
1 Member States of the Association of Southeast Asian Nations (ASEAN), the People’s Republic of
3 1. Introduction
Maritime transport is the cheapest and most efficient way to transport goods in large quantities. According to data from Clarkson Research, containerized trade has increased by more than 600% since 1990. This has dramatically changed the character of ports’ infrastructure. Due to the expansion of ports’ hinterlands, shipping lines have been able to streamline their itineraries by reducing the number of ports of call, creating load-centre ports (hub ports). It also induced a further increase in vessel size, along with a growth in terminal area (Midoro, Musso, and Parola 2005). Indeed, Notteboom (2010) stated that ‘the success of the port is strongly affected by the ability of the port community to fully exploit synergies with other transport nodes.’
Furthermore, the maritime network is a complex subject due to the fact that its prevailing structure is ‘hub and spoke’. Asgari, Farahani, and Goh (2013) define a hub port as a port that connects regional ports (feeder lines) to other hub ports (global network). Such hub ports might exhibit different purposes or importance within a network. Some ports such as Singapore and Hong Kong have a strategic geographical position and play an important intermediate role in connecting other regional ports to major sea trade routes, while others like Shenzhen are a gateway to large manufacturing centres situated in the hinterland (Wang and Cullinane 2016). Therefore, analysing the position and the purpose of a port within a network is essential to understanding the nature of the liner shipping network.
According to the International Maritime Organization, over 90% of the world’s trade is carried out via sea. Hence, it is interesting to analyze whether a network based on the maritime connectivity has similar features to the network related to the value of countries’ total exports. An
4
interesting case study is the ASEAN+32 community which aims to promote regional economic integration in Eastern and South-Eastern Asia. According to Tongzon and Lee (2015) this integration may result in lower shipping costs and improved quality of shipping throughout the region, and thus contribute to an improvement in the ASEAN members’ trade performance and international competitiveness.
This research aims to determine the characteristics of the maritime and trade networks at port and country levels by using the graph theory and centrality measures. For this purpose, a dataset of 153 ports from 50 countries, including statistics for 6,410 maritime routes in the year 2014, was used. Particular attention was paid to a subset of 68 ASEAN+3 ports, including 38 designated ports of the ASEAN Single Shipping Market (ASSM). This paper attempts to answer the following research questions: What are the characteristics of the global maritime shipping network? What are the key ports in the network and what is their main purpose (transhipment port, gateway port, regional port, etc.)? What is the position of the ASEAN community in the global shipping network? How are the regional maritime connectivity networks at port and country levels organized within the ASEAN+3 community? Are there any fundamental differences between maritime connectivity and countries’ exports of all goods?
The remainder of this paper is as follows: Section 2 discusses the literature related to ports’ connectivity and maritime trade. Section 3 explains the methodology related to the Network Analysis and the dataset used in the study. All results are depicted in Section 4. Lastly, a discussion on the outcomes of the study is provided in the final section.
2 ASEAN+3 community includes all member states of the Association of Southeast Asian Nations
5 2. Review of the literature
2.1. Network Analysis in the context of maritime transport
While the main ports and shipping routes have been described in a number of studies, the structure and evolution of the global maritime network, as well as some crucial issues such as unequal traffic distribution and port hierarchies, has not been fully documented (Ducruet and Notteboom 2012; Ducruet 2013). It is important to analyze the ports’ connectivity because even a small change in the network can cause shipping carriers to modify their shipping routes in order to meet the demands of the shipping markets (Peng et al. 2016). A suitable method to measure the connectivity of container ports is Network Analysis. It allows for the identification of port clusters, which may result in agglomeration economies and a strengthened bond between individual and organizational linkage networks (Yang, Wang, and Li 2016). Such an analysis is a good complement to traditional measures of individual throughput (Ducruet, Rozenblat, and Zaidi 2010).
The cost effectiveness and production efficiency of ports are closely linked to the optimization of their networks. John et al. (2016) applied Bayesian belief networks to identify various influencing variables related to different risk factors in a seaport system. Peng et al. (2016) used a mixed-integer nonlinear stochastic programming model and showed that the deployment of the containers handled at each seaport was not directly related to its throughput capacity. In a study conducted by Wang and Cullinane (2016), Freeman’s centrality measures were estimated in order to determine the importance of a given port at both regional and global levels. The degree centrality
6
measures revealed that the key port in the network was Shenzhen. In terms of closeness centrality, which is related to the number of connections with diverse ports, Shanghai, Hong Kong and Singapore had the highest scores. In addition, the betweenness centrality measures pointed out that Hong Kong and Singapore are also hubs connecting different clusters of tightly connected ports.
Notteboom (2010) conducted a detailed container traffic analysis for the period 1985–2008 for 78 ports. His study showed that the performance of European ports was related to their position within supply chains and networks. There is also a gradual deconcentration process in the container handling market, though it remains more concentrated than other cargo handling segments. Ducruet (2013) applied network simplification techniques based on linkage analysis which removes from each port all its links except the largest one. His study revealed that the most diversified ports have a high level of centrality and dominance in the network. They are also connected with more ports situated at a longer physical distance. On the other hand, the most specialized ports capture the majority of global traffic, although their average connection distance is lower due to their distribution role at the intra-regional level.
2.2. Maritime and Trade networks in ASEAN+3 community
Since the establishment of ASEAN maritime transport cooperation, ASEAN Member States have been working to promote the progressive liberalization of maritime transport to improve the region’s maritime performance and international competitiveness (ASEAN 2017). Regarding the development of the ASEAN transport network, Banomyong (2015) applied the Geographical Simulation Model (GSM) to analyze the effects of the implementation of The Master Plan on ASEAN Connectivity (MPAC) by the member states. The study shows that port
7
development is mostly concentrated in specific locations and in countries with better trade facilitation, and that the positive effect it entails could spread to non-ASEAN member states such as Japan, China and India which have a better trade facilitation environment. According to the Liner Shipping Index, computed by UNCTAD, the ASEAN community has had steady progress in terms of integration into the global network. However, the index varies across countries and additional efforts are needed to strengthen the maritime connectivity in order to realize the ASEAN Single Shipping Market (ASEAN 2017). Therefore it is necessary to analyze ASEAN port integration within the regional and global networks, and the relations with ASEAN’s closest trade partners: People’s Republic of China, Japan, and the Republic of Korea.
There have been a few case studies regarding the countries in the ASEAN+3 community. Sutomo and Soemardjito (2012) applied Multi-criteria Analysis, Analytical Hierarchy Process and Graph Theory to detect the most efficient ports in Indonesia. Their analysis was conducted with a sample of 18 ports with respect of the density of the transportation infrastructure, the capacity of the port, and the speed of goods movement to ports. Zaman, Vanany, and Awaluddin (2015) used the Gravity Model to analyze the connectivity of 12 Indonesian ports. By taking into account the ports’ facilities, the size of the regional economies, supporting infrastructure (highways, roads, import and export zones, etc.) and connectivity (global, regional and national), the study identified the ports which could play the role of hub under various scenarios. A recent study from Fahmiasari and Parikesit (2017) assessed the efficiency of two plans used for the creation of an integrated container shipping network in Indonesia. They used a few network efficiency indices by taking into account the demand (TEU per year) at the port’s origin and destination, ocean freight rates, and the port’s connectivity. They concluded that the government should develop the least important ports in the network in order to improve the efficiency of intra-national trade and avoid
8
empty return containers. Lam and Yap (2011) analyzed slot capacity in terms of TEUs – i.e. vessel capacity based on 3000 container shipping services from 1995 to 2006 for the Eastern Asian ports of Shanghai, Ningbo, Busan and Kaohsiung. The study found that inter-container port complementarity accounted for a significant share of changes to shipping capacity and that the ports periodically restructured their networks to adjust to the demands of the market.
Similar to shipping networks where we see flows of containers between ports of origin and destination, trade flows of goods and services between countries can be represented by directed graphs where all edges are potentially bidirected, as long as exports and imports between two countries are of nonzero values (Nguyen, Pham, and Vallée 2016). An analysis of both trade flows and FDI flows within ASEAN+3 countries was recently conducted by Nguyen, Pham, and Vallée (2017). They concluded that during the 1990-2012 period, the degree of trade and FDI integration varied among the ASEAN+3 member states. Furthermore, ASEAN+3’s intra-regional trade network seemed to be more densely connected than its intra-regional FDI network, and large or advanced countries tend to be better linked and form a sub-regional bloc of tightly connected economies.
2.3. Adding value to the literature
We have not found any studies in the literature comparing the trade and maritime networks. We expect some similarities between the two networks since 90% of exchanged goods are carried via sea (Ducruet 2013). The position of the ASEAN community within the global shipping network, as well as the connectivity of the designated ASEAN container ports, are topics which
9
also require additional research. Furthermore, most of the studies analysing the importance of various ports use a very limited sample size.
This research adds value to the literature by providing a comprehensive analysis of different types of networks at port and country levels using a sample of 6,410 maritime routes connecting 153 major ports around the world. Since we have almost all the major ports in the ASEAN+3 community, we can conduct an analysis on their intra-regional maritime and trade connectivity. The Network Analysis involves the computation of different centrality measures, allowing us to identify different clusters of tightly linked ports/countries. The method also detects nodes having the highest connectivity, good strategic location, and important intermediate connections. We also identify hub ports, which concentrate most of the maritime traffic or trade of goods between highly connected ports in the network. The findings of this study provide a foundation for understanding the typology of the global shipping industry, as well as the role of different ports/countries and communities within the network.
3. Methodology and data
Network analysis is the process of investigating complex structures through the use of graph theory (Otte and Rousseau 2002). It has been used in a variety of studies, with the nodes representing individuals, organizations, or even countries, and the ties can refer to communication, cooperation, friendship, or trade. Ties can be differentiated in most settings (Opsahl, Agneessens, and Skvoretz 2010). Freeman (1978) developed the well-known centrality measures such as Degree, Closeness and Betweenness for binary directed and undirected networks. Degree centrality assesses the number of connections of a node with the other individuals in the network.
10
Closeness centrality shows how easily a node can be reached by other nodes, and betweenness centrality describes how important a node is in terms of connecting other clusters of individuals (Jackson 2010). These measures have been conceptualized for weighted networks (Newman 2001; Borgatti 2005; Brandes 2001; Barrat, Barthélemy, and Vespignani 2004; Opsahl, Agneessens, and Skvoretz 2010).
3.1. Network Analysis based on centrality measures in the context of maritime trade
Maritime transport, and containerized trade in particular, consists of carriers transporting goods from port of origin to a given destination. Network analysis has been used by Wang and Cullinane (2016) and Ducruet (2013) to analyze port hierarchy and connectivity. We use directed weighted graphs, where the importance of the flow between the nodes depends on the edges’ weights which can be represented by the value of exports, or, the average size of ships multiplied by the number of trips. In this study, the nodes are either a port or a country.
3.2. Variables and data
Data on port connectivity was obtained from Lloyd’s Marine Intelligence Unit. It contains information about port to port connectivity in 2014, and consists of 153 ports from 51 countries, including 79 ports in Asia, 27 in North America, 20 in Europe, 19 in Africa and 8 in Latin America and the Caribbean. There are 6,410 direct maritime routes connecting the ports in the sample:
Container port of origin (Source, port i) Container port of destination (Target, port j)
11
Average size of the ships in TEU going from port i to port j (AvgTEUij)
Number of trips from port i to port j (NbTripsij)
Data were also aggregated at a country level in order to analyze the interactions between the states in the sample:
Country of departure, Source (country a) Country of arrival, Target (country b)
Average size of the ships in TEU going from country a to port b (AvgTEUab)
Number of trips from port A to port B (NbTripspab)
The export dataset was collected from UN ComTrade3 commodity databases in the Standard International Trade Classification (SITC) Revision 3. It contains the exports in USD for ASEAN + 3 states (EXPab).
3.3. Networks
Recall that each maritime route connects a port of origin and a port of destination. In order to analyze the global shipping network as well as the regional networks of the ASEAN+3 community, we built five directed weighted networks named the following: ‘Maritime Port Network’, ‘Maritime Country Network’, ‘ASEAN+3 Maritime Port Network’, ‘ASEAN+3 Maritime Country Network’ and ‘ASEAN+3 Export Country Network’.
12
In the case of maritime networks at port and country levels, the links between each pair of ports/countries are weighted according to the number of trips multiplied by the average size of the vessels operating on a maritime route. This indicator not only shows the frequency of the services (𝑁𝑏𝑇𝑟𝑖𝑝𝑠) but also the relative importance of the container trade flows on the maritime routes 𝐴𝑣𝑔𝑇𝐸𝑈. Type of network Type of nodes No of nodes No of edges Weight of edges Maritime Port Network Ports 153 6410 𝑤𝑖𝑗 = 𝐴𝑣𝑔𝑇𝐸𝑈𝑖𝑗 ∗ 𝑁𝑏𝑇𝑟𝑖𝑝𝑠𝑖𝑗 Maritime Country network Countries 51 2490 𝑤𝑎𝑏 = 𝐴𝑣𝑔𝑇𝐸𝑈𝑎𝑏∗ 𝑁𝑏𝑇𝑟𝑖𝑝𝑠𝑎𝑏 ASEAN+3 Maritime Port Network Ports 68 1745 𝑤𝑖𝑗 = 𝐴𝑣𝑔𝑇𝐸𝑈𝑖𝑗 ∗ 𝑁𝑏𝑇𝑟𝑖𝑝𝑠𝑖𝑗 ASEAN+3 Maritime Country Network Countries 13 135 𝑤𝑎𝑏 = 𝐴𝑣𝑔𝑇𝐸𝑈𝑎𝑏∗ 𝑁𝑏𝑇𝑟𝑖𝑝𝑠𝑎𝑏 ASEAN+3 Export Country Network Countries 13 156 𝑤𝑎𝑏= 𝐸𝑋𝑃𝑎𝑏
Table 1. Type of networks and weighting
Table 1 depicts some basic features of the networks at port and at country levels. In the maritime network ‘ASEAN+3 Export Country Network’, the edges are weighted according to the value of exports in USD (𝐸𝑋𝑃). This indicator allows us to assess the importance of the trade between countries for all goods. Appendix 1 shows additional descriptive statistics about the variables that we used in this study.
13 3.4. Centrality measures used in this study
In order to analyze the different types of networks, and the hierarchy of ports or countries within them, we have computed a set of centrality measures for weighted directed graphs. The weight of the edges are according to the type of network and nodes (Table 1).
3.4.1. Weighted degree Centralities
In the case of directed graphs, there are two types of degree centralities, Indegree and Outdegree. The former shows the sum of all edges that are directed (pointing in) to node 𝑖 while the latter depicts all edges that are going out from the node 𝑖. Mathematically, both measures can be represented by equations 1 and 2.
𝑤𝑠𝑖𝑜𝑢𝑡 = ∑ 𝑤𝑁𝑗 𝑖𝑗 (1) 𝑤𝑠𝑖𝑖𝑛 = ∑ 𝑤𝑁𝑗 𝑖𝑗 (2)
𝑤𝑠𝑖𝑜𝑢𝑡 and 𝑤𝑠𝑖𝑖𝑛 refers to the weighted Outdegree and Indegree centralities of node 𝑖, which are the sum of the weights of the edges 𝑤𝑖𝑗 of all nodes 𝑁 which have a direct incoming or outgoing connection with node 𝑖. Nodes 𝑖 and 𝑗 are connected when 𝑤𝑖𝑗 > 0. Ports having many connections with others and accommodating large ships have high Indegree coefficients, while ports which are a point of departure of a considerable number of vessels have high Outdegree scores. The same logic applies to the analysis of the interaction at a country level as well as in the case of the countries’ exports where the weights of the edges are according to the value of exported goods.
14
3.4.2. Weighted Betweenness and Closeness Centralities
Betweenness and closeness centralities in weighted networks are based on the Dijkstra’s algorithm (Dijkstra 1959). The Newman (2001) and Brandes (2001) algorithm to estimate the shortest path between two nodes in a weighted network is as follows:
𝑑𝑤(𝑖, 𝑗) = 𝑚𝑖𝑛 ( 1
𝑤𝑖ℎ + ⋯ + 1
𝑥ℎ𝑗) (4)
𝑑𝑤(𝑖, 𝑗) refers to the weighted distance between node 𝑖 and node 𝑗, while ℎ is an
intermediate node situated on the shortest path between 𝑖 and 𝑗. Therefore, weighted closeness centrality of node 𝑖 (𝑤𝐶𝑖) can be depicted by equation 5.
𝑤𝐶𝑖 = [∑ 𝑑𝑤(𝑖, 𝑗)
𝑁 𝑗
] (5)
In the context of containerized trade, a port with high weighed closeness centrality refers to a port with the possibility of reaching all other ports in the network by passing through not so many intermediate nodes.
Weighted Betweenness centrality (𝑤𝐵𝑖) is based on a combination of the number of intermediary nodes and tie weights (Opsahl, Agneessens, and Skvoretz 2010). It can be represented by the following equation:
𝑤𝐵𝑖 = 𝑏𝑗𝑘
𝑤(𝑖)
𝑏𝑗𝑘𝑤 (6)
𝑏𝑗𝑘𝑤(𝑖) refers to the number of times that node 𝑖 is an intermediate passage for node 𝑗 to reach all 𝑘 nodes in the network, as well as the associated weighs to the links. Ports with high
15
weighted betweenness have a strategic position in the network, and might play a role as an important hub port or an obligatory passage to reach other ports.
3.4.3. Hub Coefficient
There are two main types of network configurations in the maritime trade: the hub and spoke network and the multi-port network (Figure 3). The first one is a system of connections where all traffic moves along spokes connected to the hub at the centre. By contrast, the multi-port calling configuration is characterized by direct trajectories of any given vessel between the ports. Such structure is used in the case of relatively small container port networks.
Figure 1 Hub and Spoke versus Multi-Port Calling configuration. Source: (Imai et al., 2009)
We used the algorithm of Kleinberg (1999) to detect hub ports, which was applied in the context of online queries and analysis of the hyperlink structure among ‘www’ pages. This algorithm identifies authoritative ‘www’ pages (authorities) for broad search topics. Pages that connect a number of authorities are called hubs.
16
Regarding maritime transport, ports having high Hub coefficients are connected to ports with high Indegree centrality. This algorithm allows us to identify ports which are mainly connected to other major ports in the network.
3.4.5. Identification of clusters
A related question of interest is to know if one port belongs to a particular community of ports, and if yes, how this community is defined? As stated by Pons (2005) and Pons and Latapy (2006), the concept of community in graph theory is not clearly defined. However, it is possible to define a community as a set of vertices (nodes) where the density of internal connections is greater than the density of connections to the outside (Pons 2005). Accordingly, to calculate the potential communities within a given network, one should split the network into a given number of groups. In order to determine different groups of ports or countries, we use the modularity algorithm for weighted direct networks applied by Blondel et al. (2008).
In summary, by applying Network Analysis and Graph Theory we can identify the ports/countries (i) with the most outgoing and incoming connections (degree centrality), (ii) which have diverse connections and are easily reachable by other nodes in the network (closeness centrality), (iii) which are intermediate links ‘bridges’ connecting different clusters or peripheral nodes (betweenness centrality) and (iv) which play the role of hub in regional and global shipping networks. In addition, this methodology allows us to discern tightly connected clusters of ports/countries.
17 4. Results
The networks analyses were conducted using Gephi software (version 0.9.2) and R software (Package ‘tnet’4).
4.1. Maritime Port Network (153 nodes)
4.1.1. Typology of the global ‘Maritime Port Network’
As shown in Appendix 1, the descriptive statistics of the nodes and the link attributes reveal a significant dispersion around the mean, as the studied sample consists of highly heterogeneous ports and maritime routes. The network has a high degree of connectivity (Table 2). On average, the bivariate distance between any two connected nodes is 1.809 edges and each interacts with approximately 48 other ports in the sample.
Clustering Coefficient 0.695
Diameter 4
Average Path Length 1.809 Average bivariate Degree 47.81699346 Average Weighted degree 16,409,626.386
Node Count 153
Density 0.276
Table 2. Characteristics of the Maritime Port Network
18
The clustering coefficient reflects the probability of being connected to other nodes in the network. It is relatively significant (0.69), as should be expected, considering the average number of neighbours of each node. It is also observed that the network density is small (0.276). The Graph Density measures how complete the network is (Bastian, Heymann, and Jacomy 2009). A complete network contains all possible edges and has a density of 1.
These results indicate that the network has a scale-free configuration. Such networks, introduced by Barabási and Albert (1999), are mainly characterized by a degree of distribution that follows a power law, with a few highly-connected nodes and a majority of nodes with lower degrees of centralities.
4.1.2. Ranking of ports in the Global Maritime network based on centrality measures
When we look at the rankings of the 153 ports in the ‘Maritime Port Network’ (Appendix 2), we observe that ports change their position according to different centrality measures. Recall that the weight of the links between the ports is according to the Number of Trips multiplied by the average size of the vessels operating between each pair of ports.
Table 3 depicts the top 20 ports ranked in terms of the selected network indicators. The most important port in Europe is the port of Rotterdam, as it has the highest Outdegree score. This means that the frequency and the size of the ships departing from this port of origin are substantial. In terms of Indegree centrality, Singapore has the highest score and Rotterdam ranks second.
19 No Rank Outdegree (weighted) Rank Indegree (weighted) Rank Closeness (weighted) Rank Betweenness
(weighted) Rank Hub
1 Rotterdam Singapore Port Said Singapore Singapore
2 Singapore Rotterdam Singapore Port Said Hong Kong
3 Shanghai Port Said Shanghai Shanghai
Ningbo-Zhoushan
4 Hong Kong Shanghai Rotterdam Rotterdam Shanghai
5
Ningbo-Zhoushan Hong Kong
Ningbo-Zhoushan Hong Kong Shenzhen
6 Port Said Antwerp Hamburg Balboa Port Klang
7 Hamburg Hamburg Hong Kong Valencia Rotterdam
8 Shenzhen
Ningbo-Zhoushan Shenzhen New York Tanjung Pelepas
9 Antwerp
Bremen/Bremer
haven Antwerp Tokyo Kaohsiung
10
Bremen/Breme
rhaven Shenzhen
Bremen/Bremer
haven Belawan Port Said
11 Tokyo Le Havre Valencia Port Klang Hamburg
12 Le Havre Valencia Felixstowe Marsaxlokk Antwerp
13 Valencia Tokyo Yokohama
Tanjung Priok
(Jakarta) Algeciras
14 Felixstowe Yokohama Tokyo Antwerp Jebel Ali (Dubai)
15 Yokohama New York Algeciras Yokohama Le Havre
16 New York Felixstowe Tanjung Pelepas
Tanjung Perak
(Surabaya) Valencia
17 Algeciras Nagoya Port Klang Shenzhen New York
18 Nagoya Algeciras Le Havre Ningbo-Zhoushan Norfolk (USA)
19 Kaohsiung Jebel Ali (Dubai) Southampton Port Everglades Balboa
20 Port Klang Kaohsiung Keelung Algeciras
Bremen/Bremer haven Table 3. Ranking of top 20 ports according to different centrality measures
Although Port Said had an annual throughput of only 3.96 million TEU in 2014, it has the highest closeness coefficient due to its unique geographical location. The port is located at the north gate of the Suez Canal, a 200 km-long canal that connects the Mediterranean with the Red Sea (El-bastawisy and Abd-al-whab Helmy 2006), and is at a strategic position easily reachable by many ports in the sample. Singapore is ranked second due to its role as a major hub port
20
connecting Southeast Asia with Western Asia, Europe and Africa. Similar to the findings of Wang and Cullinane (2016), the Chinese ports of Shanghai, Shenzhen and Hong Kong have very high weighted closeness scores and rank 3rd, 7th and 8th respectively. Ningbo-Zhoushan is another Chinese container port which is ranked 5th and is situated in the Yangtze River Delta, a large industrial and logistics area.
Similar to closeness centrality, the betweenness measures show that the ports serving as the most important intermediate passages are Singapore, Port Said and Shanghai. It is interesting to highlight that the port of Balboa is in 6th place. It is an important hub connecting Far East and North America to the West Coast of South America, Central America and the Caribbean. Like Port Said in Egypt, the Panamanian port has a strategic location on the Panama Canal which makes it a compulsory intermediate node for the majority of traffic in Latin and Central America. Although weighted betweenness centrality identifies major hubs of the global network, Belawan with an annual throughput of 600,000 TEUs is ranked 10th. This means that the port is not a hub, but is compulsory passage for many smaller regional ports (feeder ports). Other Indonesian ports such as Port Klang, Tanjung Priok and Tanjung Perak (Surabaya) also play a key role in connecting the ASEAN community to the global shipping network.
In order to detect major hub ports in the global ‘Maritime Port Network’ we look at the Hub Coefficient. Unsurprisingly, the most important hub ports are identified as Singapore, Hong Kong, Ningbo-Zhoushan, Shanghai, Shenzhen, Port Klang and Rotterdam. These ports have very strong links between them as well as with other major ports in the network.
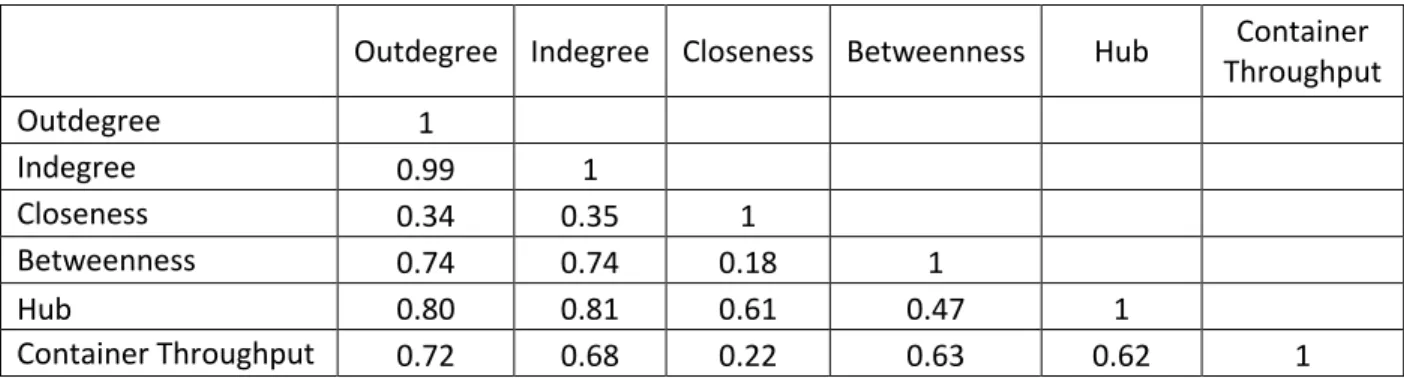
When we look at the correlation coefficients of the centrality measures and the annual throughput in 2014 (Table 4), there is very strong correlation between Outdegree and Indegree centralities (0.99) not surprisingly. It means that ports which are major points of departure for
21
many ships are also major destinations. In addition, indegree and outdegree are both positively correlated to Hub, Betweenness and Container Throughput. Thus, ports with high hub coefficients are intermediate links with a capacity to handle many containers and, due to their geographical locations, are easily reachable by other ports in the network.
Outdegree Indegree Closeness Betweenness Hub Container Throughput Outdegree 1 Indegree 0.99 1 Closeness 0.34 0.35 1 Betweenness 0.74 0.74 0.18 1 Hub 0.80 0.81 0.61 0.47 1 Container Throughput 0.72 0.68 0.22 0.63 0.62 1
Table 4. Correlation matrix between weighted centrality measures for the Maritime Port Network
The existence of hub ports in the ‘Maritime Port Network’ reveals that any dysfunction or removal of one hub can lead to the separation of different clusters or communities, and to a larger extent, the destabilization of the logistics chain (Xu et al. 2015).
Appendix 3 shows a graphical representation of the Maritime Port Network where we see that five communities have been identified. The first community consists of ports belonging to eleven countries from North and South America (see last column of the table in Appendix 2). In the second cluster there are 10 European, 1 Canadian and 1 Moroccan ports. The third community is formed by 51 ports from Europe, Asia, the Middle East and Africa. The fourth group of closely connected ports is dominated by ports from China, Taiwan, the U.S. and the Philippines. In this group we also have a few ports from Mexico. The last community only contains ports from Indonesia. These results reveal that the geographical location of a port is not enough by itself to explain the connections with other ports.
22 4.2. Maritime Country Network
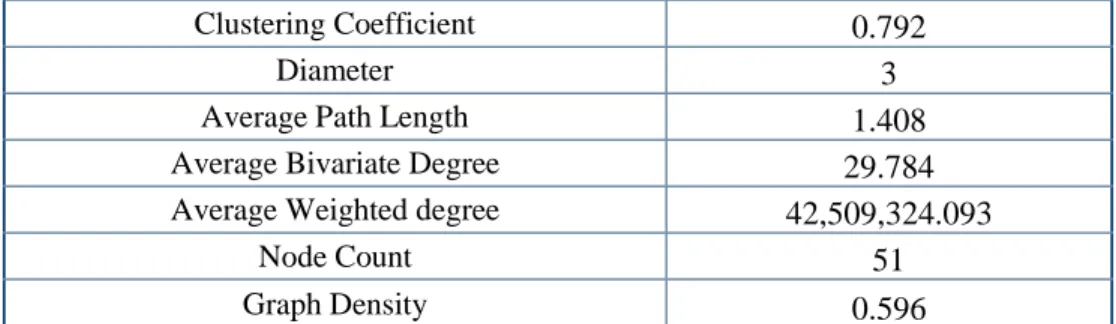
At a country level, the maritime network is a polarized or scale-free structure with a high level of connectivity. It is a core-periphery structure where the most important countries are the world’s main importers and exporters. Japan, Egypt and Spain have very high closeness coefficients, which means that they have strategic locations in the network. In terms of intermediate nodes, Spain, Japan, Germany and Malaysia are found to be the most important nodes. We have not estimated the hub coefficient due to the high level of density of the network and the fact that almost all countries in the sample are interconnected.
Clustering Coefficient 0.792 Diameter 3 Average Path Length 1.408
Average Bivariate Degree 29.784
Average Weighted degree 42,509,324.093 Node Count 51 Graph Density 0.596
Table 5. Characteristics of the Maritime Country Network
Unsurprisingly, at the country level the clustering coefficient and the graph density are higher than in the Maritime Port Network (Table 5).
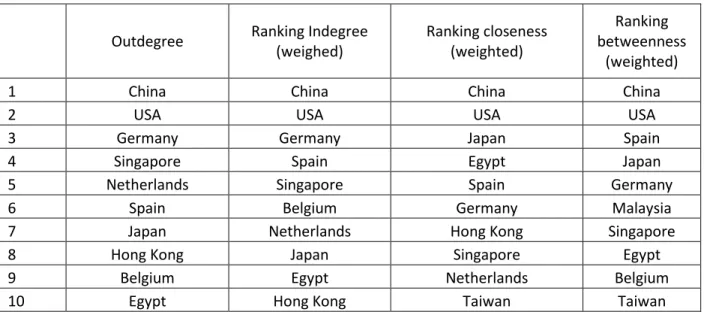
When we compare the countries in the sample, we observe that China and the U.S. are the most connected nodes according to all centrality measures (Table 6). In terms of Indegree and
23
Outdegree centralities, Germany has the highest connectivity in Europe, followed by Spain and the Netherlands.
Outdegree Ranking Indegree (weighed) Ranking closeness (weighted) Ranking betweenness (weighted)
1 China China China China
2 USA USA USA USA
3 Germany Germany Japan Spain
4 Singapore Spain Egypt Japan
5 Netherlands Singapore Spain Germany
6 Spain Belgium Germany Malaysia
7 Japan Netherlands Hong Kong Singapore
8 Hong Kong Japan Singapore Egypt
9 Belgium Egypt Netherlands Belgium
10 Egypt Hong Kong Taiwan Taiwan
Table 6. Ranking of top 10 countries according to different centrality measures
We have identified four clusters of tightly connected countries (see the last column of the table in Appendix 4). The first one is constituted by only European countries. The second cluster includes 21 nodes mainly from Asia and the Middle East. The third cluster is the most diverse with countries from Europe, Asia, South America and Africa. Finally, similar to the port network, North and South American countries form a community.
4.3. ASEAN+3 Maritime Port Network
In this section we analyze the ports belonging to the ASEAN+3 community, which includes China, Hong Kong, Taiwan, South Korea, Japan, Singapore, Thailand, Vietnam, Indonesia,
24
Malaysia, Cambodia, the Philippines and Brunei. We did not include Myanmar due to the lack of data, and we did not include Laos since it is a land locked country.
Clustering Coefficient 0.741 Diameter 4
Average Path Length 1.677
Average Bivariate Degree 25.662 Average Weighted degree 7,332,918
Node Count 68
Graph Density 0.383
Table 7. Characteristics of the ASEAN+3 Maritime Port Network
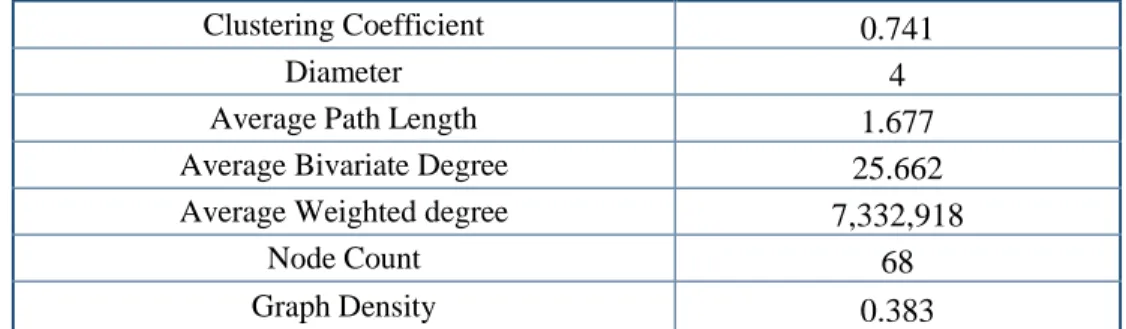
The low graph density (0.383) and the average path length of 1.677 suggest that the ports are well connected and that on average they interact with 25.7 nodes in the sample (Table 7). The good connectivity between the ASEAN+3 ports is confirmed by the high clustering coefficient (0.741).
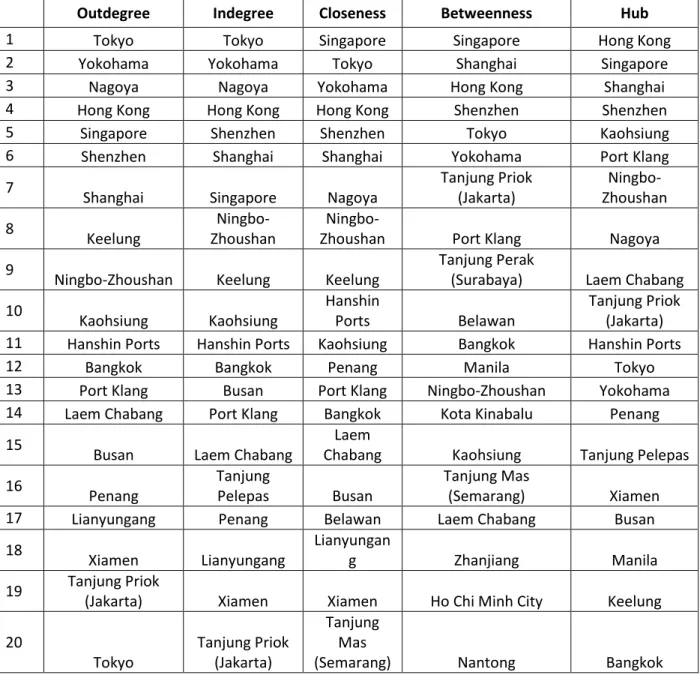
In contrast with the global ‘Maritime Port Network’, within ‘The ASEAN+3 Ports Network’ Singapore is ranked 5th and 7th in terms of Outdegree and indegree respectively. In terms of intra-ASEAN outgoing and incoming traffic, the Japanese ports and Honk Kong are the most important ones (Table 8). However, Singapore is the gateway port of ASEAN+3 to the global shipping market. It has many direct connections with smaller (feeder) ports and its role as a major transhipment centre for Eastern and South-Eastern Asia is confirmed by its high closeness and betweenness coefficients. Shanghai, Hong Kong and Shenzhen are also important intermediate ports. The high hub coefficients of Hong Kong, Singapore, Shanghai, Shenzhen and Kaohsiung show that these ports are mainly connected with other hubs of the ‘ASEAN+3 Maritime Port Network’. Appendix 6 shows detailed centrality measures for all ports in the sample.
25
Outdegree Indegree Closeness Betweenness Hub
1 Tokyo Tokyo Singapore Singapore Hong Kong
2 Yokohama Yokohama Tokyo Shanghai Singapore
3 Nagoya Nagoya Yokohama Hong Kong Shanghai
4 Hong Kong Hong Kong Hong Kong Shenzhen Shenzhen
5 Singapore Shenzhen Shenzhen Tokyo Kaohsiung
6 Shenzhen Shanghai Shanghai Yokohama Port Klang
7
Shanghai Singapore Nagoya
Tanjung Priok (Jakarta) Ningbo-Zhoushan 8 Keelung Ningbo-Zhoushan
Ningbo-Zhoushan Port Klang Nagoya
9
Ningbo-Zhoushan Keelung Keelung
Tanjung Perak
(Surabaya) Laem Chabang 10 Kaohsiung Kaohsiung Hanshin Ports Belawan Tanjung Priok (Jakarta) 11 Hanshin Ports Hanshin Ports Kaohsiung Bangkok Hanshin Ports
12 Bangkok Bangkok Penang Manila Tokyo
13 Port Klang Busan Port Klang Ningbo-Zhoushan Yokohama 14 Laem Chabang Port Klang Bangkok Kota Kinabalu Penang 15
Busan Laem Chabang
Laem
Chabang Kaohsiung Tanjung Pelepas 16 Penang Tanjung Pelepas Busan Tanjung Mas (Semarang) Xiamen
17 Lianyungang Penang Belawan Laem Chabang Busan
18
Xiamen Lianyungang
Lianyungan
g Zhanjiang Manila
19 Tanjung Priok
(Jakarta) Xiamen Xiamen Ho Chi Minh City Keelung 20 Tokyo Tanjung Priok (Jakarta) Tanjung Mas
(Semarang) Nantong Bangkok
Table 8. Ranking of top 20 ASEAN+3 ports according to different centrality measures
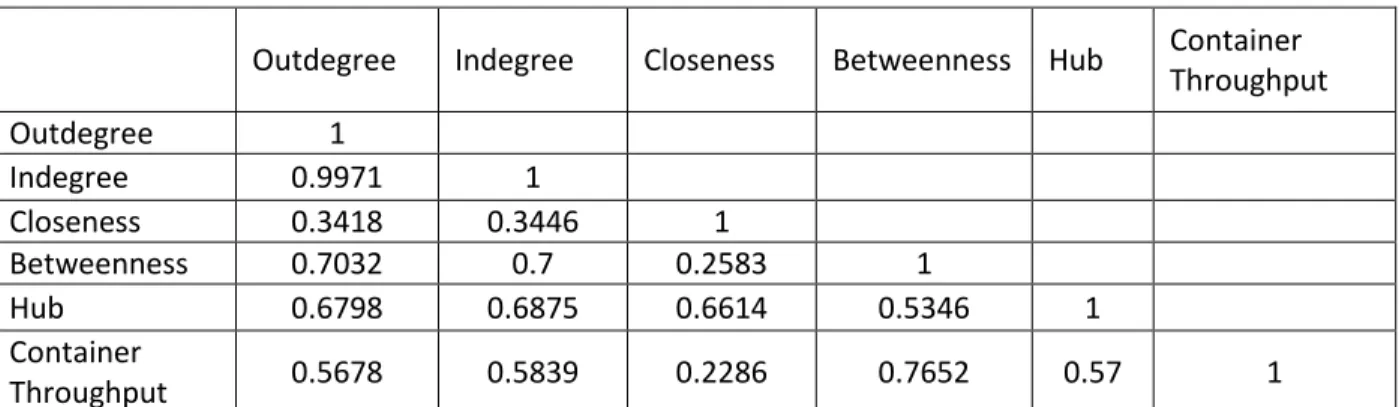
The correlation matrix between the centrality measures of the ‘ASEAN+3 Maritime Port Network’ is similar to that of the maritime port network. However, it should be noted that the correlation between Outdegree and hub, as well as indegree and hub, is lower in this network with
26
0.68 and 0.69 respectively. This is normal since we observe a regional network of well interconnected ports.
Outdegree Indegree Closeness Betweenness Hub Container Throughput Outdegree 1 Indegree 0.9971 1 Closeness 0.3418 0.3446 1 Betweenness 0.7032 0.7 0.2583 1 Hub 0.6798 0.6875 0.6614 0.5346 1 Container Throughput 0.5678 0.5839 0.2286 0.7652 0.57 1
Table 9. Correlation matrix between weighted centrality measures for the ‘ASEAN+3 Maritime Port Network’
Container throughput is highly correlated with betweenness centrality. Therefore, ports with high betweenness in the ASEAN+3 network also constitute an important part of the intra-ASEAN+3 maritime traffic.
As we can see in Appendix 7, three communities have been identified in this network. The first one includes 8 ports from Japan, Korea, and China. The second one includes 29 ports exclusively from ASEAN. The only ASEAN country we studied which does not have any ports in this cluster is the Philippines. The last cluster is the biggest one and has 31 ports from China, Hong Kong, Taiwan and the Philippines. These results suggest that the ASEAN ports have a strong maritime intra-regional integration. As a corollary, it means that the ASEAN Single Shipping Market and its designated ports maintain close ties. In addition, there is also a high level of connectivity between Chinese ports and Hong Kong.
27
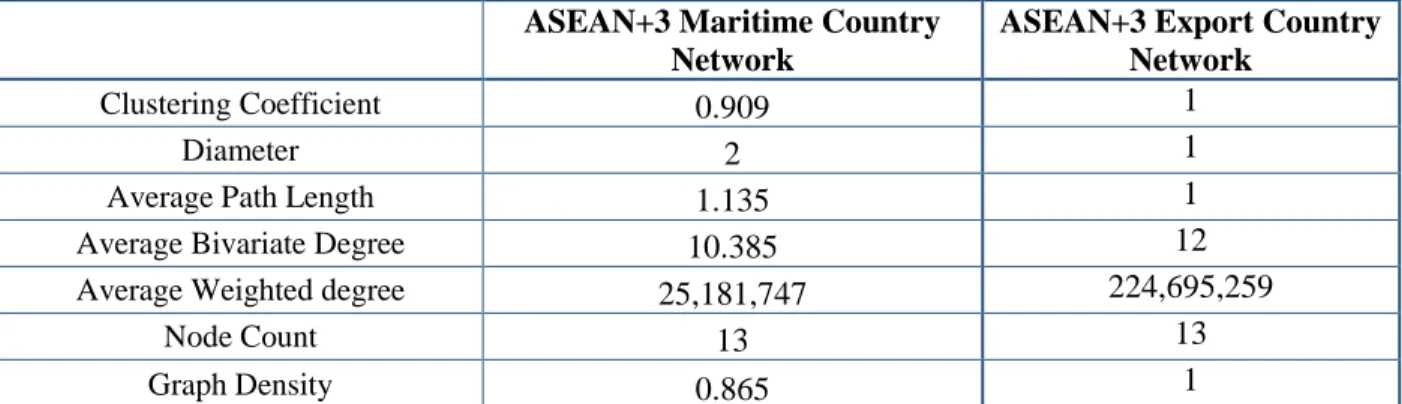
4.5. Comparison between ASEAN+3 Maritime Country Network and ASEAN+3 Export Country Network
Since the dataset includes almost all major ports situated in ASEAN+3 nations, we focus our analysis on the particular case of the maritime and export networks at a country level in this community. Recall that in the former network weights of edges are based on the Number of Trips multiplied by the average size of the containerships in TEUs, while in the latter, weights correspond to country Exports in USD.
ASEAN+3 Maritime Country Network
ASEAN+3 Export Country Network
Clustering Coefficient 0.909 1
Diameter 2 1
Average Path Length 1.135 1
Average Bivariate Degree 10.385 12
Average Weighted degree 25,181,747 224,695,259
Node Count 13 13
Graph Density 0.865 1
Table 10. Characteristics of ASEAN+3 Maritime Country Network and ASEAN+3 Export Country Networks
Unsurprisingly, the ‘Export Country Network’ is denser, since it takes into account all exported goods. On the other hand, ASEAN+3 countries have 10.38 maritime country connections on average.
At first glance we can see that major economies such as China, Japan and Hong Kong, which act as bridges toward Europe and North America, play a substantial role in both networks (Table 11). In the case of the ASEAN+3 Maritime Country Network, we have identified two clusters. The first one includes all ASEAN states except the Philippines, while the second is
28
constituted of China, Philippines, Japan, South Korea, Hong Kong and Taiwan. It confirms our previous finding that ASEAN countries form a well-connected community where the dominant port is Singapore (being both a port and a country).
ASEAN+3 Maritime Country Network ASEAN+3 Export Country Network
Node Outdeg ree Indegr ee Closene ss Betwee nness Outdegr ee Indegre e Closene ss Betweenn ess Brunei 12 12 12 6 13 12 13 5 Cambodia 13 13 13 6 12 13 11 5 China 2 2 2 5 1 1 1 1 Hong Kong 3 3 4 6 2 2 3 5 Indonesia 9 9 9 6 9 9 9 5 Japan 1 1 1 1 3 3 2 2 Malaysia 6 6 6 2 6 7 7 5 Philippines 10 10 10 6 11 11 12 5 Singapore 5 5 3 3 5 5 6 3 South Korea 8 8 8 6 4 4 4 5 Taiwan 4 4 5 4 7 6 8 5 Thailand 7 7 7 6 10 8 10 4 Vietnam 11 11 11 6 8 10 5 5
Table 11. Rankings of the ASEAN+3 countries in the Export and Maritime Network according to different weighted centrality measures
In the case of the Export Country Network (Appendix 11), we have identified two clusters of countries. The most dominant nodes are China and Hong Kong, and they form the first community. These results are consistent with the outcomes of the modularity analysis of the third network, ‘ASEAN+3 Port Network’, where Chinese ports and Hong Kong form the third cluster. The other states belong to the second community which is dominated by Japan and South Korea.
29
In both observed networks Japan, China and Hong Kong have the highest scores. In addition, the rankings of Cambodia, Brunei, Philippines and Thailand are very similar. Vietnam has low Outdegree and Indegree centralities while its betweenness scores are higher in the two networks. It should be highlighted that in the Maritime as well as the Export network, Singapore plays an important role as a bridging organization (high betweenness centrality). These results suggest that in the context of ASEAN+3, the development of the port infrastructure and the connectivity has a substantial impact on the overall trade performance. When we look at the structure of the Trade and Maritime Networks of ASEAN+3, we observe similar features not only at the country level but also at port level.
5. Conclusion
Network Analysis is a suitable method to investigate the structure of the maritime transport system as well as the hierarchy of the ports/countries at global and regional levels according to different centrality measures. We have analyzed five types of directed weighted networks. The weights of the links between nodes are according to the number of trips and the size of the containership vessels operating between the origin and destination ports, or, the value of countries’ exports.
The first network consists of 153 ports from all around the world. Our findings confirm the hub and spoke structure of the Global Maritime Network. As major hubs have been identified Singapore, Hong Kong, Ningbo-Zhoushan, Shanghai and Shenzhen. Ports with relatively low Indegree and Outdegree centralities, such as Port Said, Balboa and Belawan, have very high betweenness centralities which indicates their strategic geographical position and connections with
30
ports which are situated at the periphery of the global network. When we aggregate the data at the country level, the ‘Maritime Country Network’ shows a similar pattern. The European states as well as North and South America form linked communities. China, the U.S., the Netherlands, and Japan are intermediate passages.
We have also analyzed the intra-maritime connectivity between ports situated in the ASEAN+3 countries. The Japanese ports and Hong Kong play the most important roles in terms of outgoing and incoming traffic. However, Shanghai and Singapore are found to have the highest betweenness scores which make them important intermediate points connecting many ports in the network. Furthermore, modularity analysis identifies a community of ports from exclusively ASEAN member states except the Philippines. This finding reveals that ASEAN states had a good intra-regional connectivity in 2014.
A comparative analysis was conducted between the maritime and trade integration of ASEAN+3 countries. In the case of maritime connectivity, all ASEAN member states form the first cluster, while China, Taiwan, Hong Kong, Republic of Korea and Japan are associated with the second cluster. When we weight the links between countries according to the exports, the ‘ASEAN+3 Export Country Network’ has similar features as the ‘ASEAN+3 Maritime Country Network’, even though the rankings for some countries was slightly different. Similar to the Ports Network, China and Hong Kong form one community, while Singapore plays an important intermediate role in both networks. These findings confirm the comparable pattern of countries’ exports and their maritime connectivities.
Potential future research could be conducted by analysing competition in the liner shipping sector by taking into account the number of carriers operating on different maritime routes. In the context of ongoing investments in port infrastructure and Climate Change, the sustainability of the
31
supply chain network is a hot topic. Network analysis could be a useful tool to detect ports which are important in the network and to assess their resilience to different disturbances such as natural and man-made disasters. A similar analysis for a longer period of time with dynamic graphs could be also conducted in order to observe how containerized transport has evolved throughout the years. In the near future, data availability should increase and similar analyses might be possible for a bigger sample.
References:
ASEAN. 2017. ‘ASEAN Transport Development.’ Review of. The ASEAN Secretariat, Jakarta. Asgari, Nasrin, Reza Zanjirani Farahani, and Mark Goh. 2013. ‘Network design approach for
hub ports-shipping companies competition and cooperation.’ Review of. Transportation Research Part A: Policy and Practice 48:1-18.
Banomyong, Ruth. 2015. ‘Trade Facilitation & Logistics Development: Bridging the GMS and beyond.’ Review of. Mekong Forum 2015:44-7.
Barabási, A. L., and R. Albert. 1999. ‘Emergence of scaling in random networks.’ Review of. Science 286:509-12.
Barrat, Alain, Marc Barthélemy, and Alessandro Vespignani. 2004. ‘Weighted evolving networks: coupling topology and weight dynamics.’ Review of. Physical review letters 92 (22):228701.
Bastian, Mathieu, Sebastien Heymann, and Mathieu Jacomy. 2009. ‘Gephi: an open source software for exploring and manipulating networks.’ Review of. Icwsm 8:361-2. Blondel, Vincent D, Jean-Loup Guillaume, Renaud Lambiotte, and Etienne Lefebvre. 2008.
‘Fast unfolding of communities in large networks.’ Review of. Journal of statistical mechanics: theory and experiment 2008 (10):P10008.
Borgatti, Stephen P. 2005. ‘Centrality and network flow.’ Review of. Social networks 27 (1):55-71.
32
Brandes, Ulrik. 2001. ‘A faster algorithm for betweenness centrality.’ Review of. Journal of mathematical sociology 25 (2):163-77.
Dijkstra, Edsger W. 1959. ‘A note on two problems in connexion with graphs.’ Review of. Numerische mathematik 1 (1):269-71.
Ducruet, César. 2013. ‘Network diversity and maritime flows.’ Review of. Journal of Transport Geography 30:77-88.
Ducruet, César, and Theo Notteboom. 2012. ‘The worldwide maritime network of container shipping: spatial structure and regional dynamics.’ Review of. Global networks 12 (3):395-423.
Ducruet, César, Céline Rozenblat, and Faraz Zaidi. 2010. ‘Ports in multi-level maritime networks: evidence from the Atlantic (1996–2006).’ Review of. Journal of Transport Geography 18 (4):508-18.
El-bastawisy, Magdy M, and Rania H Abd-al-whab Helmy. 2006. ‘Integrated Socio-economic Development for Accelerating the Regional Role of Port-Said in Tourism Development of Egypt.’ Review of.
Fahmiasari, Hafida, and Danang Parikesit. 2017. ‘Container Shipping Network Efficiency Comparison in Indonesia: Nusantara Pendulum and Sea Tollway.’ Review of. The Asian Journal of Shipping and Logistics 33 (2):79-84.
Freeman, Linton C. 1978. ‘Centrality in social networks conceptual clarification.’ Review of. Social networks 1 (3):215-39.
Jackson, Matthew O. 2010. Social and economic networks: Princeton university press.
John, Andrew, Zaili Yang, Ramin Riahi, and Jin Wang. 2016. ‘A risk assessment approach to improve the resilience of a seaport system using Bayesian networks.’ Review of. Ocean Engineering 111:136-47.
Kleinberg, Jon M. 1999. ‘Authoritative sources in a hyperlinked environment.’ Review of. Journal of the ACM (JACM) 46 (5):604-32.
Lam, Jasmine Siu Lee, and Wei Yim Yap. 2011. ‘Dynamics of liner shipping network and port connectivity in supply chain systems: analysis on East Asia.’ Review of. Journal of Transport Geography 19 (6):1272-81.
33
Midoro, Renato, Enrico Musso, and Francesco Parola. 2005. ‘Maritime liner shipping and the stevedoring industry: market structure and competition strategies.’ Review of. Maritime Policy & Management 32 (2):89-106.
Newman, Mark EJ. 2001. ‘The structure of scientific collaboration networks.’ Review of. Proceedings of the National Academy of Sciences 98 (2):404-9.
Nguyen, Nguyet Anh Thi, Thi Hong Hanh Pham, and Thomas Vallée. 2017. ‘Similarity in trade structure: Evidence from ASEAN + 3.’ Review of. The Journal of International Trade &Economic Development,:1-25.
Nguyen, Thi Nguyet Anh, Thi Hong Hanh Pham, and Thomas Vallée. 2016. ‘Economic integration in ASEAN+ 3: A network analysis.’ Review of. Journal of economic integration:275-325.
Notteboom, Theo E. 2010. ‘Concentration and the formation of multi-port gateway regions in the European container port system: an update.’ Review of. Journal of Transport Geography 19:567-83.
Opsahl, Tore, Filip Agneessens, and John Skvoretz. 2010. ‘Node centrality in weighted networks: Generalizing degree and shortest paths.’ Review of. Social networks 32 (3):245-51.
Otte, Evelien, and Ronald Rousseau. 2002. ‘Social network analysis: a powerful strategy, also for the information sciences.’ Review of. Journal of information Science 28 (6):441-53. Peng, Yun, Wenyuan Wang, Zijian Guo, Xiangqun Song, and Qi Zhang. 2016. ‘A stochastic
seaport network retrofit management problem considering shipping routing design.’ Review of. Ocean & Coastal Management 119:169-76.
Pons, Pascal. 2005. ‘Détection de structures de communautés dans les grands réseaux
d’interactions.’ Review of. AlgoTel 2005 Septiemes rencontres francopohones sur les Aspects Algorithmiques des Telecommunications:75.
Pons, Pascal, and Matthieu Latapy. 2006. ‘Computing communities in large networks using random walks.’ Review of. J. Graph Algorithms Appl. 10 (2):191-218.
Sutomo, Heru, and Joewono Soemardjito. 2012. ‘Assessment Model of the Port Effectiveness and Efficiency (Case Study: Western Indonesia Region).’ Review of. Procedia-Social and Behavioral Sciences 43:24-32.
34
Tongzon, Jose L, and Sang-Yoon Lee. 2015. ‘The challenges of economic integration: the case of shipping in ASEAN countries.’ Review of. The Pacific Review 28 (4):483-504. Wang, Yuhong, and Kevin Cullinane. 2016. ‘Determinants of port centrality in maritime
container transportation.’ Review of. Transportation Research Part E: Logistics and Transportation Review 95:326-40.
Xu, Xiangdong, Anthony Chen, Sarawut Jansuwan, Kevin Heaslip, and Chao Yang. 2015. ‘Modeling transportation network redundancy.’ Review of. Transportation Research Procedia 9:283-302.
Yang, Jinglei, Grace WY Wang, and Kevin X Li. 2016. ‘Port choice strategies for container carriers in China: a case study of the Bohai Bay Rim port cluster.’ Review of. International Journal of Shipping and Transport Logistics 8 (2):129-52.
Zaman, Muhammad Badrus, Iwan Vanany, and K Duha Awaluddin. 2015. ‘Connectivity
Analysis of Port in Eastern Indonesia.’ Review of. Procedia Earth and Planetary Science 14:118-27.
Acknowledgments
We would like to thank Ms. Kerry Slattery, International Programme Director, National University of Management, Phnom Penh, Cambodia, for reviewing this paper and providing us with valuable feedback.
35 Appendices:
Appendix 1: Descriptive statistics of different type of networks
Type of network Nodes Edges Variables Mean Std. Dev. Min Max
Maritime Port Network 153 6410 AvgTEU 4299.762 3015.468 80 18270 NoTrips 99.69938 277.1175 1 5510 Maritime Country network 51 1,519 AvgTEU 4911.418 2861.2 142 18270 NoTrips 328.6866 912.2704 1 16872 ASEAN+3 Maritime Port Network 68 1745 AvgTEU 2022.986 1574.131 80 14080 NoTrips 144.4292 412.3873 1 5510 ASEAN+3 Maritime Country Network 13 135 AvgTEU 1797.992 1205.591 608 6191 NoTrips 1002.66 2233.5 1 16872 ASEAN+3 Export Country Network 13 156 Exports in '000 USD
36
Appendix 2: Main weighted centralities measures for the ‘Maritime Port Network’
Weighted centrality measures for the ‘Maritime Port Network’ as well as the modularity class to which every port belongs.
Port Country Throughput
'000 TEUs Outdegree Indegree Closeness
Between ness Hub Modular ity Class Singapore Singapore 33900 118149 117755 0.000255259 8203 0.160737 2 Hong Kong Hong Kong 22300 100390 89205 0.000254923 3860 0.160206 3 Ningbo-Zhoushan China 19500 95592 76385 0.000254973 823 0.159628 3 Shanghai China 35300 111663 92816 0.000255128 6105 0.159469 3 Shenzhen China 24037 77508 63956 0.00025485 956 0.155226 3 Port Klang Malaysia 10946 44367 40504 0.000254438 1241 0.14527 2 Rotterdam Netherlan ds 12298 120562 116484 0.000255121 4417 0.143447 1 Tanjung Pelepas Malaysia 8232 39650 28106 0.000254462 306 0.137985 2 Kaohsiung Taiwan 10593 44712 44255 0.000253711 450 0.137476 3 Port Said Egypt 3959 90325 99082 0.000255347 8093 0.13576 2 Hamburg Germany 9775 86048 83600 0.000254961 283 0.135682 1 Antwerp Belgium 8812 76157 85000 0.000254677 1134 0.135152 1 Algeciras Spain 4555 46702 44956 0.0002545 749 0.134779 2 Jebel Ali (Dubai) United Arab Emirates 15249 25922 44475 0.000253838 262 0.133776 2 Le Havre France 2433 56095 62756 0.000254403 0 0.132202 1 Valencia Spain 4442 55294 61160 0.000254583 1864 0.131433 2 New York United States of America 5772 51713 50009 0.000253931 1729 0.131198 0 Norfolk (USA) United States of America 2393 38504 43175 0.00025394 531 0.130281 0 Balboa Panama 3468 36170 41370 0.000253911 1996 0.129293 0 Bremen/Breme rhaven Germany 5731 64158 64553 0.000254651 549 0.128586 1 Hanshin Ports Japan 2049 27443 31177 0.000253895 185 0.120247 3
Tangier-Mediterranee Morocco 3070 37267 36626 0.000253716 274 0.120123 2 Felixstowe United Kingdom 4072 52585 49102 0.000254574 164 0.119642 1 Barcelona Spain 1893 34409 37668 0.000254259 373 0.118934 2 Genoa Italy 2014 29392 30303 0.000254165 130 0.117121 2 La Spezia Italy 1262 23890 22454 0.000253506 0 0.114949 2
37 Yokohama Japan 2880 52289 50985 0.000254568 1091 0.113957 3 Busan South Korea 18700 15141 16012 0.00025229 2 0.113493 3 Charleston United States of America 1792 25453 27114 0.000252707 444 0.113109 0 Colombo Sri Lanka 4908 7170 8296 0.000248966 302 0.111225 2 Nagoya Japan 2569 46574 46271 0.00025424 147 0.108821 3 Tokyo Japan 4894 58732 56035 0.000254508 1493 0.108662 3 Jawaharlal Nehru India 4467 18054 16653 0.000252713 151 0.107663 2 Qingdao China 16660 2356 1837 0.000244394 0 0.106445 3 Durban South Africa 2644 16968 17701 0.000253876 0 0.106099 2 Oakland United States of America 2394 33909 36491 0.000254214 267 0.105143 3 Laem Chabang Thailand 6583 14955 13708 0.000252549 311 0.104848 3
Southampton United Kingdom 1894 31915 34905 0.000254315 0 0.102741 1 Marsaxlokk Malta 2869 27905 28793 0.000254144 1196 0.101823 2 Kingston(JAM ) Jamaica 1638 10960 12271 0.000251084 0 0.100984 0 Sines Portugal 1228 20466 21944 0.000252418 0 0.100806 1 Houston United States of America 1951 16012 16519 0.000251315 146 0.099833 0 Salalah Oman 3000 18014 17289 0.000253146 0 0.098151 2 Zeebrugge Belgium 2047 20222 22386 0.000253375 0 0.09733 2 Baltimore United States of America 779 10009 10970 0.000251097 151 0.097192 0 Manzanillo (MEX) Mexico 2355 17426 19414 0.000253276 5 0.096894 3 Xiamen China 8600 11107 9573 0.000251503 0 0.096749 3 Gioia Tauro Italy 3708 22955 24927 0.000253446 151 0.096483 2 Santos Brazil 3685 38882 43005 0.000254199 561 0.096142 0 Long Beach United States of America 6817 20971 20111 0.00025395 154 0.096018 3 Seattle/Tacoma United States of America 3616 25629 24840 0.000253948 115 0.091343 3 Djibouti Djibouti 736 10038 11075 0.000252094 0 0.087437 2 Miami United States of America 877 8732 9619 0.000249325 0 0.086973 0 Jeddah Saudi Arabia 4218 11088 15221 0.000252586 0 0.085954 2 Chennai India 1552 3112 2750 0.000250227 0 0.084233 2 Halifax Canada 400 8196 7880 0.000251291 0 0.082308 0
38 Jacksonville United States of America 937 8132 9325 0.000249328 4 0.081441 0 Keelung Taiwan 1686 28954 26053 0.000254266 236 0.080437 3 Abidjan Ivory Coast 600 5053 4741 0.000250195 0 0.079872 2 Weihai China 650 3148 3126 0.00024222 0 0.079158 3 Los Angeles United States of America 8340 17781 16221 0.000253337 0 0.078246 3 Dalian China 10128 938 674 0.000228621 0 0.078074 3 Buenos Aires Argentina 1429 17610 21395 0.000253437 0 0.077169 0 Lianyungang China 5005 9610 8830 0.000251928 22 0.07702 3 Freeport (BHS) Bahamas 1400 6427 8069 0.000244959 0 0.075492 0 Manila Philippine s 3673 4628 4377 0.000247809 608 0.074503 3 Port Everglades United States of America 1013 9927 10293 0.000249366 783 0.073943 0 Khor Fakkan United Arab Emirates 3800 11116 11501 0.000252345 0 0.073812 2 Buenaventura Colombia 855 7587 10541 0.000252342 0 0.073494 0 Yantai China 2361 5269 5350 0.00024841 0 0.073099 3 Tanjung Priok (Jakarta) Indonesia 6053 7121 7009 0.000249099 1178 0.070122 4 Algiers Algeria 857 2720 2778 0.000248438 302 0.069246 2 Vancouver (CAN) Canada 2913 11515 12198 0.000252746 0 0.068731 3 Shantou-Jieyang China 1199 2294 2233 0.000247459 0 0.067891 3 Bejaia Algeria 190 1246 1203 0.000238532 0 0.065856 2 Veracruz Mexico 847 11508 11045 0.0002506 116 0.064379 0 Wenzhou China 604 1093 1111 0.000238647 0 0.064046 3 Mobile United States of America 237 5247 5620 0.000247758 0 0.063708 0 Lagos Nigeria 1600 3015 4571 0.000249129 0 0.062854 2 Penang Malaysia 1266 9563 9529 0.00025398 0 0.062227 2 Jiangyin China 1000 569 269 0.000236921 0 0.060859 3 San Antonio (CHL) Chile 1094 6523 8342 0.000250022 0 0.059194 0 Boston (USA) United States of America 214 4787 4689 0.000249234 0 0.058282 0 Bangkok Thailand 1536 13202 12600 0.000253203 743 0.057877 3 Philadelphia United States of America 449 5566 4833 0.000247664 0 0.05588 0 Savannah United States of America 3136 184 224 0.000158629 0 0.055857 0 St. Petersburg Russia 2375 10036 10080 0.00025349 0 0.055675 1
39
Keihin Ports Japan #N/A 4045 3691 0.000249746 0 0.054855 3 Puerto Limon Costa Rica 1090 1398 1775 0.000234897 0 0.052443 0 Tanjung Perak (Surabaya) Indonesia 3128 3571 4453 0.000244101 1036 0.050822 4 San Francisco United States of America N/A 436 529 0.000200135 0 0.049688 3 Nantong China 550 509 285 0.000229959 302 0.049605 3 Casablanca Morocco 846 5534 5574 0.000249785 151 0.049558 2 Marseilles/Fos France 1190 1851 1857 0.000243723 0 0.04887 2 Arzew Algeria 0 160 194 0.000170751 0 0.047689 2 Batangas Philippine s 135 1234 1238 0.000236612 0 0.047307 3 Fangchenggan g China N/A 1736 1722 0.000248573 0 0.045709 3 Skikda Algeria 148 827 850 0.000233944 0 0.044804 2 Belawan Indonesia 600 4295 4341 0.000251909 1285 0.043679 4 Annaba Algeria N/A 286 293 0.000213042 0 0.043332 2 Qinhuangdao China 414 1034 1018 0.000235558 0 0.043277 3 Davao Philippine s 612 1863 1757 0.000242613 148 0.041973 3 Kuantan Malaysia 131 1826 1809 0.000248985 0 0.041701 2 Mumbai India 40 167 233 0.000165669 0 0.041363 2 Gdansk Poland 1232 9378 10841 0.000253178 0 0.041259 1 Tanjung Mas (Semarang) Indonesia 576 3979 3996 0.000250889 429 0.041223 4 Zhanjiang China 581 2442 2451 0.000247578 302 0.040844 3 Haikou China 1347 474 467 0.000219647 0 0.040763 3 Ho Chi Minh City Vietnam 6515 982 895 0.000238771 302 0.037804 3 Piraeus Greece 3585 238 284 0.000187533 0 0.03722 2 Mombasa Kenya 1012 1016 1376 0.000233887 0 0.037172 2 Cebu Philippine s 708 1998 2074 0.000248501 0 0.036493 3 Oran Algeria 201 1225 1230 0.000244109 0 0.034695 2 Kota Kinabalu Malaysia 261 594 531 0.000226559 453 0.033889 2 Rades Tunisia 311 566 418 0.000232525 0 0.032997 2 Montreal Canada 1402 1763 1783 0.000245472 0 0.030655 1 Agadir Morocco 159 995 965 0.00023294 0 0.030014 1 Kuching Malaysia 228 119 104 0.000154045 0 0.028115 2 Ambarli Turkey 3445 176 40 0.000174184 0 0.028031 2 Prince Rupert Canada 618 3876 3365 0.000250295 0 0.027622 3
Wilmington (Delaware, USA) United States of America 339 247 283 0.000222991 0 0.027387 0 Muara Brunei 90 181 169 0.000181483 0 0.026533 2 Jinzhou China 879 454 410 0.000222258 0 0.025778 3
40 Palm Beach United States of America 263 61 53 8.72308E-05 0 0.025472 0 Sfax Tunisia 84 371 316 0.000238652 0 0.024959 2 Rizhao China 2420 1008 953 0.000237045 0 0.023722 3 Cai Lan Vietnam 49 80 96 0.000145689 0 0.021967 3 Sandakan Malaysia 275 174 164 0.000216514 0 0.017747 2 Beihai China 85 53 54 0.000117595 0 0.016874 3 Pontianak Indonesia 198 251 244 0.000229153 0 0.016138 4 Bintulu Malaysia 258 65 66 0.000113534 0 0.014011 2 Haldia India 102 44 40 0.000137418 0 0.013704 2 Sihanoukville Cambodia 342 20 9 8.50579E-05 0 0.01345 2 Makassar Indonesia 560 1934 1996 0.000242631 9 0.013276 4 Balikpapan Indonesia 76 203 188 0.000203726 0 0.012641 4 Johore Bahru Malaysia 793 69 78 0.000173205 0 0.012236 2
Subic Bay
Philippine
s 77 34 59 0.000125828 0 0.010446 3 Sousse Tunisia 32 32 20 0.000148266 0 0.010005 2 Nanjing China 2760 9 7 4.06656E-05 0 0.009943 3 Bitung Indonesia 115 821 854 0.000238555 0 0.009602 4 Dumai Indonesia N/A 9 20 3.92993E-05 0 0.0075 4
New Mangalore India 63 57 66 0.000191924 0 0.007331 2 Banjarmasin Indonesia 404 587 610 0.000235175 0 0.007054 4 Jayapura Indonesia 45 462 527 0.00022708 0 0.006889 4 Sorong Indonesia 44 420 433 0.000223372 0 0.006405 4 Zhenjiang China 385 20 20 0.000119423 0 0.006106 3 Gulfport United States of America 188 61 54 0.000197569 0 0.005735 0 General Santos Philippine s 183 8 3 3.88156E-05 0 0.005725 3 Yingkou China 5768 3 3 2.02369E-05 0 0.005317 3 Gabes Tunisia N/A 2 3 1.54084E-05 0 0.003331 2 Zamboanga Philippine s 79 63 71 0.000165775 0 0.002779 3 New Orleans United States of America 491 1 3 1.19181E-05 0 0.001566 0 Haiphong Vietnam 2131 0 0 4.31659E-06 0 0.000835 3
Note: Ports for which we do not have data for the container throughput, in the first column is written ‘N/A’.
41
Appendix 3: Graphical representation of the ‘Maritime Port Network’
Maritime Network of 153 ports in the sample. The size of the nodes corresponds to their outdegree weighted centrality. The weight of the links is 𝑤𝑖𝑗 = 𝐴𝑣𝑔𝑇𝐸𝑈𝑖𝑗∗ 𝑁𝑏𝑇𝑟𝑖𝑝𝑠. The different colours of edges and