Advanced Polymer Nanocomposites with Tailored
Morphologies for High Voltage Insulating Systems
by
Emna HELAL
MANUSCRIPT-BASED THESIS PRESENTED TO ÉCOLE DE
TECHNOLOGIE SUPÉRIEURE IN PARTIAL FULFILLMENT OF THE
REQUIREMENTS FOR THE DEGREE OF DOCTOR OF PHILOSOPHY
Ph.D.
MONTREAL, JULY 11, 2017
ÉCOLE DE TECHNOLOGIE SUPÉRIEURE UNIVERSITÉ DU QUÉBEC
This Creative Commons licence allows readers to download this work and share it with others as long as the author is credited. The content of this work can’t be modified in any way or used commercially.
BOARD OF EXAMINERS
THIS THESIS HAS BEEN EVALUATED BY THE FOLLOWING BOARD OF EXAMINERS
Professor Nicole Raymonde DEMARQUETTE, Thesis Supervisor
Department of Mechanical Engineering at École de Technologie Supérieure
Professor Éric DAVID, Thesis Co-supervisor
Department of Mechanical Engineering at École de Technologie Supérieure
Professor Michel FRÉCHETTE, Thesis Co-supervisor
Department of Materials Science at Hydro-Québec’s Research Institute
Professor Sylvain CLOUTIER, President of the Board of Examiners Department of Electrical Engineering at École de Technologie Supérieure
Professor Ricardo ZEDNIK, Member of Jury
Department of Mechanical Engineering at École de Technologie Supérieure
Professor Musa KAMAL, Independent External Evaluator
Department of Chemical Engineering at McGill University, Canada
Professor Jérôme CASTELLON, External Evaluator
Institut d’Électronique et des Systèmes, Université de Montpellier, France
THIS THESIS WAS PRENSENTED AND DEFENDED
IN THE PRESENCE OF A BOARD OF EXAMINERS AND PUBLIC ON JUNE 02, 2017
DEDICATION
To my parents, Mohamed HELAL and Jawaher SLIMAN, to whom this dissertation means as much as it means to me.
To my husband, Mohamed ZEMZEM, who has been a constant source of support for me. To Prof. Zoubeida OUNAIES who a few years ago gave me the opportunity to discover what
“Nano” is. The months I spent working with her team have opened my mind to research in many different ways.
ACKNOWLEDGMENT
I would like to express my deep gratitude to the people who helped me during my PhD project. Without your support, I wouldn’t have made it this far.
First, I would like to sincerely thank my main supervisor, Prof. Nicole R. DEMARQUETTE, for accepting me as her PhD student and for her continuous support, guidance and trust throughout my research and graduate study at ÉTS. Working with her has been a wonderful and rewarding experience. I am also very much grateful to my co-supervisors Prof. Éric DAVID and Prof. Michel FRÉCHETTE who put their efforts and expertise on this project similarly to the main supervisor. Their assistance and support throughout the course of this research is greatly appreciated. I would like also to thank our collaborators, Prof. Danilo J. CARASTAN and his research group from Federal University of ABC in Brazil and Dr. Leice G. AMURIN for providing materials and valuable insights to help me with my research.
The financial support from Hydro-Québec, NSERC and ÉTS is gratefully acknowledged. I hope I have met the expectations.
Among people from ÉTS, I would like to thank Prof. Sylvain CLOUTIER, Prof. Martine DUBÉ and Prof. Ricardo ZEDNIK for agreeing to evaluate this work either during exams or defense. I am also grateful to Prof. Claudiane OUELLET-PLAMONDON and Michaël DUBOIS from Construction Engineering Department as well as Jaime and Felipe, graduate students of Prof. Sylvain CLOUTIER, from Electrical Engineering Department for providing me access to some equipment. I would like also to extend my gratitude to the technicians, Claude-Daniel, Nabil, Olivier and Radu, and all the staff working in the Mechanical Engineering Department for their practical help whenever needed.
I would like also to thank Prof. Musa KAMAL from McGill University and Prof. Jérôme CASTELLON from University of Montpellier in France for agreeing to evaluate this work.
From IREQ, I would like to thank Dr. Tung Tran Anh, Dr. Hugues COUDERC, Dr. Christele VANGA BOUANGA and Dr. Meng GUO for their valuable and generous help with some of my dielectric spectroscopy, mechanical profilometry and thermal conductivity experiments. Thanks go also to my dear friends and colleagues (researchers, students and interns) that I met at ÉTS or IREQ: Abdelghani, Anthony, Camille, Chloé, Carlos, Christele, Eya, Ehsan, Foued, Fouzia, Ghalia, Hugues, Julie, Leice, Marwa, Mauricio, Meng, Mitasha, Mostafa, Oana, Samantha, Scheyla, Sohrab, Thomas, Victor and Zahra; Thank you, merci, obrigada, gracias, danke, xièxiè, اركش , يسرم … for professional and nonprofessional discussions, helpful insights, multicultural environment, good memories and every workday’s. I wish all of you the best of luck on your future plans. Special thoughts to Carlos and Leice for the happy moments, confidence and shared laughs that made some “heavy days” lighter (Also, for brigadeiro, beijinhos and all the delicious Brazilian sweets!).
I am also thankful to all the persons and friends who made my stay in Montreal more delightful and interesting: Azadeh, for always being so nice friend and available whenever I needed an advice, Lina, Refka and Sun, for being such lovely roommates and Carmelle, for being a very kind landlord always caring about our comfort and also for the dinners and delicious Quebec dishes.
To my friends in Montreal, Arbi and Abir (and their cute Yassine), Foued and Randa (and their little Youssef), Fouzia, Hend and her family, Marwa and her husband and my husband’s friend Abdellatif, I would like to say thank you for adding the warm feeling of home to this journey and for being a second family to me here in Montreal.
To my friends in Tunisia, especially Ghazoua and Nesrine, I want to say thank you for being always there for me, even by distance, whenever I needed a helping hand. Your friendship means a lot to me.
Certainly, my deepest gratitude goes to my parents, Mohamed and Jawaher, for continuous support at different scales, for unconditional love, for their dedication to their jobs that inspired me and for being so good teachers for life (Merci d’être mon repère!). Thank you
also for supporting my dreams and ambitions and always believing in me even when my choices were not the best. I will be always grateful to have you in my life.
I am also grateful, to my brother, Mohamed, for standing up for me and for taking good care of our parents in my absence. Besides, I am indebted to all my extended family, especially my uncle Mohamed Hechmi SLIMAN (I am always impressed by your “mathematical” vision of life), his wife Zohra and their children Amani, Mejda and Mohamed, for their never ending love, continuous support and encouragements along my studies.
Of course, I could not forget my soulmate Mohamed who became my husband during these four years of PhD, for sharing life’s best and worst moments, for holding my hand all these years and for absolutely everything. Your love and support are so precious to me. I am glad to share this PhD journey with you: your turn is next!
And foremost, I am grateful to God for giving me the strength to keep going during difficult times.
NANOCOMPOSITES DE POLYMÈRES À MORPHOLOGIES CONTRÔLÉES POUR DES APPLICATIONS D’ISOLATION HAUTE TENSION
Emna HELAL RÉSUMÉ
Cette thèse rapporte différentes approches pour préparer des matériaux d’isolation nanostructurés qui bénéficient d’une dispersion contrôlée de nanoparticules dans l’objectif d’optimiser leurs propriétés. Ces approches se basent sur l’utilisation de matrices polymères multi-phases, telles que les copolymères à blocs et les mélanges de polymères, comme gabarit pour guider la dispersion des nanoparticules. Deux types de nanoparticules, organiquement modifiées, ont été utilisés: l’oxyde de zinc (ZnO) sous forme de sphères et l’argile Montmorillonite sous forme de plaquettes. En plus, un copolymère à blocs a été sélectionné comme gabarit, à savoir: le polystyrène-b-poly(éthylène-co-butylène)-b-polystyrène (SEBS) constitué de deux blocs de polystyrène (PS) sous forme de domaines nanométriques et d’un bloc élastomère de poly(éthylène-co-butylène) (PEB).
Des nanocomposites SEBS/argile et SEBS/ZnO ayant des morphologies variées ont été fabriqués. En particulier, l’orientation des nanodomaines du bloc PS et des plaquettes d’argile dans ces nanocomposites a été contrôlée en ayant recours à différentes méthodes de fabrication. Les morphologies obtenues varient de l’isotropie totale à l’orientation totale suivant une seule direction, en passant par des morphologies intermédiaires partiellement orientées. La distribution spatiale des deux types de nanoparticules ainsi que leurs affinités respectives aux blocs PS et PEB ont été également contrôlées par la présence ou non de groupements fonctionnels d’anhydride maléique (MA) greffés sur le bloc élastomère PEB. Les propriétés diélectriques, rhéologiques, thermiques et mécaniques de ces nanocomposites ont été caractérisées en corrélation avec leurs morphologies. Dans les nanocomposites SEBS/argile, l’incorporation des argiles a réduit la mobilité des chaînes du bloc PEB situées à l’interface polymère/nanoparticule. Une transition vitreuse, plus élevée que celle du bloc PEB, a été attribuée à ces chaînes de la zone interfaciale. De plus, l’orientation et la localisation des argiles ont affecté la mobilité de ces chaînes et en conséquence les propriétés d’ingénierie. Plus précisément, les nanocomposites SEBS/argile ayant une morphologie partiellement alignés ont assuré la combinaison optimale de résistance diélectrique et mécanique.
Dans les nanocomposites SEBS/ZnO et en présence du MA, la dispersion des nanoparticules et leur affinité au bloc PEB ont été nettement améliorées. Par conséquence, un réseau entre les nanosphères de ZnO et les chaînes de polymère a été formé. Ce réseau a été associé à une amélioration de la conductivité thermique et une remarquable augmentation de la résistance à l’érosion de surface par décharges couronne; le volume érodé étant réduit de 90% à seulement 5 wt% de ZnO. Dans la dernière partie du projet, des nanocomposites SEBS/ZnO sélectionnés ont été mélangés avec du polyéthylène (PE) pour préparer des nanocomposites hybrides PE/SEBS/ZnO candidats pour l’isolation haute tension. La résistance à l’érosion de surface et la flexibilité mécanique des nanocomposites PE/SEBS/ZnO ont été améliorées par rapport aux nanocomposites de référence PE/ZnO. Cette augmentation a été associée à l'amélioration de la dispersion des nanoparticules de ZnO et à leur localisation sélective dans SEBS et à l’interface entre PE et SEBS.
Mots clés: isolation haute tension, nanocomposite de polymère, nanodiélectrique, dispersion
ADVANCED POLYMER NANOCOMPOSITES WITH TAILORED MORPHOLOGIES FOR HIGH VOLTAGE INSULATING SYSTEMS
Emna HELAL ABSTRACT
This thesis reports different approaches to prepare a new generation of nanostructured insulating materials featuring controlled nanoparticles dispersion, using block copolymers and polymer blends as template matrices. Two types of nanoparticles, both organically modified, were used: zinc oxide (ZnO) and Montmorillonite clay. In addition, polystyrene-b-poly(ethylene-co-butylene)-b-polystyrene (SEBS) triblock copolymer, composed of two polystyrene (PS) endblocks in the form of well-ordered nanodomains and one poly(ethylene-co-butylene) (PEB) elastomer middle block, was selected as a template matrix.
SEBS/clay and SEBS/ZnO nanocomposites featuring different configurations of PS domains and clay platelets, namely: isotropic, partially oriented and oriented morphologies were achieved by varying the processing techniques. Besides, the spatial distribution of clay platelets and ZnO nanospheres and their affinities to either PS block or PEB block were tuned by the presence or not of maleic anhydride (MA) graft attached to PEB block. In particular, the dispersion of both types of nanoparticles was considerably improved in the presence of MA. Dielectric, rheological, thermal and mechanical properties of these nanocomposites were characterized in correlation with their morphologies.
In SEBS/clay nanocomposites, it was found that the incorporation of clay induced slower dynamics of PEB chains located in the interfacial region. A new interfacial glass transition (Tgi), higher than the
glass transition (Tg) of bulk PEB, was attributed to these interfacial chains. Furthermore, the
orientation and location of clay affected the interfacial dynamics: the highest Tgi temperatures were
related to samples with lower alignment degree and preferential location of clay in PEB phase. Functional properties were also affected by the orientation. To be more specific, SEBS/clay nanocomposites with totally aligned clay platelets and PS domains were simultaneously the most efficient in improving the breakdown strength up to 45% and the less efficient in improving the mechanical strength. However, nanocomposites with partially oriented morphologies provided the best combination of dielectric breakdown strength and mechanical strength.
In SEBS/ZnO nanocomposites, the improved dispersion and affinity to PEB block, achieved in the presence of MA, induced the formation of networks between ZnO nanoparticles and SEBS chains. This behavior was accompanied by an increase of thermal conductivity and excellent improvement of the resistance to surface erosion: eroded volume reduced by 90% at only 5wt% ZnO. In the last part of the project, selected SEBS/ZnO nanocomposites were mixed with polyethylene (PE) to prepare blend nanocomposites as new candidates for HV insulation. Although the overall dielectric performance of unfilled PE/SEBS blend was reduced compared to neat PE, PE/SEBS/ZnO blend nanocomposites featured higher resistance to surface erosion and mechanical flexibility compared to conventional PE/ZnO nanocomposites. This improvement was correlated with the improved dispersion of ZnO nanoparticles in PE/SEBS/ZnO compared to PE/ZnO nanocomposites and their selective localization in SEBS phase and potentially at the interfaces between PE and SEBS.
Keywords: High voltage insulation, polymer nanocomposite, nanodielectric, tailored nanoparticles
TABLE OF CONTENTS
Page
INTRODUCTION ...3
NANOCOMPOSITES WITH TUNED MORPHOLOGY FOR HV INSULATION ...13
1.1 Definition of nanocomposites and nanodielectrics ...13
1.1.1 Polymer nanocomposites definition ... 13
1.1.2 Definition of nanodielectrics ... 14
1.1.3 Theories and models regarding the interfacial region ... 15
1.1.3.1 Interlayer model ... 16
1.1.3.2 Multi-core model ... 18
1.1.4 Nanoparticles vs. Microparticles in polymer based insulations ... 19
1.1.5 Review of nanoparticles used in HV insulation systems ... 22
1.1.5.1 Metal oxide nanoparticles ... 22
1.1.5.2 Nitride and Carbide nanoparticles ... 24
1.1.5.3 Anisotropic nanoparticles ... 24
1.1.6 Parameters affecting the role of nanoparticles in HV insulating materials ... 25
1.1.6.1 Effect of nanoparticles size ... 25
1.1.6.2 Effect of nanoparticles shape and orientation ... 26
1.1.6.3 Effect of nanoparticles dispersion ... 29
1.2 Control of morphology: application to nanodielectrics ...30
1.2.1 Block copolymer nanocomposites ... 30
1.2.2 Polymer blend nanocomposites ... 33
1.3 Review of the materials ...36
1.3.1 Polyethylene ... 36
1.3.2 SEBS thermoplastic elastomer ... 37
1.3.3 Zinc Oxide nanoparticles ... 39
1.3.4 Organically modified Montmorillonite Clay ... 40
ARTICLE 1: STYRENIC BLOCK COPOLYMER-BASED NANOCOMPOSITES: IMPLICATIONS OF NANOSTRUCTURATION AND NANOFILLER TAILORED DISPERSION ON THE DIELECTRIC PROPERTIES ...43
2.1 Introduction ...44
2.2 Materials and experimental characterization ...46
2.2.1 Experimental strategy ... 46
2.2.2 Materials and methods ... 47
2.3 Results and discussion ...50
2.3.1 Morphology... 50
2.3.1.1 State of dispersion and location of nanoclay ... 50
2.3.1.1 Nanoclay orientation ... 55
2.3.1.2 SEBS morphology ... 56
2.3.1.3 Stability of SEBS morphology... 57
2.3.2 Dielectric properties ... 61
2.3.3 AC short-term breakdown strength ... 70
2.3.4 Summary of results ... 74
2.4 Conclusion ...75
ARTICLE 2: INTERFACIAL MOLECULAR DYNAMICS OF STYRENIC BLOCK COPOLYMER-BASED NANOCOMPOSITES WITH CONTROLLED SPATIAL DISTRIBUTION ...77
3.1 Introduction ...78
3.2 Materials and methods ...81
3.3 Characterization ...86
3.3.1 Small Angle X-ray Scattering ... 86
3.3.2 Transmission Electron Microscopy ... 86
3.3.3 Broadband dielectric spectroscopy ... 86
3.3.4 Dynamic mechanical analysis ... 87
3.4 Results and discussion ...87
3.4.1 Morphology... 87
3.4.1.1 Totally isotropic morphologies ... 87
3.4.1.2 Totally aligned morphologies ... 90
3.4.1.3 Partially aligned morphologies ... 90
3.4.2 Dielectric properties ... 97
3.4.2.1 Effect of orientation on dielectric behavior ... 102
3.4.2.2 Effect of styrene content and diameter of PS cylinders ... 105
3.4.2.3 Effect of nanoparticles location and intercalation degree ... 109
3.4.3 Dynamic mechanical analysis ... 111
3.5 Concluding remarks ...119
ARTICLE 3: THERMOPLASTIC ELASTOMER NANOCOMPOSITES WITH CONTROLLED NANOPARTICLES DISPERSION FOR HV INSULATION SYSTEMS: CORRELATION BETWEEN RHEOLOGICAL, THERMAL, ELECTRICAL AND DIELECTRIC PROPERTIES ...123
4.1 Introduction ...124
4.2 Experimental section ...127
4.2.1 Materials ... 127
4.2.2 Processing ... 128
4.2.3 Characterization ... 129
4.3 Results and discussion ...132
4.3.1 Dispersion and morphology ... 132
4.3.2 Rheological properties ... 137
4.3.3 Low-field dielectric characterization ... 142
4.3.4 High-field dielectric characterization ... 151
4.3.4.1 Short-term breakdown strength ... 151
4.3.4.1 Resistance to surface erosion by partial discharges ... 153
4.3.4.1 DC electrical conductivity: dependence on nanoparticles networks ... 155
4.3.5 Thermal conductivity ... 159
4.4 Concluding remarks ...161
ARTICLE 4: EVALUATION OF POLYETHYLENE/THERMOPLASTIC ELASTOMER/ZINC OXIDE BLEND NANOCOMPOSITES FOR HIGH VOLTAGE INSULATION APPLICATIONS ...163 5.1 Introduction ...164 5.2 Experimental ...166 5.2.1 Materials ... 166 5.2.2 Processing ... 167 5.2.3 Characterization ... 167
5.3 Results and discussion ...170
5.3.1 Scanning electron microscopy (SEM) ... 170
5.3.2 Thermodynamic prediction of ZnO nanoparticles localization: Wetting coefficient ... 174
5.3.3 Rheological properties ... 177
5.3.4 Complex dielectric permittivity ... 181
5.3.5 AC short-term breakdown strength ... 185
5.3.6 Resistance to surface erosion by partial discharges ... 187
5.3.7 Mechanical properties ... 189
5.4 Concluding remarks ...192
ARTICLE 5: TUNING THE MECHANICAL AND DIELECTRIC PROPERTIES OF CLAY-CONTAINING THERMOPLASTIC ELASTOMER NANOCOMPOSITES ...195
6.1 Introduction ...196
6.2 Processing and characterization ...199
6.2.1 Materials ... 199
6.2.2 Processing ... 199
6.2.3 Summary of nanocomposites morphologies ... 200
6.3 Characterization ...203
6.3.1 Mechanical properties ... 203
6.3.2 AC short-term breakdown strength ... 203
6.4 Results and discussion ...203
6.4.1 Mechanical properties ... 203
6.4.2 AC short-term Breakdown strength ... 208
6.5 Conclusion ...213
DISCUSSION ...215
7.2 SEBS/Clay nanocomposites...216
7.3 SEBS/ZnO nanocomposites ...218
7.4 PE/SEBS/ZnO blend nanocomposites ...219
CONCLUSION ...221
RECOMMENDATIONS ...227
ANNEX I SUPPORTING ELECTRONIC INFORMATION FOR ARTICLE 1 ...231
ANNEX II SUPPORTING ELECTRONIC INFORMATION FOR ARTICLE 2 ...241
ANNEX III SUPPORTING ELECTRONIC INFORMATION FOR ARTICLE 3 ...257
APPENDIX VITA ...267
LIST OF TABLES
Page
Table 2-1 Properties of Cloisite 20A grade ...48
Table 2-2 Summary of SEBS/clay nanocomposites with different structures ...60
Table 2-3 Designation of the nanocomposites ...61
Table 2-4 Dielectric strengths of SEBS, SEBS_MA and their nanocomposites ...73
Table 2-5 Summary of different effects of SEBS/nanoclays morphology on the complex dielectric permittivity and breakdown strength ...75
Table 3-1 Properties of SEBS-13, SEBS-20 and SEBS-30...82
Table 3-2 Nomenclature of nanocomposites ...85
Table 3-3 Nomenclature, morphology description and morphology sketch of the nanocomposites ...96
Table 3-4 VFT fitting parameters corresponding to SEBS-20 based nanocomposites ...104
Table 3-5 Dielectric strength of SEBS-20 based nanocomposites at 60 °C and 80 °C ...105
Table 3-6 VFT fitting parameters corresponding to SEBS-13 and SEBS-30 based nanocomposites ...109
Table 3-7 VFT fitting parameters corresponding to SEBS-30-MA-20A-oriented nanocomposite ...110
Table 3-8 Dielectric strength corresponding to SEBS-30-20A vs. SEBS-30-MA-20A nanocomposites prepared by extrusion ...110
Table 3-9 Tgs of both PS and PEB blocks in different samples of SEBS based nanocomposites ...114
Table 3-10 Interfacial Tgi, bound fraction and interfacial layer thickness in SEBS-30 based nanocomposites ...117
Table 3-11 Average dimensions of clay tactoids based on TEM quantitative analysis published by Carastan et al. (Carastan et al., 2014) ...117
Table 4-1 Values of real part of complex conductivity at 10-1 Hz ...147 Table 4-2 Dissipation factor (tan δ = ε’’/ ε’) at 66 Hz for different
nanocomposites ...150 Table 5-1 Nomenclature and composition of PE/ZnO and PE/SEBS-MA/ZnO
nanocomposites ...167 Table 5-2 Total surface tension and Dispersive and Polar components for
polymers and ZnO nanoparticles estimated at 160 °C ...176 Table 5-3 Estimated interfacial tension and wetting coefficient values ...177 Table 6-1 Nomenclature and morphology description of SEBS-20
LIST OF FIGURES
Page
Figure 0-1 Main steps of the PhD project ...9 Figure 1-1 Illustration of size effect on interfacial volume: increasing dominance
of interfacial areas with decreasing filler sizes ...14 Figure 1-2 Polymer composite with an interfacial layer between the filler
and the matrix ...17 Figure 1-3 Conductive water layer surrounding nanoparticles embedded in a
polymer matrix: (a) separate water layers (b) overlapping water shells ....18 Figure 1-4 Multi-core model ...19 Figure 1-5 Effect of nanoparticles on the flow of electrical charge carriers in
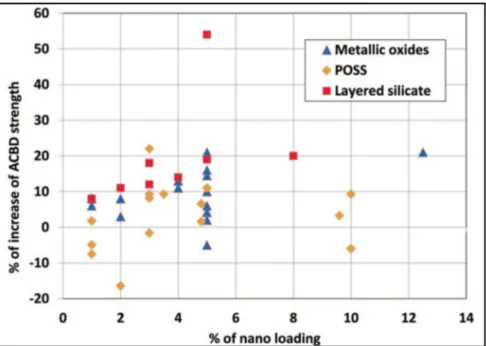
nanocomposites ...22 Figure 1-6 Relative impacts of selected nanoparticles on the breakdown
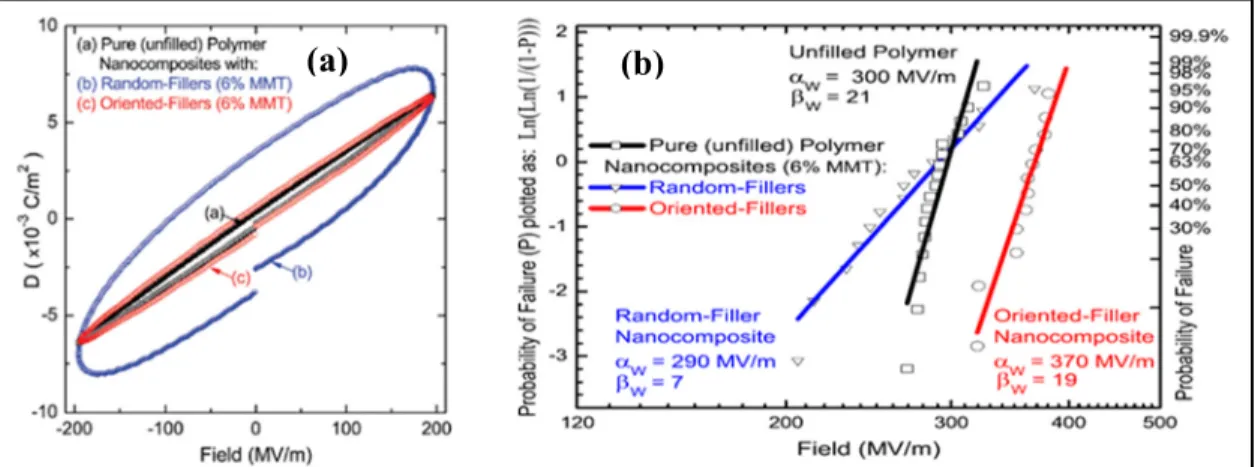
strength of polymer insulation matrices ...23 Figure 1-7 DC breakdown strength of BN/Epoxy as function of filler size ...25 Figure 1-8 Effect of the nanofillers alignment on: (a) the Displacement-Electric
field (D-E) loops and (b) the breakdown strength of polyethylene ...27 Figure 1-9 Thermal conductivity of BNNT/ PVA nanocomposite as function
of the orientation ...28 Figure 1-10 TEM images of: a) P3HT/ZnO nanocomposite
and b) P3Ht-b-PEO/ZnO nanocomposite ...31 Figure 1-11 Morphology of polyethylene: amorphous and crystalline regions ...37 Figure 1-12 Schematic description of SEBS block copolymer: (a) without maleic
anhydride (MA) and (b) with MA graft attached to PEB block ...38 Figure 1-13 Crystal structure of phyllosilicates ...41 Figure 1-14 Layered clay structures in nanocomposites ...42
Figure 2-1 TEM images of respectively: (a) SEBS_5wt% nanoclay, (b)
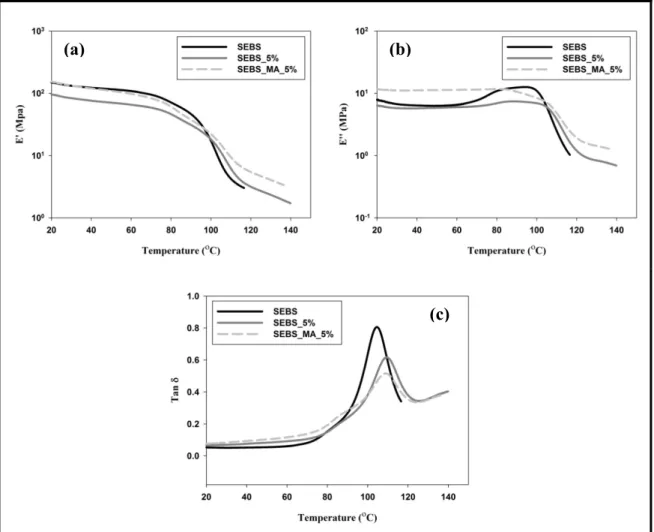
SEBS_MA_2.5wt% nanoclay, (c) SEBS_MA_5wt% nanoclay and (d) SEBS_MA_7.5wt% nanoclay (Prepared by extrusion) ...51 Figure 2-2 (a) Storage modulus E’, (b) Loss modulus E’’ and (c) Damping factor
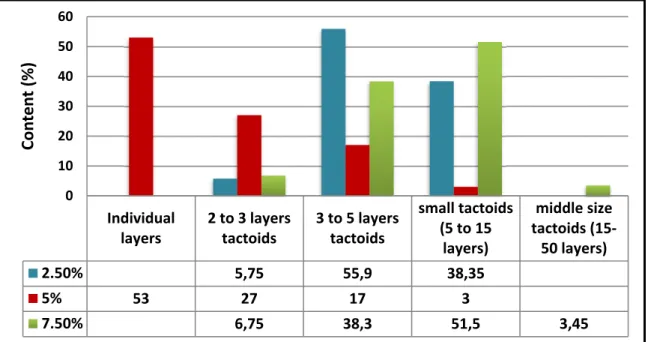
(tan δ) at 1 Hz of SEBS vs. SEBS_MA nanocomposites containing 5wt% nanoclay (prepared by extrusion) ...52 Figure 2-3 TEM image quantitative analysis of oriented hexagonal SEBS/clay
nanocomposites, prepared by extrusion, containing different nanoclay loadings: 2.5, 5 and 7.5 wt% ...54 Figure 2-4 (a) Storage modulus E’, (b) Loss modulus E’’ and (c) Damping
factor (tan δ) at 1 Hz of SEBS_MA nanocomposites containing 2.5, 5 and 7.5 wt% nanoclay (prepared by extrusion) ...55 Figure 2-5 Radial plot of peak intensities of SEBS vs. SEBS_MA
nanocomposites containing 5 wt% nanoclay (prepared by solution): (a) unannealed samples and (b) annealed samples ...57 Figure 2-6 Radial plots of SAXS peak intensities as function of time
at 200 °C of: (a) unannealed pure SEBS and (b) unannealed SEBS_5wt% nanocomposite prepared by solution...59 Figure 2-7 Orientation of electric field in dielectric spectroscopy and AC
short-term breakdown measurements: (a) anisotropic nanocomposites prepared by extrusion and (b) isotropic nanocomposites prepared by solution casting ...63 Figure 2-8 (a) Real and (b) imaginary parts of the complex permittivity
at room temperature of oriented hexagonal SEBS (type I) and SEBS_MA (type II) nanocomposites containing 2.5, 5 and 7.5 wt% nanoclay ...64 Figure 2-9 Real and imaginary parts of the complex dielectric permittivity
in the temperature range from 25 to 95 °C of: Pure SEBS (a) and (b), SEBS_5wt%_int_ori_hex (c) and (d) and
SEBS_MA_5wt%_exf_ori_hex (e) and (f) ...65 Figure 2-10 Real (a) and Imaginary (b) parts of the complex permittivity
at room temperature of oriented hexagonal vs. random hexagonal SEBS/clay nanocomposites ...68 Figure 2-11 Real (a) and imaginary (b) parts of the complex permittivity
of SEBS_5wt%_int_ran_hex nanocomposite with random hexagonal structure in the temperature range from 25 to 95 °C ...69
Figure 2-12 Real (a) and imaginary (b) parts of the complex permittivity of SEBS_5wt%_int_ran_lam nanocomposite with random lamellar structure in the temperature range from 25 to 95 °C ...70 Figure 2-13 Weibull plot of breakdown strength of SEBS vs. SEBS/clay
nanocomposites with oriented hexagonal structure ...72 Figure 3-1 Illustrations showing: (a) sheet die extrusion, (b) film blowing with
ratio R1= 1 and (c) film blowing with ratio R3= 3 (Coordinate system used as reference is indicated at the left of the figure) ...84 Figure 3-2 Scattering intensity as function of scattering vector q at different
temperatures of: (a) SEBS-20-solution and (b) SEB-20-20A-solution nanocomposite, (c) SEBS-13-solution and (d) SEBS-13-20A-solution nanocomposite ...89 Figure 3-3 (a)-(b) 2D SAXS patterns of: (a) SEBS-20-film blowing R1 and (b)
SEBS-20-20A-film blowing R1, (c)-(e) TEM images of SEBS 20-20A- film blowing R1 at 3 different magnifications showing imperfect alignment of PS cylinders and clay tactoids: (d) zoom on the section defined by black square in (c), (e) the white square indicates regions featuring perfect alignment of PS cylinders in the extrusion direction while dotted white rectangles indicate other directions of alignment (PS domains were stained with RuO4 (dark phase)) ...92
Figure 3-4 (a)-(b) 2D SAXS patterns of: (a) SEBS-20-film blowing R3 and (b) SEBS-20-20A- film blowing R3 nanocomposite, (c)-(d) TEM
images of SEBS-20-film blowing R3 at different magnifications (PS domains (darker phase) were stained with RuO4) ...94
Figure 3-5 Imaginary part of the dielectric permittivity as a function of
temperature of: (a) neat SEBS-20-partially oriented R3, (b) SEBS-20-20A-oriented, (c) SEBS-20-20A- partially oriented R1, (d) SEBS-20-20A-partially oriented R3, (e) SEBS-20-20A-isotropic and (f) an example of the fitting corresponding to SEBS-20-20A-partially oriented R3 at 75 °C (Different colors are used to denote the different contributions) ...101 Figure 3-6 Temperature dependence of the relaxation times corresponding
to SEBS-20 nanocomposites prepared by different processes:
symbols correspond to relaxations times retrieved from the HN function and solid lines correspond to VFT fitting ...104
Figure 3-7 Examples of fitting according to equation (A II.2) in annex II of
respectively: (a) SEBS-13-20A-isotropic at 65 °C (ɛ” presented in log scale due to high contribution from charge fluctuation)
and (b) SEBS-30-20A-oriented at 70 °C (Different colors are used to denote the different contributions) ...106 Figure 3-8 Temperature dependence of the relaxation times
corresponding to SEBS-13 and SEBS-30 nanocomposites prepared by different processes: symbols correspond to relaxation times retrieved from the HN function and solid lines correspond to VFT fitting, plots corresponding to SEBS-20
nanocomposites are presented again for comparison ...108 Figure 3-9 Temperature dependence of the relaxation times
corresponding to SEBS-30-MA-20A-oriented nanocomposite: symbols correspond to relaxations times retrieved from the HN function and solid lines correspond to VFT fitting (plot
corresponding to SEBS-30-20A-oriented nanocomposite is presented again for comparison) ...111
Figure 3-10 tan δ of different SEBS-30 materials (prepared by sheet die extrusion) from -100 °C to 130 °C at 1 Hz ...113 Figure 3-11 Fitted tan delta curves showing bulk Tgs of PS and PEB blocks
as well as Tgi of the interfacial layer (an additional ADS term is
considered for the increasing baseline):(a) SEBS-30-oriented and (b) SEBS-30-20A-oriented...115 Figure 3-12 Scheme of the interfacial layer covering the lateral side of clay
particles: (a) First approximation: clay tactoid as a solid particle, (b) part of the interfacial layer is between clay galleries ...118 Figure 4-1 Schematic description of SEBS block copolymer with MA group
grafted to elastomer block
("Polystyrene-block-poly(ethylene-ran-butylene)-block-polystyrene-graft-maleic anhydride,") ...128 Figure 4-2 Sketch of the set up for resistance to surface erosion test ...131 Figure 4-3 SEM micrographs of: (a) SEBS-5 (arrows indicate the
agglomerations) and (b) SEBS-MA-5 ...133 Figure 4-4 TEM micrographs of SEBS-MA-5 nanocomposite ...133 Figure 4-5 FTIR spectra of SEBS-MA-ZnO nanocomposites: (a) in the
absorption range 1500-2000 cm-1 and (b) in the absorption range 3000-3800 cm-1 ...135
Figure 4-6 Reaction scheme between maleic anhydride and the surface of the nanoparticles (R: alkyl ammonium salt) ...136
Figure 4-7 AFM images of: (a) Neat SEBS-MA, (b) SEBS-MA-1
nanocomposite, (c) Zoom on the region indicated by the square in (b) (showing the same magnification as (a)) ...137 Figure 4-8 SAOS measurements of SEBS-ZnO vs. SEBS-MA-ZnO
nanocomposites: (a)-(b) storage modulus G’ (●) and loss modulus G” (■) and (c)-(d) complex viscosity modulus |η*| ...140
Figure 4-9 Time sweep test at 200 °C, 0.05 rad.s-1 and 0.5% strain ...141 Figure 4-10 Complex dielectric permittivity at room temperature of
SEBS-MA-ZnO vs. SEBS-ZnO nanocomposites: (a) Real part of permittivity of SEBS-MA-ZnO nanocomposites, (b) Imaginary part of permittivity of SEBS-MA-ZnO nanocomposites, (c) Real part of permittivity of SEBS-ZnO nanocomposites and (d) Imaginary part of permittivity of SEBS-MA-ZnO
nanocomposites ...144 Figure 4-11 Imaginary part of the dielectric permittivity as functions of
frequency and temperature of: (a) Neat SEBS-MA, (b) Neat SEBS,(c) SEBS-MA-5 nanocomposite and (d) SEBS-5 nanocomposite ...146 Figure 4-12 Imaginary part of electric modulus as functions of frequency
and temperature of: (a) SEBS-MA-20wt% ZnO nanocomposite and (b) SEBS-20wt% ZnO nanocomposite ...149 Figure 4-13 Breakdown strength of: (a) SEBS-ZnO and (b) SEBS-MA-ZnO
nanocomposites ...152 Figure 4-14 Resistance to surface erosion by partial discharges ...155 Figure 4-15 (a) current density vs. DC electric field plots of
SEBS-MA-ZnO vs. SEBS-ZnO nanocomposites , (b) DC conductivity of SEBS-MA-ZnO vs. SEBS-ZnO nanocomposites as functions of ZnO loading (wt%) and electric field ...158 Figure 4-16 Thermal conductivity of SEBS-ZnO vs. SEBS-MA-ZnO
nanocomposites ...160 Figure 5-1 SEM micrographs of PE/ZnO nanocomposites: (a) unfilled PE,
(b) PE/1, (c) PE/5 and (d) PE/10 ...171 Figure 5-2 SEM micrographs of samples treated by solvent extraction:
(a) unfilled PE/SEBS-MA, (b) PE/SEBS-MA/1, (c) PE/SEBS-MA/5 and (d) PE/SEBS-MA/10 ...172
Figure 5-3 HRSEM micrographs of PE/SEBS-MA/5 nanocomposite: (a) SEBS-MA not extracted, (b) SEBS-MA extracted, (c) Zoom inside PE region surrounded by blue continuous line in (b): poor ZnO phase, (d) Zoom inside SEBS-MA region surrounded by red dotted line in (b): poor ZnO phase, (d) Zoom inside SEBS-MA region surrounded by red dotted line in (b): rich ZnO phase (Colors are available in the online version) ...174 Figure 5-4 SAOS measurements of PE/ZnO vs. PE/SEBS-MA/ZnO
nanocomposites: (a) storage modulus G’ and (b) complex viscosity modulus |η*| as function of angular frequency ω ...180 Figure 5-5 Plots of imaginary permittivity ɛ’’ as function of frequency
measured at room temperature corresponding to: (a) PE/ZnO
nanocomposites, (b) PE/SEBS-MA/ZnO nanocomposites and (c) comparison with SEBS-MA/ZnO master batches ...183 Figure 5-6: Isothermal frequency sweeps of the imaginary permittivity ɛ’’
of PE/5 and PE/SEBS-MA/5 nanocomposites at different
temperatures between 25 °C and 100 °C, performed before and after drying: (a) undried PE/5, (b) undried PE/SEBS-MA/5, (c) PE/5 dried and (d) PE/SEBS-MA/5 dried for 5 days at 65 °C. ...185
Figure 5-7 Weibull probability plots of: (a) PE/ZnO nanocomposites and (b) PE/SEBS-MA/ZnO nanocomposites...187
Figure 5-8 Resistance to surface erosion by partial discharges for PE/ZnO vs. PE/SEBS-MA/ZnO nanocomposites ...189 Figure 5-9 Typical stress-strain curves of selected
PE/ZnO vs. PE/SEBS-MA/ZnO materials ...190 Figure 5-10 Mechanical properties of PE/ZnO vs. PE/SEBS-MA/ZnO
nanocomposites: (a) Elastic Young’s modulus E, (b) Elongation at break EB, (c) Ultimate tensile strength UTS and (d) Elongation at ultimate tensile strength EUTS (error bars stand for standard deviation) ...192
Figure 6-1 Cartoons illustrating: sheet-die extrusion (a), films blowing extrusion using a tubular die with two different ratios: R1 (b) and R3 (c) (the coordinate system is used as a reference for the following
characterizations and discussions) ...200 Figure 6-2 Characteristic stress-strain plots of SEBS-20 based materials ...207
Figure 6-3 Characteristic stress-strain plots of SEBS-13 based materials ...207 Figure 6-4 Young’s modulus of respectively SEBS-20 and SEBS-13 sets
of materials...208 Figure 6-5 Breakdown strength of SEBS-20 based nanocomposites ...212 Figure 6-6 Breakdown strength of SEBS-13 based nanocomposites. ...212
LIST OF ABREVIATIONS
AC Alternating current
ADS equation Asymmetric Double Sigmoid equation AFM Atomic force microscopy
Al2O3 Aluminium oxide or Alumina BDS Broadband dielectric spectroscopy
BN Boron nitride
BNNS Boron nitride nanosheets
BNNT Boron nitride nanotubes
CNT Carbon nanotubes
DC Direct current
DMA Dynamic mechanical analysis
DSC Differential scanning calorimetry
E Elastic modulus
EB Elongation at break
EUTS Elongation at ultimate tensile strength FTIR Fourier transformed infrared spectroscopy
GO Graphene oxide
HDPE High density polyethylene
HRSEM High resolution scanning electron microscopy
HV High voltage
HVDC High voltage direct current
LDPE Low density polyethylene
MA Maleic anhydride
MgO Magnesium oxide
MMT Montmorillonite MWS polarization Maxwell Wagner Sillars polarization PE Polyethylene
PEO Polyethylene oxide
PMMA Poly(methyl methacrylate)
POE Polyolefin elastomer
POSS Polyhedral Oligomeric Silsesquioxane
PP Polypropylene PS Polystyrene SAOS Small amplitude oscillatory shear SAXS Small angle X-ray scattering
SBR Styrene-Butadiene rubber
SEBS Polystyrene-b-poly(ethylene-co-butylene)-b-polystyrene
SiC Silicon Carbide
Si3N4 Silicon Nitride
SiO2 Silicon dioxide or Silica
TEM Transmission electron microscopy
TiO2 Titanium Oxide
UTS Ultimate tensile strength
VFT equation Vogel Fulcher Tammann equation
XLPE Crosslinked Polyethylene
LIST OF SYMBOLS F Fragility index G’ Storage modulus G’’ Loss modulus t Thickness T Temperature
tanδ Loss tangent or dissipation factor in BDS measurements (Chapters 4 and 5) or DMA measurements (Chapters 2 and 3)
Tg Glass Transition
Tgi Interfacial Glass Transition
Wa Wetting coefficient
20A Organically modified clay Cloisite 20A
δ Surface tension
δp Polar component of the surface tension δd Dispersive component of the surface tension
δ12 Interfacial tension
∆ε Dielectric strength
ε Complex dielectric permittivity
ε’ Real part of dielectric permittivity ε’’ Imaginary part of dielectric permittivity
η* Complex viscosity
λ Thermal conductivity
σ Conductivity modulus
σ’ Real part of complex conductivity
τ Relaxation time
INTRODUCTION
0.1 Context of the research
Existing electrical insulating polymers currently used in high voltage (HV) apparatus are subjected constantly to increasing electrical and thermal stresses due to growing operating voltages and power ratings required by the current market demand and the emergence of new techniques suitable for long-distance electric power transmission such as high voltage direct current (HVDC) cables (Astrom & Lescale, 2006; Ghorbani, Jeroense, Olsson, & Saltzer, 2014). For example, in the case of extruded HVDC cables, the maximum transmission voltage level is currently equal to 525 kV. By 2030, the objective is to increase this level up to 1 MV while maintaining the present cables geometry unchanged (Amir M Pourrahimi et al., 2016; Amir Masoud Pourrahimi et al., 2016). To meet these pressing requirements, there has been a critical need for the development of new reliable and cost-effective HV insulating materials with improved dielectric and thermal performance. The ensuing research, during the last decades, led to the introduction of nanocomposites as a new conceptual design for dielectric materials used in HV insulation.
The new generation of nanocomposite dielectrics, known also as nanodielectrics (David & Fréchette, 2013; Michel F Fréchette, Trudeau, Alamdar, & Boily, 2004; Michel F Fréchette et al., 2010; Tanaka & Imai, 2013) featured several promising properties, albeit depending on the nanoparticles challenging dispersion, which unfortunately compromises their reliability and reproducibility (Balazs, Emrick, & Russell, 2006). In fact, inorganic nanoparticles typically form submicrometric and micrometric agglomerations, during nanocomposites processing, due to their incompatibility with the organic polymer hosts, which supress or reduce potential benefits associated with their nanoscopic dimensions. In addition to the agglomerations issue, the spatial distribution of nanoparticles as well as their orientation and selective location are considered as major challenges of morphology design that could affect drastically the functional properties of nanocomposites in general and those of nanodielectrics in specific, such as the breakdown strength, dielectric loss, electrical
conductivity, thermal conductivity and resistance to surface erosion, to name a few (David & Fréchette, 2013; Roy et al., 2005). Therefore, recently researchers began seeking the possibilities to design nanocomposites with prescribed morphologies that optimize their functional properties (Balazs et al., 2006; Richard A Vaia & Maguire, 2006).
Several techniques have been tested to avoid nanoparticles agglomerations, through the mediation of the interaction between the nanoparticles and polymer chains, such as surface functionalization of nanoparticles (Balazs et al., 2006; Huang et al., 2013; D. Ma et al., 2005; Polizos, Tomer, Manias, & Randall, 2010; Virtanen et al., 2014), in situ synthesis of nanoparticles (Dirix, Bastiaansen, Caseri, & Smith, 1999) or in situ polymerization of the polymer matrix (Zapata et al., 2011). Besides, some attempts to orient nanoparticles and tailor their spatial distribution were also performed (Richard A Vaia & Maguire, 2006). The current findings are partially successful in solving the issue of agglomerations. However, they are far from governing all different aspects involved within the concept of tailored dispersion. Moreover, a large-scale production based on the current techniques is often inappropriate due to several factors including increased complexity and cost, limited yield, poor efficiency and/or potential drawbacks induced by some modifiers on the dielectric properties.
A new approach is nowadays considered as a promising technique to overcome the hurdles related to the control of dispersion. It consists in using template matrices in order to guide the dispersion, the spatial distribution as well as the orientation of nanoparticles (Balazs et al., 2006). In particular, the template can be a multiphase polymer system with controllable morphology, such as block copolymers or immiscible polymer blends, which offers various possibilities to disperse nanoparticles based on its architecture and the affinity of the studied nanoparticles to one phase or another. Block copolymers are composed of covalently bonded blocks that exhibit nanoscale dimensions and self-assemble in different morphologies depending on several factors including the molecular weight of the blocks, their affinity and the ratio between them (Helfand, 1975; Sarkar & Alexandridis, 2015). Immiscible polymer
blends are mixtures of at least two polymers which cannot be homogenized. They feature several characteristic morphologies as well, of microscale dimensions though.
Owing to their ordered structures, these classes of materials might lead nanoparticles orientation, location and dispersion in the aim of optimizing the ultimate performance of the nanocomposites (Balazs et al., 2006; Carastan, Amurin, Craievich, do Carmo Gonçalves, & Demarquette, 2013; Carastan, Amurin, Craievich, Gonçalves, & Demarquette, 2014; Kao, Thorkelsson, Bai, Rancatore, & Xu, 2013; Park, Yoon, & Thomas, 2003; Sarkar & Alexandridis, 2015). Furthermore, they could exhibit useful physical properties depending on the choice of the blocks or constitutive phases of the blend. In particular, styrenic thermoplastic elastomers are block copolymers, composed of a combination of styrenic hard blocks and elastomeric soft blocks, which display excellent mechanical properties (Holden, Kricheldorf, & Quirk, 2004), electromechanical coupling (B. Kim et al., 2011) and good resistance to water treeing (Liu, Mhetar, & Freestone, 2011; Z. Ma, Jiang, Wang, & Yang, 2010). Among styrenic thermoplastic elastomers,
polystyrene-b-poly(ethylene-co-butylene)-b-polystyrene SEBS is an interesting candidate commercially available and widely used in
several industries as a compatibilizer. It consists of two polystyrene PS endblocks dispersed in the form of cylinders, lamellae or spheres within a hydrogenated Polybutadiene midblock matrix, known as poly(ethylene-co-butylene) PEB. The latter has a structure equivalent to the structure of polyethylene PE in its amorphous form which ensures good compatibility with polyolefins (Agari, Ueda, & Nagai, 1993).
0.2 Motivation and Objectives
This PhD project is part of a bigger research project conducted in collaboration between École de Technologie Supérieure (ÉTS) and Hydro-Québec Research Institute (IREQ) and involving several graduate students, in the aim of producing novel nanodielectrics for HV insulation systems and tailoring their functional properties in correlation with their microstructures. Besides, a better understanding of the underlying structure-property relationships governing the dielectric and thermal performance of nanodielectrics is expected. Within this framework, the main goal of this thesis was to design advanced SEBS
block copolymer nanocomposites with tunable nanoparticles dispersion that take advantage from SEBS architecture as a template or guiding matrix (Carastan et al., 2013; Carastan et al., 2014). Two types of nanoparticles, respectively: clay nanoplatelets and Zinc oxide (ZnO) nanospheres featuring distinguished properties and shapes were used. The effects of their patterned arrangement in SEBS, going beyond single-particle dispersion limits, on the dielectric performance of the insulating matrix were evaluated. The resulting block copolymer nanocomposites were subsequently used as master batches and blended with polyethylene (PE), a polyolefin widely used in its crosslinked form as insulating material in the current state-of-the-art extruded HV cables. The dispersion and the selective location of the nanoparticles in these particular blends were emphasized. Ultimately, their dielectric properties were compared to those of PE as a reference insulating material.
0.3 Industrial impact
From an industrial point of view, the optimization of nanoparticles spatial distribution using a block copolymer template is expected to result in an optimized use of nanoparticles properties at lower loadings and to induce as a consequence an effective cost reduction. Hence, the method might be generalized to different types of nanoparticles and versatile processing techniques (solution casting, extrusion, injection…) to evaluate its scalability. Furthermore, the as-prepared nanocomposites are expected to exhibit good compatibility with polyolefins, good resistance to water treeing and excellent electromechanical coupling, which are intrinsic properties of the styrenic thermoplastic elastomer matrix. They might be used as final materials or as master batches to blend with polyolefins for larger spectra of dielectric applications including but not limited to HV insulation, capacitors and dielectric elastomer actuators.
0.4 Approach and methodology
This PhD project was divided in three main parts that are summarized in Figure 0-1.
- SEBS/Clay nanocomposites: In addition to their reduced cost, nanoclays were selected due to their anisotropy and confirmed electron scattering effect especially
upon exfoliation and orientation (David et al., 2013; Tomer, Polizos, Randall, & Manias, 2011). Moreover, successful orientation and localization of these nanoplatelets in SEBS was recently reported (Carastan et al., 2013; Carastan et al., 2014). In this step, the effect of nanoclays and PS domains orientations as well as the effect of nanoclays selective location on the dielectric performance of the nanocomposites were emphasized. Different morphologies, i.e. isotropic vs. oriented vs. partially oriented, were obtained through the variation of the processing technique and the ratio between the blocks of SEBS. The location of nanoclays either in the hard PS block or soft PEB block was tuned through the presence or absence of maleic anhydride (MA) group grafted onto the rubber block. The latter exhibits good affinity to the functional groups attached to the nanoparticles surface. Afterward, changes in the dielectric and mechanical properties depending on the configuration were evaluated. Moreover, the interfacial dynamics were investigated as function of morphology. The results of this part led to the publication of two articles (Chapter 2 and Chapter 3) and one conference paper. A third manuscript (submitted), related to this part, is also reported in Chapter 6.
- SEBS/ZnO nanocomposites: In a second step, nanocomposites of SEBS were prepared with a different type of nanoparticles: functionalized ZnO nanospheres that are commercially available. ZnO nanoparticles were selected for their relatively high thermal conductivity and excellent UV light shielding capability as well as their confirmed ability to reduce space charge accumulation in polymer matrices, which is a key requirement for HVDC cables (Huang, Jiang, & Tanaka, 2011; Mazzanti & Marzinotto, 2013; Tian, Lei, Wang, & Wang, 2011, 2012). Only isotropic morphology was investigated in this part but nanoparticles distribution and selective location was modulated using the MA graft. The effect of morphology on the dielectric, electrical and thermal properties was emphasized at this step. A correlation with rheological properties was also established. The findings of this part were reported in one submitted article (Chapter 4) and two conference papers.
- Blend of Polyethylene and SEBS/ZnO nanocomposites: In a third step, block copolymer nanocomposites containing ZnO nanoparticles studied in the previous step
were used as master batches and blended with polyethylene. These nanocomposites were selected due to their good potential for HV insulation and HVDC cables insulation in particular. The morphology of the resulting blend nanocomposites and the selective location of ZnO nanoparticles in this blend were investigated. The effect of the obtained morphologies on the dielectric and mechanical properties was evaluated. The main conclusions of this part were reported in one submitted article (Chapter 5) and two conference papers.
The microstructures of all the fabricated nanocomposites were investigated by means of Scanning Electron Microscopy, Transmission Electron Microscopy and Atomic Force Microscopy. The morphology of the block copolymer and the arrangements of both the block copolymer domains and the nanoparticles were assessed by means of Small Angle X-Ray Scattering. Besides, the dielectric performance was evaluated by means of: dielectric broadband spectroscopy, AC breakdown strength, resistance to surface erosion by partial discharges, electrical conductivity and thermal conductivity measurements. Tensile properties and linear viscoelastic properties were evaluated in some cases as well, to achieve better understanding of the correlation between the microstructure and dielectric properties.
Figure 0-1: Main steps of the PhD project
0.5 Organization of the PhD thesis
This thesis is divided in 7 chapters. Following the introduction, a brief literature review regarding nanodielectrics and the concept of tailored nanoparticles dispersion is presented. Then, in each one of the next 5 chapters, an article related to a part of the above-mentioned parts of the project is presented. Finally, in the last chapter, a general discussion is provided and followed by conclusions and recommendations for future work.
In chapter 2, the paper untitled ‘’Styrenic block copolymer-based nanocomposites: implications of nanostructuration and nanofiller tailored dispersion on the dielectric properties’’ published in Polymer is presented. This article is based on results from the first part of the project regarding block copolymer nanocomposites containing clay nanoparticles. It emphasizes the effect of orientation of nanoparticles and morphology of the block copolymer on dielectric properties namely dielectric loss and short-term breakdown strength.
Block copolymer nanostructured template Block copolymer + 2D nanoparticle Block copolymer + 0D nanoparticle Block copolymer + 0D nanoparticle + Polyolefin
Step 2
Step 1
Step 3
Chapter 3 presents the paper ‘’ Interfacial molecular dynamics of styrenic block copolymer-based nanocomposites with controlled spatial distribution’’ published in Polymer as well. This article is also related to the first part of this project. It highlights a correlation between the studied nanocomposite morphologies and the interfacial dynamics at nanoclay-block copolymer interfaces. An extended range of complex morphologies is achieved through the variation of the blocks proportions and the processing techniques as well as the use of MA graft.
In chapter 4, the paper untitled ‘’Thermoplastic elastomer nanocomposites with controlled nanoparticles dispersion for HV insulation systems: correlation between rheological, thermal, electrical and dielectric properties’’ submitted to European Polymer Journal is presented. This study summarizes the results of the second part of this project related to block copolymer nanocomposites containing Zinc Oxide nanoparticles. In particular, a correlation between the dielectric, electrical, thermal and rheological properties and the formation of a network between ZnO nanoparticles and the block copolymer chains is established.
In chapter 5, the paper untitled ‘’Evaluation of polyethylene/thermoplastic elastomer/zinc oxide blend nanocomposites for high voltage insulation applications’’ submitted to Polymer is presented. This paper is based on the conclusions found in the third part of this project dealing with the use of block copolymer nanocomposites with controlled morphology as a master batch to blend with polyethylene. It focuses on the potential of these blend nanocomposites with tuned nanoparticles dispersion for HV insulation applications.
In chapter 6, the study ‘’Tuning mechanical and dielectric strength of clay-containing thermoplastic elastomer nanocomposites’’ is reported. The manuscript is submitted to
Polymer Engineering and Science. This work is also based on the findings of the first part of
the project. It presents an evaluation of the dielectric breakdown strength and mechanical strength of the nanocomposites with different morphologies studied in chapter 3.
In addition to the main chapters, three annexes are also included at the end of the thesis. They provide supplementary information regarding the articles reported respectively in chapters 2, 3 and 4.
For more details regarding the fundamentals of dielectric spectroscopy and the physical properties of solid insulations, good reviews can be found respectively in references (Kremer & Schönhals, 2012; C. C. Ku & Liepins, 1987) and references (Blythe & Bloor, 2005; Dissado & Fothergill, 1992; C. C. Ku & Liepins, 1987). For block copolymers (including thermoplastic elastomers) and polymer blends, respectively references (Holden et al., 2004; Mai & Eisenberg, 2012) and reference (Paul & Bucknall, 2000) can be consulted.
CHAPITRE 1
NANOCOMPOSITES WITH TUNED MORPHOLOGY FOR HV INSULATION
Polymer nanocomposites have shown promise recently for the development of advanced materials intended for use in a large spectrum of applications including dielectric applications and HV insulation. Their established and foreseen superior properties are often correlated with the formation of polymer/nanoparticle interfacial layers featuring distinct behavior compared to the bulk polymer host.
In this chapter, the concept of polymer nanocomposites and nanodielectrics is reviewed, with a focus on the impact of the interfacial region. Besides, a summary of the most common types of nanoparticles investigated, during the last decades, in HV insulation is presented. The influence of several parameters such as the nanoparticles shape, size, orientation and quality of dispersion on the efficiency of their use in nanodielectrics is investigated as well. Then, the concept of controlled nanocomposites morphology is emphasized. In particular, the effect of tuning nanoparticles dispersion in polymer blends and block copolymers, used as template polymer matrices, on their dielectric performance is highlighted. Finally, a review of the polymers and nanoparticles studied in the present project is reported.
1.1 Definition of nanocomposites and nanodielectrics
1.1.1 Polymer nanocomposites definition
Polymer nanocomposites are polymeric materials containing particles, with at least one dimension below 100 nm. Polymer nanocomposites differ from conventional microcomposites in two major aspects:
- Particles size in the nanometer range: this feature results in significantly higher specific surface area, i.e. surface area per mass of a material, compared to similar masses of larger scale particles. To illustrate better the tremendous effect of
nanoparticles size on the specific surface area, one can compare the total surface area of a single solid cube of volume equal to 1 cm3 with the same volume made up of 1 nanometer-sized cubes; each of them having a surface area equal to 6 nm2. The latter contains 1021 nanoscale cubes with a total surface area equal to 6000 m2 compared to only 6 cm2 for the single solid cube ("What is so special about the nanoscale? ,"). - Small fraction of fillers compared to conventional composites: This can be also
considered a consequence of the nanometric size. In fact, when incorporated in a polymer matrix, the large surface area of nanoparticles constitutes an interaction zone that comes into contact with the surrounding polymer and favorably affects its properties. As the particle size decreases, the specific surface area increases and the interfacial region becomes more prominent for the same amount of particles, as illustrated in Figure 1-1. As a consequence, lower loading of nanoparticles is needed, compared to microparticles, to achieve equivalent or higher properties.
Figure 1-1: Illustration of size effect on interfacial volume: increasing dominance of interfacial areas with decreasing filler sizes
Taken from (Andritsch, Kochetov, Gebrekiros, Morshuis, & Smit, 2010)
1.1.2 Definition of nanodielectrics
A dielectric material is an electrical insulating material that has the ability to polarize in the presence of an electric field. When an electric field is applied, a dielectric responds by distorting slightly its charges from their equilibrium position and redistributing them in a
more organized form: positive charges are shifted toward the field and negative charges in the opposite direction. The resulting dipoles orient parallel to the electric field with opposite polarity and create an internal field that reduces the overall field within the dielectric. There are three basic groups of dielectrics: solid, fluid and gaseous dielectrics. In particular, electrically insulating polymers belong to the group of solid dielectrics. Comprehensive details regarding insulating polymers, their electrical properties and the polarization phenomena can be found in (Blythe & Bloor, 2005; Dissado & Fothergill, 1992; Kremer & Schönhals, 2012; C. C. Ku & Liepins, 1987).
The term nanometric dielectric or nanodielectric for short was proposed for the first time in 2001 by Fréchette et al. (M. F. Fréchette, Trudeau, Alamdari, & Boily, 2001) as a “multi-component dielectric processing nanostructures, the presence of which lead to changes in one or several of its dielectric properties”. This notion includes nanostructured ceramics and polymer nanocomposites. In particular, in last decades, an important and growing fraction of nanodielectrics has been developed based on the second group, namely polymer nanocomposites (M. F. Fréchette et al., 2001). It is now well established that the addition of specific nanoparticles to regular insulating polymers used as solid dielectrics can improve their performance in different aspects. Hence, the as-developed nanodielectrics have gained attraction in different dielectric applications including HV insulation, high energy density capacitors and dielectric elastomer actuators (Camargo, Satyanarayana, & Wypych, 2009; David & Fréchette, 2013; Michel F Fréchette et al., 2010; Pleşa, Noţingher, Schlögl, Sumereder, & Muhr, 2016; Tanaka, Montanari, & Mulhaupt, 2004). However, it is worth noting that the extent of the achieved improvement is strongly dependent on the properties of the interfacial area, which is actually the case for all nanocomposites. The interface region depends not only on the nanoparticles size and specific surface area but also on their dispersion/spatial distribution and their compatibility with the polymer host.
1.1.3 Theories and models regarding the interfacial region
Few properties of composite materials, such as the mechanical modulus, can be roughly estimated from the inherent properties of the polymer matrix and the added particles
respectively, using basic approaches such as the rule of mixtures (Bartczak, Argon, Cohen, & Weinberg, 1999; Selvin, Kuruvilla, & Sabu, 2004; Zare & Garmabi, 2014). However, the majority of them, including electrical and thermal properties, are more difficult to predict because they depend strongly on polymer/particles interactions in addition to the usual factors. In nanocomposites, this phenomenon is even more pronounced due to the presence of an important interfacial region. In this context, it was repeatedly observed that effective properties of nanocomposites are often far from the predictions of basic models and that the achieved/potential enhancements are rather governed by the properties of the interfacial region (Heid, 2015; Lewis, 2005; Nelson & Hu, 2005; Rittigstein, Priestley, Broadbelt, & Torkelson, 2007; Smith, Liang, Landry, Nelson, & Schadler, 2008; Zare & Garmabi, 2014). Therefore, several models have been proposed to describe the interaction zone in nanocomposites, on the basis of chemical and electrical analysis (Heid, 2015; Kremer & Schönhals, 2012; Pitsa & Danikas, 2011; Ioana Preda, Castellon, Frechette, & Agnel, 2014; Tanaka, Kozako, Fuse, & Ohki, 2005; Zou, Fothergill, & Rowe, 2007), in order to understand their electrical and thermal properties. These models based on different approaches and assumptions can be more or less accurate in describing the experimental results, depending on the property and the system studied. But, overall there is a general consensus on the great role of the interface region. One basic theoretical model that was initially developed is the interlayer model treating the case of a matrix-inclusion system with an interfacial layer (Kremer & Schönhals, 2012). Later, several models have been proposed such as the multi-core model proposed by Tanaka et al. (Tanaka et al., 2005) which suggests that the interfacial zone is divided in several layers featuring different physical properties. These two models will be reviewed briefly in the following sections.
1.1.3.1 Interlayer model
A polymer composite with an interfacial layer between the filler and the matrix, as illustrated in Figure 1-2, can be modeled using the asymmetrical effective medium approach. The analytical solution, also known as the interlayer model, can be used to describe several macroscopic properties including the complex dielectric permittivity (Kremer & Schönhals, 2012).
Figure 1-2: Polymer composite with an interfacial layer between the filler and the matrix
Taken from (Kremer & Schönhals, 2012)
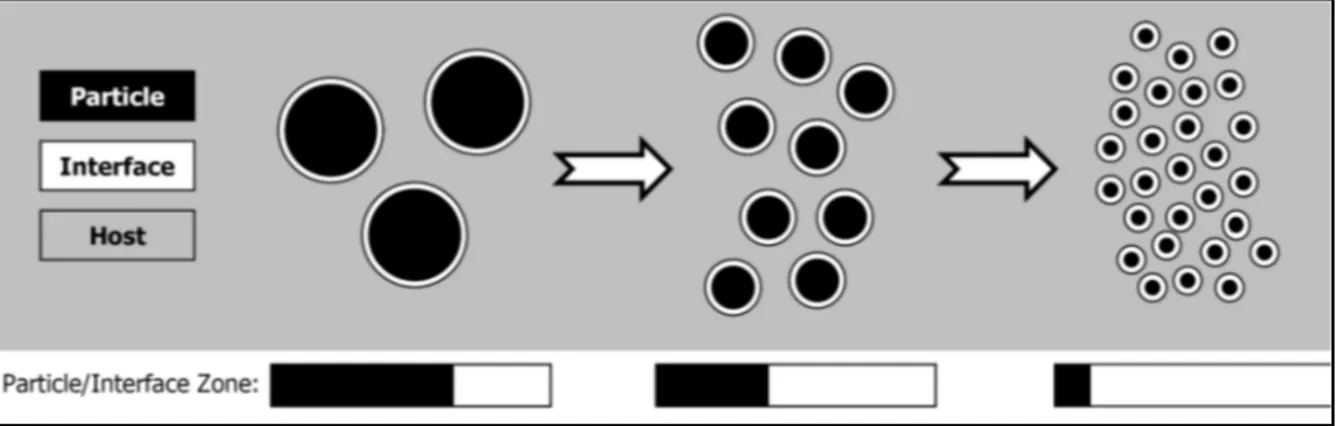
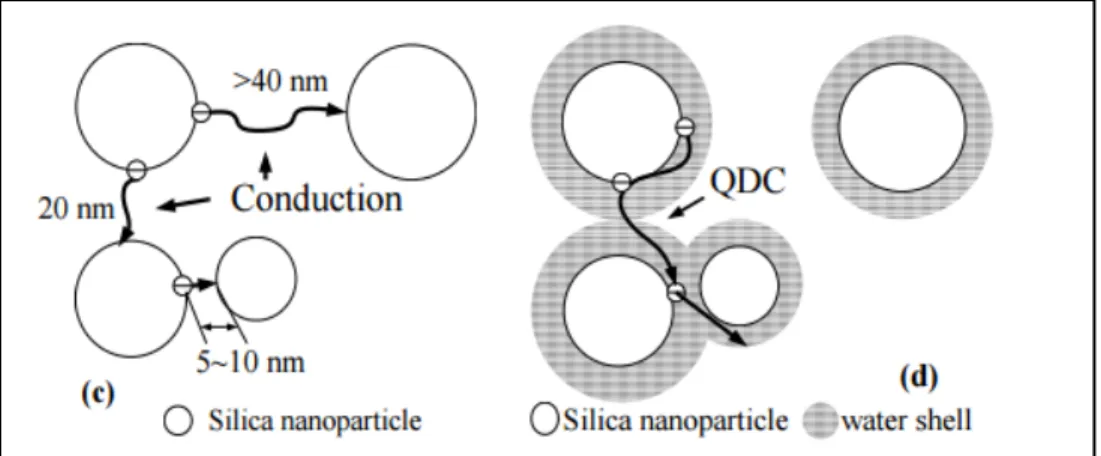
In the case of dielectrics and nanodielectrics, this model can be particularly interesting to describe the behavior of dielectrics and nanodielectrics containing water sensitive particles such as metal oxides. In fact, humidity absorption often leads to detrimental effects on the dielectric behavior of the polymer matrix. In particular, simultaneous increase of the dielectric constant and dielectric loss are commonly reported since water has relatively high dielectric constant and high electrical conductivity. The increase of the dielectric loss is dominant at low frequencies and attributed to quasi DC conductivity increase. This behavior is explained by the fact that absorbed water resides in the interfacial region leading to the formation of a conductive interlayer between the particles and the polymer matrix. In addition to the increase of conductivity and dielectric loss, this conductive interlayer gives rise to an interfacial loss process at low frequencies. Furthermore, in nanocomposites, water shells around the nanoparticles have higher probability to overlap with increasing concentrations as illustrated in Figure 1-3 due to the increased interfacial area and reduced interparticle distance, providing conduction paths for charge carriers (Kremer & Schönhals, 2012; Zou et al., 2007).
Figure 1-3: Conductive water layer surrounding nanoparticles embedded in a polymer matrix: (a) separate water layers (b) overlapping water shells
Adapted from (Zou et al., 2007)
1.1.3.2 Multi-core model
According to this model, the interfacial layer is composed, on the basis of chemical and electrical analysis, of 3 different physical layers overlapped by an electric diffuse layer, as illustrated in Figure 1-4 (Tanaka et al., 2005). Each of these layers has a distinguished physical, chemical and/or electrical behavior, as following:
- The bonded layer: this first layer is tightly bonded to the surface of nanoparticles by coupling agents.
- The bound layer: this second layer consists of polymer chains strongly bound to the first layer and the surface of the nanoparticles. The thickness of the bound fraction, in the range from 2 to 9 nm, is increasing with the strength of polymer-nanoparticle interaction. The mobility of chains belonging to this region is particularly altered but the polymer conformation, local density and crystallinity are also subjected to changes, as compared to the bulk polymer.
- The loose layer: this third layer is loosely interacting with the second layer but still affected chemically by its behavior and expected to exhibit different behavior from the bulk. Its thickness is up to several tens of nanometers.
- The diffuse electric layer: Charge injection from nanoparticles to polymer matrix often occurs resulting in the formation of charge distribution layer. This diffuse layer is superposed to the 3 physical layers explained above.
Moreover, the overlapping of multiple interaction zones corresponding to several nanoparticles might result in collaborative effects and further complication of the resulting macroscopic behavior. Models treating this situation were also investigated (Ioana Preda et al., 2014).
Figure 1-4: Multi-core model Taken from (Tanaka et al., 2005)
1.1.4 Nanoparticles vs. Microparticles in polymer based insulations
The performance of electrically insulating polymers is reflected by their resistance to electrical degradation when placed in operational conditions. This degradation is a complex phenomenon that depends on a multitude of interdependent parameters such as dielectric losses, electrical conductivity, resistance to space charge accumulation as well as the thermal
and mechanical properties (Blythe & Bloor, 2005; Dissado & Fothergill, 1992). Although it is a long-term process, the susceptibility of polymers to electrical degradation might be reasonably evaluated by short-term measurements such as the short-term breakdown strength or mid-term measurements such as the resistance to surface erosion by partial discharges. Longer-term measurements such as voltage endurance and resistance to electrical treeing remain the most trustable tools but unfortunately time consuming (Tian et al., 2012). An exhaustive review of all the notions covered by the subject of electrical degradation of polymers might be found in (Blythe & Bloor, 2005; Dissado & Fothergill, 1992; C. C. Ku & Liepins, 1987).
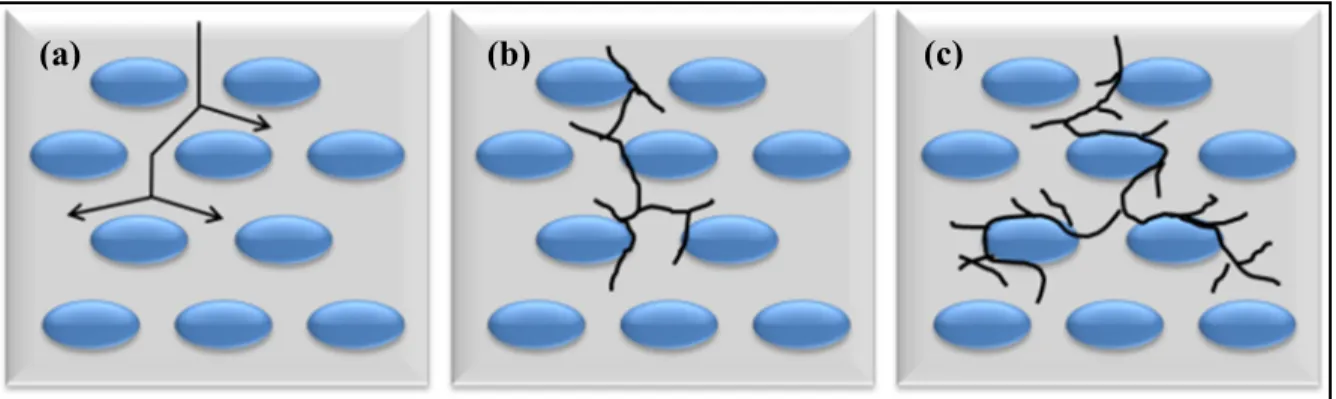
To overcome the limitations faced by the existing polymer insulating materials, both microparticles and nanoparticles with desired intrinsic properties were investigated. Chronologically, microparticles raised interest first. In most of the cases, they resulted in enhanced heat dissipation and resistance to surface erosion (M. Frechette et al., 2012; Huang et al., 2011; Iyer, Gorur, & Krivda, 2012; Kochetov, Andritsch, Morshuis, & Smit, 2010; Tanaka, Matsuo, & Uchida, 2008), unfortunately at the cost of reduced dielectric and mechanical strengths (Fleming, Ammala, Casey, & Lang, 2008; Z. Li, Okamoto, Ohki, & Tanaka, 2010). In fact, inorganic microparticles incorporated in a polymer matrix result in the formation of defects and voids of micrometric size in the regions surrounding the particles. These defects constitute zones of reduced mechanical strength and increased electrical stress in addition to the distortion of the electric field which arises from the mismatch in permittivities or conductivities between the polymer and the inorganic filler. The increase of the electrical stress in these weak zones leads to initiation and propagation of electrical trees, i.e. interconnected channels which are generally filled with gas, through the polymer matrix and early dielectric failure (Blythe & Bloor, 2005; Danikas & Tanaka, 2009; Dissado & Fothergill, 1992; C. C. Ku & Liepins, 1987; Z. Li et al., 2010).
Progressively, nanoparticles replaced microparticles in composites in order to avoid the abovementioned issues. Given their excellent intrinsic properties, their nanoscale dimensions and their high interfacial area, nanoparticles were reported to improve the overall dielectric