L'HABITAT DE LA SAUVAGINE EN PÉRIODE DE NID IF ICA TION DANS LE QUÉBEC FORESTIER
MÉMOIRE PRÉSENTÉ
COMME EXIGENCE PARTIELLE DE LA MAÎTRISE EN BIOLOGIE
EXTENSIONNÉE DE
L'UNIVERSITÉ DU QUÉBEC À MONTRÉAL
PAR
LOUIS-VINCENT LEME LIN
Mise en garde
La bibliothèque du Cégep de l’Témiscamingue et de l’Université du Québec en Abitibi-Témiscamingue a obtenu l’autorisation de l’auteur de ce document afin de diffuser, dans un but non lucratif, une copie de son œuvre dans Depositum, site d’archives numériques, gratuit et accessible à tous.
L’auteur conserve néanmoins ses droits de propriété intellectuelle, dont son droit d’auteur, sur cette œuvre. Il est donc interdit de reproduire ou de publier en totalité ou en partie ce document sans l’autorisation de l’auteur.
générales. Le premier article est prêt à soumettre au périodique scientifique The Journal of Wildlife Management. Le second article a quant à lui été accepté pour publication dans le périodique scientifique Avian Conservation and Eco/ogy, dans une section spéciale ayant pour thème la résilience des oiseaux boréaux face aux perturbations. Je suis l'auteur principal de ces articles et j'ai procédé à toutes les étapes du traitement et de l'analyse des données. Louis Imbeau, Marcel Darveau et Daniel Bordage en sont les co-auteurs.
Je désire adresser de sincères remerciements à mon directeur de travaux, Louis Imbeau, professeur à I' UQAT, ainsi qu ' à mon co-directeur, Marcel Darveau, chef de la conservation boréale chez Canards Illimités Canada et professeur associé à l'Université Laval, pour leur soutien et leur disponibilité durant le projet. Je remercie Daniel Bordage, du Service canadien de la faune, région du Québec, pour ses multiples collaborations aux différentes étapes de mon projet de maîtrise, de même qu ' André Desrochers, professeur à l'Université Laval, d'avoir siégé au comité d'orientation. Je suis également reconnaissant envers les membres externes du comité d'évaluation, soit François Fournier et Eric Reed .
Mon projet de maîtrise est basé sur les données de l'inventaire aérien du Plan conjoint sur le Canard noir-Service canadien de la faune au Québec. Je tiens à souligner le travail des nombreuses personnes ayant contribué à sa mise en œuvre et à sa réalisation. Finalement, je tiens à remercier l'organisme Canards Illimités Canada et toute son équipe du bureau de Québec de m'avoir fourni un environnement de travail agréable et stimulant.
LISTE DES TABLEAUX ... ... .. .. ... ... ... ... ... .... vii
RÉSUMÉ .... .... ... .... .... ... ... .... ... ... .... . viii
INTRODUCTION GÉNÉRALE ... ... ... ... ... .... ... ... 1
La sauvagine dans les forêts du Québec ... .... 1
L' habitat en période de nidification ... ... .... .. .... ... .. ... ... ... ... .. 1
La nidification dans le cycle vital.. ... ... ... ... .... .... ... ... 2
Les études sur la sauvagine au Québec ... ... ... .. ... ... ... ... ... .. .. 3
Objectifs de l'étude ... .... ... ... ... ... ... .. ... ... 4
ARTICLE I Forest Wetlands Use and Selection by Breeding Waterfowl in Quebec ... ... ... 5
Introduction ... ... ... .... ... ... ... ... ... ... ... .. .. .. 8 Study area ... .. ... .... .... ... .. ... ... ... ... ... ... ... ... 9 Methods .... ... ... ... .. ... ... ... ... ... .. .. ... ... .... ... 10 Results ... ... ... ... .. ... ... ... ... .... ... .... ... ... .. ... ... .. ... ... . 13 Discussion ... ... ... ... ... .. .... ... ... ... ... ... .... 15 Management implications .. ... ... .. ... ... ... ... ... .... ... ... ... .... 19 Acknowledgments ... ... ... 19 Literature cited ... ... ... ... ... ... ... .. ... .... ... .. ... ... ... ... .. ... ... 20 ARTICLE II Local, Short-term Effects of Forest Harvesting on Breeding Waterfowl and Common Loon in Forest-dominated Landscapes ofQuebec ... ... ... ... .... ... .... ... ... 32
Introduction ... ... ... ... .. .... ... ... .. ... 35 Methods ... .. .. .... ... ... ... .. ... ... ... ... ... .... 38 Results ... ... ... .. ... ... ... .... 42 Discussion ... ... ... ... ... ... ... ... ... .. ... ... 43 Conclusion ... ... .... .. ... .. .. ... .. ... ... ... ... ... .. ... ... .... ... 46 Acknowledgments ... ... ... .... ... ... ... ... ... ... .. ... ... . 46 Literature cited ... ... ... .. ... ... ... .. .. ... ... ... ... ... ... ... 47
LISTE DES RÉFÉRENCES .. ... ... .. ... ... ... ... ... ... ... ... ... ... 61 APPENDICE .. .... ... ... ... ... .. .. ... ... .. ... ... .. .. .. ... .. ... .. ... ... ... ... ... ... 65
Wildlife Service aerial survey in Quebec. Only survey plots used in the analyses are shown. Larger squares, representing 10 x 1 0-km plots, each overlap one 5 x 5-km plot. .... .... ... .... 30 Figure 2. Correspondence analysis (CA) ordination diagram (bi-plot) of waterfowl and common loon habitat associations, in forest landscapes of Quebec, Canada, 1990-2005. CA was performed on indicated breeding pair two-way contingency table computed for i) species by ii) ali combinations of aquatic vs. shoreline habitat types and wetland habitat types. Axis I corresponds to an amount of open water gradient and axis II to a water movement gradient. The two first character positions of the habitat classes are aquatic and wetland habitat types and the two last, where applicable, are shoreline habitat types. Habitat codes are: Lo
= lake
offshore zone, Ls =lake shore zone, Ri = river, Cp= connected pond, Ip = isolated pond, St = stream, Ow = open wetland, Ss = shrub swamp, Sf = flooded swamp, Is = island, and Fo = forest. Species codes are: CaGo =Canada goose, WoDu =wood duck, AmWi = American widgeon, BwTe = blue-winged teal, GwTe = green-winged teal, ABDu= American black duck, Mali = mallard, RnDu = ring-necked duck, Seau = greater scaup and lesser scaup, CoGo = common goldeneye, BaGo = Barrow's goldeneye, Buff = bufflehead, SuSe= surf
scoter, BISe = black scoter, CoMe= common merganser, HoMe = hooded merganser, RbMe = red-breasted merganser, and CoLo = common loon ... 31Article Il
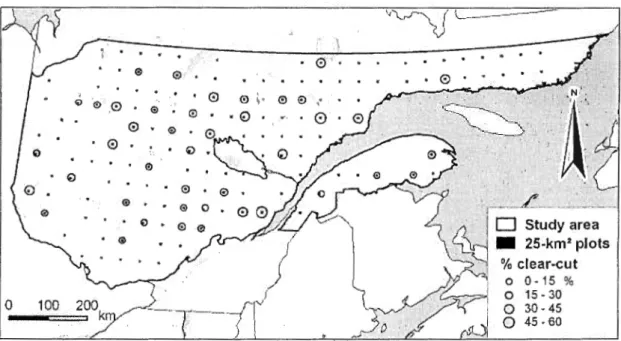
Figure 1. The study area, a 540,000-km2 forest-dominated terri tory, with the 156 25-km2 square plots. Circular grey-shaded pictograms symbolize clear-cut density (%) in each plot calculated over the total· area located within 1-km from any clear-cut area. Low values indicate small, scattered clear-cut areas whereas high values (max. 59%) indicate large, clustered clear-cut areas ... 54 Figure 2. Population trends of ground nesters and cavity nesters, including the 7 most abundant species (American Black Duck, Ring-necked Duck, Common Goldeneye, Common Merganser, and Canada Goose, Common Loon, and American Greed-winged Teal). Population sizes are IBP for the whole study area (values extrapolated from survey plots to the whole 540,000-km2 study area; left vertical axis) and IBP 1 100 km2 (right vertical axis) for the 1990-2003 period. Population trends for ali species surveyed are available in Bordage et al. (2003) ... 55 Figure 3. Example of a harvested plot (partial) with ali indicated breeding pair (IBP) locations of a single survey year, as well as an example of an IBP (black star) with its 1-km radius circ le. For that particular IBP, the percentage of nesting habitat undisturbed by timber harvesting was 47% for ground-nesting species and 45% for cavity-nesting species (see Methods for details on definition of nesting habitat). Clear-cut areas used for these calculations are the same for pre- and post-harvest periods ... 56
undisturbed nesting habitat for the pre-harvest period. These values changed to 141 IBP and 18%, respectively, post-harvest. P-values are that of the Mann-Whitney U-tests. It is worth noting that in ali cases, curves of IBP raw counts were higher post-harvest than pre-harvest, and post-harvest relative counts (%) had a generally lower percentage of nesting habitat left undisturbed by timber harvesting than pre-harvest relative counts ... ... ... ... ... 57
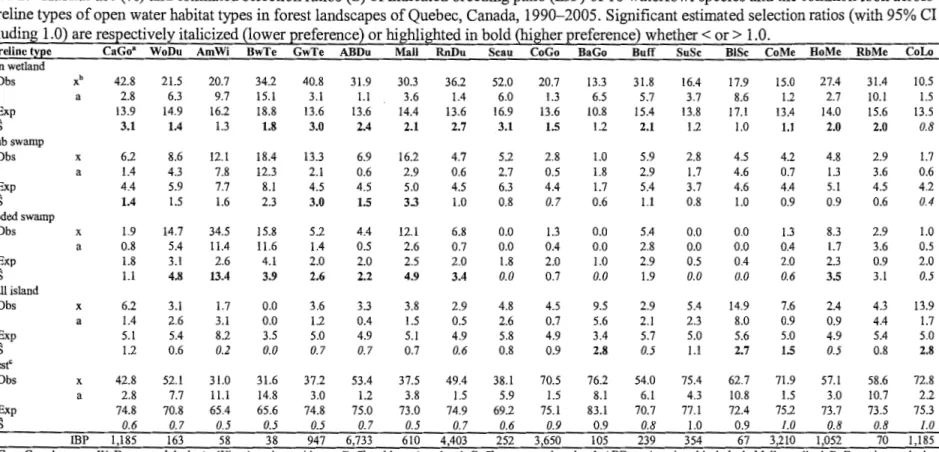
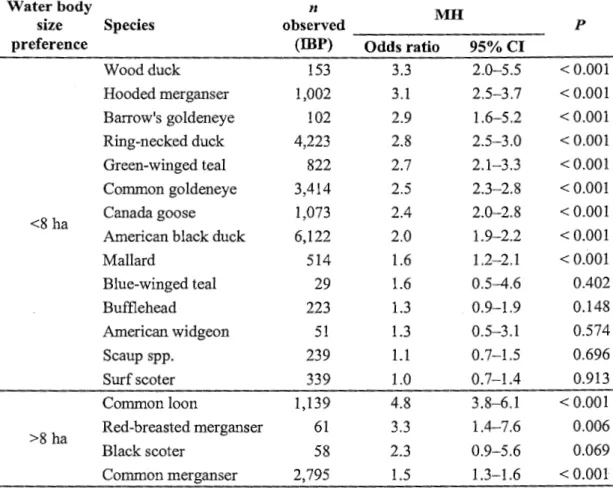
landscapes of Quebec, Canada, 1990- 2005. Significant estimated selection ratios (with 95% CI excluding 1.0) are respectively italicized (lower preference) or highlighted in bold (higher preference) whether <or> 1.0 ... .. ... ... ... ... ... .. ... 24 Table 2. Habitat use(%) and estimated selection ratios (S) of indicated breeding pairs (IBP) of 18 waterfow1 species and the common loon across shoreline types of open water habitat types in forest landscapes of Quebec, Canada, 1990-2005 . Significant estimated selection ratios (with 95% CI excluding 1.0) are respectively italicized (lower preference) or highlighted in bold (higher preference) whether <or> 1.0 ... ... ... 25 Table 3. Habitat use(%) and estimated selection ratios (S) of indicated breeding pairs (IBP) of 18 waterfowl species and the common loon across shoreline types of streams in forest landscapes of Quebec, Canada, 1990- 2005. Significant estimated selection ratios (with 95% CI excluding 1.0) are respectively italicized (lower preference) or highlighted in bold (higher preference) whether <or> 1.0 ... .. ... 26 Table 4. Preference of indicated breeding pairs (IBP) of 18 waterfowl species and the common loon for waterbodies < vs. > 8 ha, in forest landscapes of Quebec, Canada, 1990-2005. Expected values were derived from shoreline length distribution with shoreline type as control variable. Mantei-Haenszel (MH) odds ratio estimate is a measure of the strength of the preference. P values are that of the associated Cochran-Mantel-Haenszel statistic (1 df).27 Table 5. Summarized associations of indicated breeding pairs of 18 waterfowl species and the common loon for broad aquatic, wetland, and shoreline habitat types, in forest landscapes ofQuebec, Canada, 1990-2005 .... ... ... ... ... .. ... ... ... .. ... .. ... ... 28 Article II
Table 1. Results of the nonparametric Mann-Whitney U-tests comparing pre- and post-harvest distributions of the percentage of nesting habitat left undisturbed by timber post-harvesting within a 1-km radius of indicated breeding pair (IBP) locations. Tests include ali IBP located within 2 km of clear-cut areas. Median percentages of undisturbed nesting habitat and pre/post median differences are presented: a negative difference indicates a lower undisturbed nesting habitat (higher % of clear-cut) after treatment than before, and vice-versa. Statistics are given for ali individual species totaling over 30 IBP, for guilds of ground nesters and cavity nesters, and for ali species combined ... ... ... .... ... ... .... . 53
milieu forestier. Cette étude est basée sur les données récoltées lors de l' inventaire aérien du Plan conjoint sur le Canard noir et du Service canadien de la faune. Il s' agit d' un inventaire effectué en hélicoptère et qui échantillonne un territoire de 540 000 km2 en 156 quadrats de 25 km2 chacun. Les données relatives à l' habitat proviennent des cartes écoforestières numériques ( 1:20 000). Les localisations de couples nicheurs des espèces observées ont été mises en relation avec les principaux types d' habitats, dans une analyse de l'utilisation et de la sélection de l'habitat. Plus de 32 000 observations de couples nicheurs ont été distribuées parmi sept grands types de milieux humides et aquatiques, et six types de milieux riverains. Cela a révélé l'importance des petites étendues d'eau et des ruisseaux pour la reproduction de la sauvagine. L' effet local et à court terme (environ 4 ans) des coupes forestières sur les populations de canards cavicoles et d' espèces nichant au sol a également été évalué. Aucun effet négatif n'a été détecté chez les espèces cavicoles, alors qu'un effet positif semble avoir eu lieu chez la Bernache du Canada et la Sarcelle d ' hiver, deux espèces nichant au sol. Cette étude dresse donc un portrait des relations entre les espèces et les principaux types d ' habitat, confirme l'efficacité de la carte écoforestière pour la caractérisation des milieux humides, et appuie l'hypothèse de la résilience des espèces de sauvagine face à un certain niveau de perturbation résultant de la récolte forestière au Québec.
sauvagine. On estime à plus de 350 000 le nombre de couples d'oies et de canards qui reviennent nicher annuellement dans les forêts de la province après avoir hiverné dans des contrées plus chaudes du continent (Bordage et al. 2003a). Les populations de ce cortège d'oiseaux nicheurs appartiennent à des espèces dont l' aire de nidification s'étend bien au-delà du Québec forestier, que ce soit dans les forêts tempérées au sud, vers les plaines du centre du continent et au-delà des Rocheuses, dans les zones plus nordiques de la toundra, et même en Europe et en Asie (Bellrose 1976, Cramp et Simmons 1977). Les espèces de sauvagine constituent par ailleurs une ressource internationale et font l' objet d'une importante récolte de la part des chasseurs sportifs (Dupuis et al. 1996). Ainsi, en tant que groupe faunique hautement convoité et largement répandu, les espèces de sauvagine ont reçu beaucoup d'attention, mais bien souvent dans des milieux passablement différents des habitats québécois (Baldassarre et Balen 2006).
L'habitat en période de nidification
L'habitat de nidification des espèces de sauvagine doit répondre aux multiples besoins vitaux rencontrés durant cette période. Il comprend essentiellement 1 'environnement du nid, des corridors de déplacement et des sites d'alimentation pour les deux membres du couple, et ce, depuis la ponte jusqu'à ce que les jeunes quittent le nid, peu après l'éclosion.
Tout d'abord, l'habitat de nidification doit receler un site de nidification préférablement isolé des prédateurs et des rigueurs du climat. Pour établir leur nid, les espèces de sauvagine recherchent pour la plupart un couvert végétal dense, exception faite de la Bernache du Canada (Branta canadensis), qui utilise fréquemment des sites offrant une bonne visibilité
(Mowbray et al. 2002), et des canards cavicoles, qui requièrent des cavités d' arbres de grande dimension (Prince 1968, Peterson et Gauthier 1985).
La période couvrant la ponte et l'incubation est physiologiquement très exigeante pour la femelle d'espèce nidifuge (Drobney 1980, Hohman 1985, Gauthier 1993). Celle-ci doit
optimiser le moment et la taille de sa ponte en fonction de ses propres ressources énergétiques pour maximiser son succès reproducteur. L'habitat de nidification doit donc aussi être suffisamment productif pour permettre à la femelle de subvenir aux exigences alimentaires de la vitellogénèse de même qu'à sa propre régulation pendant la durée de l'incubation (Drobney 1982). Pour certaines espèces, cela peut signifier un habitat aux eaux claires et poissonneuses ou, pour d'autres, un habitat riche en invertébrés benthiques.
La proximité d'un site d'élevage de qualité pour les jeunes est un autre facteur susceptible d'influencer l'utilisation d'un habitat durant la nidification (Staicer et al. 1994). En étudiant la race eurasienne de la Sarcelle d'hiver (Anas crecca caroliniensis), Elmberg et al. (2005)
ont constaté que les femelles nichant le plus hâtivement utilisaient les meilleurs lacs et obtenaient les meilleurs taux de reproduction. Bien que le déplacement de couvées soit un comportement couramment rapporté (Wayland et McNicol 1994, Maisonneuve et al. 2000), une abondance immédiate de nourriture pour les canetons ne peut toutefois qu'être favorable à leur survie (Toft: et al. 1982, Staicer et al. 1994, Gunnarsson et al. 2004).
Tout environnement local s'inscrit à la fois dans un contexte biogéographique régional (Brown et al. 1996). Ainsi, l'aire géographique de répartition des espèces est un élément important à considérer lorsque de vastes territoires sont étudiés ou lorsque des résultats observés en certaines localités sont extrapolés. Alors que les gradients environnementaux, tels le climat et la disponibilité de nourriture à l'échelle continentale, déterminent la possibilité pour une espèce de se perpétuer dans un territoire, d'autres facteurs, tels la compétition interspécifique, conditionnent la probabilité pour l'espèce d'occuper le territoire. Ceux-ci expliqueraient par exemple le fait que le Canard noir soit absent de la région des cuvettes des prairies, un habitat où il se serait probablement très bien établi n'eût été de la présence d'autres espèces de sauvagine.
La nidification dans le cycle vital
Pour bien comprendre les mécanismes qui déterminent les relations entre l'habitat de nidification et les espèces de sauvagine, il importe également de situer 1 'importance de ce stade de la reproduction par rapport au cycle de vie complet. Les populations de sauvagine sont en effet susceptibles de se voir réguler à plusieurs étapes de leur cycle de vie. Dans une revue exhaustive des facteurs influençant les niveaux de population de Canard noir, figuraient
aux côtés de la qualité de l'habitat de reproduction la qualité de l'habitat d'hiver, la récolte par la chasse, la compétition interspécifique (avec le Canard colvert), les maladies et les parasites (Conroy et al. 2002). Ces facteurs sont représentatifs de ceux qui régissent l'ensemble des espèces de sauvagine. L'habitat de nidification, qui fait partie de. l'habitat de reproduction, constitue donc un facteur important parmi d'autres, et tous sont impliqués de façon complexe dans la détermination des niveaux des populations. Il demeure toutefois largement reconnu qu'un habitat de nidification de qualité est primordial pour la sauvagine (Baldassarre et Bolen 2006).
Les études sur la sauvagine au Québec
On dénombre au Québec environ une vingtaine de publications scientifiques issues d'inventaires spécifiques et qui ont permis d'approfondir les connaissances sur divers aspects de la reproduction de la sauvagine dans les écosystèmes de forêt continue (p. ex.: Bouvier 1974, Courcelles et Bédard 1979, DesGranges et Darveau 1985, DesGranges et Rodrigue 1986, DesGranges et Darveau 1988, Reed et al. 1994, Carrière et Titman 1998, Robert et al. 2002, Sénéchal 2003, Maisonneuve 2004, Savard et Robert 2007). Le territoire forestier du Québec est vaste et peu accessible, ce qui, à chaque fois, rend laborieux le travail d'acquisition de données sur les espèces qui y nichent. De plus, on y observe une densité généralement inférieure à 1 couple nicheur/km2 de territoire (Lemelin et al. 2004), laquelle
une fois répartie entre les multiples espèces présentes, ajoute à la difficulté. Des travaux de recherche à grande échelle exigent la réalisation de coûteux inventaires. Au Québec, il existe des banques de données contenant de l'information sur les oiseaux nicheurs, comme par exemple le Relevé des oiseaux nicheurs, les données d'Étude des populations d'oiseaux du Québec et celles de l'Atlas des oiseaux nicheurs du Québec (Gauthier et Aubry 1995). Toutefois, celles-ci ne visent principalement qu'à confirmer la présence et la nidification de l'ensemble des espèces aviaires et voient leur effort d'échantillonnage réduit dans les grandes zones forestières . Enfin, la sauvagine bénéficie d'un inventaire dédié : 1 'inventaire aérien du Plan conjoint sur le Canard noir (PCCN}-Service canadien de la faune (SCF). Cet inventaire est réalisé annuellement depuis 1990 et a généré une importante base de données, exploitée principalement pour estimer les niveaux des populations servant à l'établissement des quotas de chasse, puis, de façon secondaire, pour cartographier la répartition géographique des
espèces (Bordage et Grenier 1995, Robert et al. 2000, Lemelin et al. 2004). La méthode d'inventaire a été mise point après plusieurs années de travaux préliminaires (Bordage 1987, 1988a, 1988b) ayant également permis de produire quelques rapports et articles sur la sauvagine et ses habitats (Grenier et al. 1993, Grenier et al. 1994, Robert et al. 2000, Bordage et al. 2002). C'est précisément à partir de cette base de données qu'ont été explorées les questions abordées par ce projet.
Objectifs de l'étude
L'objectif général de la présente étude est d'explorer et de documenter les relations entre les espèces de sauvagine (incluant par extension le Plongeon huard [Gavia immer]) et leur habitat en période de nidification dans les écosystèmes forestiers du Québec. Elle vise par le fait même à tirer profit de l'importante somme de données recueillies lors de l'inventaire aérien du PCCN-SCF et s'articule en deux articles indépendants. Dans les deux cas cependant, les informations concernant 1 'habitat ont été tirées des cartes écoforestières numériques (1 :20 000) du Ministère des Ressources naturelles et de la Faune du Québec.
Le premier article a pour sujet 1 'utilisation et la sélection par les espèces de sauvagine des types d'habitats humides (ruisseaux, étangs, lacs, marécages, etc.). Il s'agit d'une analyse visant à (1) quantifier et évaluer l'importance des types d'habitat pour chaque espèce; à (2) dresser un portrait écologique comparatif des espèces; et à (3) tester l'utilité de la carte écoforestière numérique en tant qu'outil de base pour classifier et cartographier les habitats humides et aquatiques d'un groupe faunique tel que la sauvagine.
Le second article s'attarde à évaluer l'effet de la coupe forestière sur les populations de canards cavicoles et nichant au sol. Plus précisément, les objectifs sont de (1) détecter la présence d'effets locaux et à court terme sur les communautés de sauvagine et (2) d'en évaluer l'importance sur les populations nicheuses.
Ces deux articles sont suivis de la conclusion générale du projet de maîtrise, dans laquelle seront abordés le degré d'atteinte de ses objectifs, sa contribution au savoir collectif, ainsi que quelques perspectives pour la recherche future .
l_lemelin@ducks.ca Marcel Darveau
Ducks Unlimited Canada and Laval University; m_darveau@ducks.ca Louis lmbeau
Université du Québec en Abitibi-Témiscamingue; louis.imbeau@uqat.ca Daniel Bordage
Canadian Wildlife Service; daniel.bordage@ec.gc.ca
Abstract. Wetlands of remote forest landscapes support numerous species of breeding waterfowl yet species-habitat associations remain little documented. From 1990 to 2005, Black Duck Joint Venture- Canadian Wildlife Service aerial survey systematically covered a 540,000-km2 area located in the vast forests of southem Quebec. This annual helicopter survey yielded a major database of spatially recorded observations of waterfowl. We used these data to investigate local habitat use and selection by waterfowl, based on a newly developed wetland classification system that we elaborated from numerical forestry maps. For 18 waterfowl species and the common loon (Gavia immer), we present detailed indicated breeding pairs (IBP) distribution across broad aquatic, wetland, and shoreline habitat types, and estimated selection ratios within the groups of similar habitat types. Connected ponds ( <8 ha) were highly used and highly selected by ali dabbling duck species and by ring-necked duck (Aythya collaris), hooded merganser (Lophodytes cucullatus), common (Bucephala clangula), and Barrow's goldeneyes (B. islandica). Isolated ponds were primarily selected by many species, but their use remained negligible. Dabbling duck species and Canada goose (Branta canadensis) made extensive use of streams (25-41% of ali IBP). Half of the species preferentially used shorelines of waterbodies <8 ha, whereas all three piscivorous species preferred shorelines of larger waterbodies. Our results raise the question of the ecological relevance of systematically prioritizing large connected wetlands in protection guidelines over large jurisdictions such as in Quebec.
Résumé. Bien que les milieux humides des paysages forestiers supportent de nombreuses espèces de sauvagine en période de nidification, les associations espèces-habitat y demeurent peu documentées. De 1990 à 2005, l'inventaire aérien du Plan conjoint sur le Canard noir -Service canadien de la faune a systématiquement échantillonné un territoire de 540 000 km2 situé dans les vastes forêts du Québec méridional. Cet inventaire, effectué annuellement par hélicoptère, a généré une importante base de données d'observations localisées d'oiseaux aquatiques. Nous avons utilisé ces données pour étudier l'utilisation et la sélection par les oiseaux aquatiques parmi les classes d'habitat local d'un système de classification des milieux humides que nous avons élaboré à partir des cartes forestières numériques. Pour 18 espèces
d'oiseaux aquatiques et le plongeon huard (Gavia immer), nous présentons la distribution des équivalents-couples nicheurs (ÉCN) à travers les classes d'habitat aquatique, de milieux humides et de rivage, et rapportons les ratios de sélection à l'intérieur des groupes d'habitats similaires. Les étangs reliés ont été hautement utilisés et sélectionnés par toutes les espèces de canards barboteurs et par le fuligule à collier (Aythya collaris), le harle couronné (Lophodytes cucullatus), le garrot à œil d'or (Bucephala clangula) et le garrot d'Islande (B. islandica). Les étangs isolés ont été sélectionnés par de nombreuses espèces, mais leur utilisation est demeurée négligeable. Les espèces de canards barboteurs et la bernache du Canada (Branta canadensis) ont fait une utilisation importante des ruisseaux (25-41% des ÉCN). La moitié des espèces a utilisé préférentiellement les rivages des étendues d'eau de superficie <8 ha, tandis les espèces piscivores ont toutes trois préféré les rivages d'étendues d'eau >8 ha. Nos résultats soulèvent la question de la pertinence de prioriser systématiquement les milieux humides de grande superficie qui sont reliés au réseau hydrographique dans les démarches de protection des milieux humides sur de vastes territoires tel que le Québec.
Key words. Aerial survey, boreal, breeding, forest, habitat selection, habitat use, Quebec, waterfowl, wetlands.
INTRODUCTION
Waterfowl species breed in wide variety of enviromnents, ranging from prairie potholes to hilly forest regions, from lush hardwood to open tundra landscapes (Bellrose 1976). However, habitat requirements of populations distributed at low density in remote areas are often less documented. Such is the case of waterfowl populations that breed in forested landscapes of Quebec, an area over 500,000 km2 with an estimated average of over 350,000 breeding pairs (Bordage et al. 2003). The vast forest landscapes of Quebec nevertheless harbour the core of the breeding ranges of the American black duck (Anas rubripes) (Longcore et al. 2000) as weil as the eastern population of the Barrow's goldeneye
(Bucephala islandica) in North America (Robert et al. 2000), a population currently
designated as special concem (COSEWIC 2007). Sorne 18 other species ofwaterfowl and the common loon ( Gavia immer) also breed in Que bec forests .
Relating breeding pairs distribution across the classes of a wetland habitat classification system is an effective way of analyzing the importance of broad habitat types for waterfowl species. For example, in the states of Maine and New York, Ringelman et al. (1982) and Dwyer and Baldassarre (1994) linked American black duck and mallard (Anas
platyrhynchos) to Cowardin et al's (1979) habitat classification system. In the boreal Claybelt of Ontario, Rempel et al. (1997) have analyzed the distribution of 14 waterfowl species according to a habitat classification system applicable from aerial photography. In portions of the boreal forest of Quebec, Bordage (1987, 1988) exarnined pair distribution of American black duck and common merganser (Mergus merganser) across open water classes elaborated from 1:50,000 topographie maps. Also, both McNicol et al. (1987) in northem Ontario, and Nummi and Poysa (1995) in Finland, compared, for the most abundant species present, the densities of pairs per km of shoreline among severallake-size classes.
Along with site attribute studies and controlled experiments, assessments of habitat use and habitat selection in natural areas provide basic ways of enhancing knowledge about species ecology (Garshelis 2000). In wildlife studies, habitat use is commonly referred to as the proportion of a population that uses a certain habitat component, whereas habitat selection is defined as the comparison of use vs. availability of that component (Manly et al. 2002). Habitat use and habitat selection are in fact two different parameters that may help in
assessing the importance of a specifie habitat type for a given species. Maximum use by a species directly relates to the greatest number of individuals, whereas maximum selection refers to the habitat components occupied at the highest density.
Including multiple related species in a habitat use and selection study may provide additional grounds for results interpretation. When compared to the Prairie Pothole region, the boreal forest is a rather stable environment where interspecific competition may play a determinant role in community organization (Nudds 1983). Simultaneously studying habitat requirements of a group of species such as waterfowl may help understanding the causes and mechanisms related to fluctuations in population size. Examples of this can be found in the hypotheses of a causal relationship between population abundance of mallard vs. American black duck (Ankney et al. 1987; Conroy et al. 1989; Merendino et al. 1993), as weil as of common goldeneye (Bucephala clangula) vs. Barrow's goldeneye (Savard and Robert 2007).
In this paper, we relate our use of two existing data sets to explore habitat associations between 18 species of breeding waterfowl and the common loon, and forest wetlands of Que bec. More specifically, we investigated 16 years of Black Duck Joint V enture (BDN) -Canadian Wildlife Service (CWS) aerial survey data in relation to an original wetlands classification based on Quebec numerical forestry maps. Our aim was to quantify habitat use and selection by waterfowl species across broad and ecologically meaningful habitat types using a classification system that is readily available for a vast region.
STUDY AREA
Our study area was the area covered by the BDN - CWS aerial survey in Quebec,
corresponding to the forest-dominated landscapes of Quebec (Figure 1). This 540,000-km2 area was located south of 51 °l5 'N, but excluded the St. Lawrence and Lake St. Jean lowlands and the part of the Appalachians located south of 47° N. It extended northward from northem temperate deciduous forest to the boreal coniferous forest zone. According to the National Ecological Framework for Canada (Marshall and Schut 1999), the study area is mainly distributed among 6 ecoregions : Southem Laurentians (31 %), Central Laurentians (27%), Abitibi Plains (13%), Rupert River Plateau (11 %), Mecatina Plateau (10%), and
Appalachians (8%). The hydrographical network of this area is generally highly developed and includes numerous lakes, ponds, rivers and streams. Open water and wetlands with tree co ver <25% altogether encompass nearly 18% of the total area (Ménard et al. 2006). Bea ver (Castor canadensis) was ubiquitous within the study area, although its abundance was higher in the western part of the region (Lafond and Pilon 2004).
METHODS Waterfowl surveys
We used data from the first 16 years (1990-2005) of the BDN - CWS waterfowl aerial
survey in Quebec. The survey design has been modified over the years. From 1990 to 1992, 82 square plots (10 x 10 km), systematically distributed along 100-km intervals, were surveyed. The number of plots was reduced to 43 in 1993-1994, and to 35 in 1995. From 1996 to 2005, plot size was reduced to 5 x 5 km with 50-km spacing between plots, and the number of plots was increased to 156; half of the plots being surveyed once annually in a rotating scheme (Bordage et al. 2003).
Surveys were done by experienced observers in a helicopter (Bell 206L with hubble side-windows) that flew over every waterbody, watercourse and wetland within the plot. Depending on habitat and topography, flight altitude was 15-50 rn above ground level and speed varied from 60-100 kmlh. Although the survey was primarily designed to produce population size estimates of American black duck, all waterfowl species as weil as many other bird species (including common loon) were also noted. Observations were recorded during the survey on topographie maps (scale 1:50,000) with a 100-m precision, thus allowing possibility for high-resolution spatial analyses. Surveys we timed to occur at the end of egg-laying and the beginning of incubation period of the American black duck, an early nesting species, on average from 6-30 May. In all analyses we used breeding pair observations, which were determined following indicated breeding pair (IDP) criteria of the
Wetland classification
The forest landscapes in Quebec are a vast and remote area, and no extensive wetland classification and inventory was available for this region. Thus we extracted wetland data from the Quebec Ministry of Natural Resources and Wildlife numerical 1 :20,000 forestry maps and we elaborated a habitat classification system adapted to waterfowl. Minimum mapping area for open water and wetland areal features was set to 1 ha (Létoumeau 1999), although numerous smaller islands and ponds were mapped. Streams, defined as watercourses < 6-m wide, were mapped as linear features . Maps were available for 73 (out of 82) 10 x 10-km waterfowl survey plots and 143 (out of 156) 5 x 5-km plots, that were located in the portion of Quebec primarily managed for timber harvest.
We retained the following areal habitat classes directly from the maps: open water areas, open wetlands (vegetated wetlands with less than 25% tree cover, including for example meadow marshes, emergent marshes, riparian fens, and bogs), shrub swamps (mostly A/nus rugosa stands), and flooded swamps (dominated by dead standing trees). Remaining areas
were mostly forest land and forest swamps. Within open water areas, we further defined lakes as all waterbodies >8 ha and ponds as waterbodies <8 ha, based on one of the criteria used by Cowardin et al. (1979) to separate lacustrine from palustrine waters. We distinguished lake shores from offshore zones with a boundary set 100 rn in-water from shorelines. In the absence of available bathymetrie data, this zone criterion (as opposed to "basin" criteria used by Stewart and Kantrud [1971]) yields classes that are akin to the lacustrine littoral and limnetic subclasses of Cowardin et al.' s (1979) classification. W e distinguished connected from isolated ponds based on the presence of a surface hydrologicallink (stream or river). This distinction may be useful as the two habitats may be ecologically different and addressed differently by sorne legislations (Leibowitz 2003). Rivers were identified as such on the maps and were directly transferred into our classification. Shoreline vegetation may also be a significant predictor ofwaterfowl use (Nurnmi et al. 1994). Based on the polygons adjacent to water on the maps, we thus classified shorelines of open water and streams among the 5 following types: open wetland, shrub swamp, flooded swamp, small island ( <20 ha) and forest (mainly upland forest, forest swamps, and islands >20 ha). We grouped the 3
components of the forest shoreline type because our preliminary analyses showed similar selection by waterfowl species.
Pair-habitat association
W e superimposed IBP locations and habitat data within a geographie information system and associated IBP to habitat types following a simple algorithm. According to the precision of location mapping, we searched within a 1 00-m radius for probable aquatic or wetland habitat types. In a first step, we associated each IBP to the closest open water habitat type. When no such habitat was present, we altematively associated IBP to the closest stream habitat, and, when no stream was present, to the closest wetland habitat type (saturated open wetland, shrub swamp, or flooded swamp ). All IBP previously associated to an open water habitat type or a stream were also associated to the closest shoreline type.
Statistical analyses
W e evaluated habitat use and selection by successively analyzing IBP distributions into the classes of categorical habitat variables. In our study, habitat use was simply defined as the percent of observed IBP associated to a given habitat type over the total number of IBP detected in all habitats (Manly et al. 2002). For each observed value of habitat use, we computed a confidence interval with the large-sample · 95% confidence interval formula (Manly et al. 2002:53).
We derived expected percentages of habitat use based on relative availability distribution of habitat types following Neu et al. (1974). However, habitat availability assessment had to account for continental breeding range boundaries encountered by many species within the study area. Because we aimed at studying selection of site-scale habitat features within species geographie range, we considered as available only the survey plots where 2: 1 IBP of a given species has been observed over the years. We cumulated areas of plots available to each species over the total number of years that the plot was surveyed. We then expressed habitat selection with a simple estimator corresponding to the ratio of observed : expected use for a given habitat type (Manly et al. 2002). This selection ratio reflects the number of times a habitat is used comparatively to its availability. Unlike chi-square values, selection ratios vary on a fixed-scale and are largely independent of sample size.
W e analyzed habitat use among open water habitat types, open wetlands, and streams, and habitat use and selection within open water habitat types. We analyzed shoreline type use and selection within open water habitat types and streams. W e also estimated and tested for preferences between waterbodies < vs. > 8 ha by comparing observed IBP numbers with those expected according to shoreline length. Because difference in shoreline type availability al one could lead to an apparent preference for one or the other class of waterbody size- an effect known as Simpson's paradox (Agresti 1996) -, we controlled for shoreline type availability by computing Mantel-Haenszel (MH) odds ratios. Thus, we estimated the strength of the preference (with 95% confidence intervals) for either class ofwaterbody size after controlling for the effect of shoreline type (Agresti 1996) and removing offshore zones. We excluded all IBP mapped further than 100 m from any open water, open wetland or stream (2.6% of all IBP) as they were probably moving between habitats when detected.
In arder to synthesize community structure and to identify relationships between species and habitat types, we performed a correspondence analysis (CA) on the two-way contingency table of IBP frequencies computed for species by all combinations of aquatic vs. shoreline habitat types and wetland habitat types (Legendre and Legendre 1998). This multivariate analysis differs from our species by species analyses in that it considers all species simultaneously and that it uses broken combinations of all habitat types. We performed geographie procedures with ArcGIS Version 9.1 (2005), MH odds ratio tests with SAS Version 9.1 (2002), and correspondence analysis with CANOCO Version 4.5 (2002).
RESULTS
From 1990 to 2005, we used 31,508 IBP locations from 18 waterfow1 species (17 after having poo led grea ter and lesser scaups [ Aythya mari/a and A. affinis]) and the common loon in habitat association analyses. All species had most of their IBP associated to open water areas, but the 6 species of dabbling ducks and the Canada goose (Branta canadensis) all used streams in higher proportions than the 10 species of diving ducks and the common loon, with 24.6-41.4% ofiBP located in streams (Table 1 ). In the latter group, the lowest use of open water areas was observed in hooded merganser (Lophodytes cucullatus, 77.8%), followed by ring-necked duck (Aythya co/laris, 87.0%).
Among open water areas, lake offshore zones were generally used less than expected based on areal coverage with estimated selection ratios~ 0.2 for 15 of the 18 species (Table 1). Connected ponds received the highest use from ali dabbling duck species, Canada goose, ring-necked duck, hooded merganser, and common and Barrow's goldeneyes, with lake shore zones used in second place. The reverse was true for all other species. However, ail duck species and Canada goose tended ta prefer ponds a ver lake shore zones, as shawn by estimated selection ratios (S) all2: 1.5. Common loon was the only species ta select lake shore zones frrst (S
= 1.5). Isolated ponds were
primarily selected by many species, but the maximum use of these habitats only reached 3.8% ffiP, in Canada goose. Ri vers were preferred over lake shore zones by most dabbling species, but ta a lesser extent than connected ponds.Among open water shoreline types, most species used forest shorelines the most frequently, except for Canada goose, blue-winged teal (Anas discors) and green-winged teal (A. crecca), which made comparable use of open wetland shorelines, and scaups, which mainly used open wetland shorelines (Table 2). Open wetland shorelines were used more than expected by the highest number of species (13/18). Flooded swamp shorelines were used in higher proportion than available by ali species of dabbling ducks, ring-necked duck, and hooded merganser, with selection ratios consistently > 2.2 and significant at the 5% confidence level. Small island shorelines were used more than expected by only 3 species: common loon, Barrow's goldeneye, and black scoter (Melanitta nigra ).
In stream shorelines, sorne diving species were observed tao infrequently ta be included in our analyses (Table 3). Among the more abundant species, highest use was shared between forest (wood duck [Aix sponsa], mallard, common goldeneye, and common and hooded mergansers) and open wetland shorelines (Canada goose, ring-necked duck, and American black duck). Duck species frequenting streams generally prioritized flooded swamp over shrub swamp, and shrub swamp over open wetland shorelines.
Controlling for shoreline type availability in waterbodies, we found that 9 species had more chance of selecting a given shoreline type when located in waterbodies <8 ha (Table 4). Common loon, red-breasted merganser (Mergus serrator), and common merganser, which are the 3 main fish-eating species, preferred shorelines oflarger waterbodies.
The two frrst axes of the CA respective! y explained 56% and 20% of the percentage of variance in species-habitat relations, totalling 76% (Figure 2). Axis I, i.e. the most discrirninating gradient, ordered the habitats in a sequence of increasing water openness, and axis II expressed increasing water movement.
DISCUSSION
Wetlands importance
Black Duck Joint Venture - CWS aerial survey provided a large dataset, enabling the exploration of waterfowl-habitat associations. With spatially recorded observations, made possible by low pair density and the use of helicopter, we back-located ffiP in their local habitat types, obtaining information that may be partially validated with or that may add to prior knowledge of wetlands importance to each species in comparable environments (Table 5).
From the waterfowl community standpoint, interpretation of our ordination bi-plot highlighted water openness as being the most significant gradient and water movement as the best complementary gradient to explain species variation in pair habitat use. These habitat gradients are sirnilar to those found in the study of Rempel et al. (1997), which is also based on a wetland habitat classification derived from remote-sensed data.
There have been few attempts to relate breeding waterfowl density to waterbody size in forested areas. From the data presented in Bordage (1987, 1988), it can be drawn that both American black duck and common merganser pair densities, calculated over an areal basis, were higher in lakes <10 ha and decreased with increasing lake size. According to our results, this relationship had to be expected since zones located > 1 00-m offshore proved to be largely unused by all species. Shoreline length, which is also routinely used to report waterfowl densities (e.g. Toft et al. 1982, Gauthier and Smith 1987, Elmberg et al. 2003), is thus susceptible to reduce variability of density measures. This has been tested in Finland by Nummi and Poysa (1995), who compared pair densities per km of shoreline among severa! lake size classes. They found in all abundant species (mallard, European green-winged teal
similar analysis from northem Ontario lakes, McNicol et al. (1987) observed that this relationship held for insectivores (hooded merganser and common goldeneye) and generalist feeders (mallard, American black duck, and ring-necked duck) but was reversed in species that are mostly piscivorous ( common merganser and common loon). Our results add to the body of evidence (see also DesGranges and Darveau 1985) that larger waterbodies are preferred by piscivores (Table 4), and also highlight the importance of ponds for most other species: many species not only showed a clear preference for waterbodies <vs. > 8 ha both on a water area and a shoreline length basis, but also used these wetlands in higher absolute numbers (Table 1 ). Smaller size reduces wetland exposure to wind and wave action (Cowardin et al. 1979). Influence ofbeaver, presence ofmacrophytes (Longcore et al. 2006), and absence of fish (Mallory et al. 1994, Marklund et al. 2002), which are all more likely to occur in small wetlands, are other positive factors that may also contribute to explain their importance.
Studies of habitat use and selection by breeding waterfowl often relate pair distribution to pond or lake descriptors, leaving stream habitats unaddressed ( e.g. Nummi et al. 1994, Paquette and Ankney 1996, Gabor et al. 2002). Whereas this approach may be appropriate for many regions and species, ignoring small streams for evaluating habitat importance would not come without a certain cost in territories that are comparable on this point to forest landscapes of Quebec. We found that streams mapped as linear features were used consistently by ali dabbling duck species (25-41% of IBP observations), Canada goose (33%), and hooded merganser (21 %), clearly demonstrating the significant importance of small streams in our study area (Table 1 ). Thus, neglecting the contribution of streams to overall habitat may have incidence on applications such as predictive distribution models, as well as on general understanding of waterfowl breeding ecology. Once streams are taken into account, discriminating upon adjacent habitat type may help in refining species-streams relationships (Table 3). In our case, maps included numerous high-gradient and intermittent streams, which explains why all stream types running through wetland patches were highly selected on a segment length availability basis.
In other forested regions of north-eastem North America, bea ver ponds have been recognized as important waterfowl breeding habitats, being used by all dabbling ducks, hooded
merganser and ring-necked duck (Renouf 1972, Brown and Parsons 1979, Rempel et al. 1997, Longcore et al. 2006) . This would perfectly fit our results if we rely on flooded swamps as indicators of beaver ponds. Indeed, the same species assemblage selected for flooded swamps as open water shorelines (Table 2). Moreover, even though flooded swamps only bordered a fraction of all beaver ponds present in our survey plots, flooded swamp shorelines supported considerable proportions of total IBP of American widgeon (Anas
americana, 22%), wood duck (14%), mallard (10%), and blue-winged teal (10%). This
confirms that bea ver management practices and trapping effort ( often related to fur value) have the potential to impact waterfowl populations that breed in the forest wetlands of Quebec.
Wetland classification
The use of numerical forestry maps provided a straightforward scheme to analyze patterns of habitat use and selection of waterfowl over a large forest territory. Even though wetland coverage may now be derived through satellite imagery, the detection of linear streams, which are important waterfowl habitats in Quebec forests, still necessitates the use of photointerpretation (Ozesrni and Bauer 2002). Other important habitats such as narrow fringes of emergent plants on shorelines, emergent rocks, or small bog ponds may have been overlooked due to minimum estimated mapping area (1 ha). However, on the maps of our survey plots, islands smaller than 0.1 ha accounted for 59% of the 2,251 small islands, whereas ponds smaller than 0.4 ha accounted for 71% of the 321 isolated ponds and for 43% of the 5,781 connected ponds. Probably more important are wetland dynamics induced by beaver activity, which produced changes between the time of the photography and the waterfowl surveys. At frequencies and locations that we could not record, impoundments appeared where small streams ran through open wetlands, streams became river-wide, and waterbody shorelines were redefined. Another potential weakness in the habitat classification we used lied in the definition of the open wetland class, which did not allow dissociating shorelines ·of floating riparian fens from marshes with emergent plant cover. Although it could be considered somewhat coarse, our wetland classification relied on existing numerical data, which made it cost effective. Forestry maps are also widely used by forest stakeholders
and therefore constitute an excellent planning tool on which decision making regarding habitat management can be based.
Potential biases
Errors undoubtedly occurred in the different steps of this species/habitat analysis. Apart from wetland identification and mapping, uncertainty may stem from survey timing, breeding pairs detection and location. To survey all species within the appropriate survey window - after migrants have passed through and before mates desertion- in a single survey is a challenging task. Our results must therefore be interpreted with caution, especially those of late breeding species such as scaups, surf scoter (Melanitta perspicillata), black scoter and red-breasted
merganser (Bordage et al. 2003) because these species might still not be established in their nesting habitat yet. Regarding differentiai detectability rates among habitats, it should be reminded that breeding pair surveys occur before leafing and that birds do not tend to hide on aircraft approach, leading to relatively high breeding pair detectability in surveys run from a helicopter, compared to other survey methods (Ross 1985). Also, with the IBP criteria, females concealed or on a nest could be inferred by the presence of a lone male. Finally, one may logically assume that detection probability was lower in small and structurally complex wetlands and for small and secretive species when interpreting the results. Regarding IBP location, the more important bias may have occurred in the pair/habitat association algorithm, due to mapping precision (±100 rn). However, we developed the algorithm to reduce bias as much as possible, thus ordering possible positive biases in a sequence that is conservative according to waterfowl (open water areas > streams > non-forested wetland areas > forested areas). Despite this sequence, we do not consider that our results on habitat selection are severely affected by the mapping imprecision or by our pair/habitat association algorithm. For example, our data regarding use rates of streams relative to open water areas is amongst the highest reported in the scientific literature. Finally, because identifying greater and lesser scaups to the species taxonomicallevel is difficult from aerial surveys, we had to group the two species under scaups.
MANAGEMENT IMPLICATIONS
One could see in habitat use a basis for broad-scale management decisions and in habitat selection a basis for population or habitat restoration. Most selected habitats may constitute judicious habitats where to concentrate local conservation or restoration efforts, whereas
most used habitats deserve consideration when planning at a broad regional scale.
Recently, the Quebec govemment adopted a provincial guideline conceming evaluation mechanisms used for development projects in wetlands. This guideline entails a protection level that is higher for peatlands and large-sized wetlands (> 10 ha) that are hydrologically connected (MDDEPQ 2007). This leaves wetlands that are small-sized (<10 ha) and isolated with a lower protection level. Our results show that small wetlands containing open water are used preferentially by severa! waterfowl species. Also, far from diminishing their ecological value, the absence of a surface hydrologicallink may even be an additional factor responsible for their high selection by waterfowl. These two points lead us to question the ecological relevance of size and connectivity criteria as a basis for wetlands protection guidelines. Furthermore, small isolated water areas only account for < 0.2% of the total open water area of the forest landscapes of Quebec but they are used by 1.4% of total waterfowl, and elementary precaution, such as in a conservation approach based on the coarse-filter principle, rather pleads for their preservation (Lemelin and Darveau 2006).
ACKNOWLEDGMENTS
Our project received financial support from the Black Duck Joint Venture, the Canadian Wildlife Service (CWS), Ducks Unlimited Canada, the Fondation de l'Université du Québec en Abitibi-Témiscamingue, and the Canadian Boreal Initiative. The Québec Ministry of Natural Resources and Wildlife provided forestry maps. L. V. Lemelin benefited from a Master's scholarship granted by the Natural Sciences and Engineering Research Council of Canada. We thank the observers and pilots, who logged many hours in helicopters doing the surveys, and F. Fournier (CWS) andE. Reed (CWS) for reviewing a previous version of this manuscript.
LITERA TURE CITED
Agresti, A. 1996. An Introduction to Categorical Data Analysis. John Wiley & Sons, New York, New York, USA.
Ankney, C. D., D. G. Dennis, and R. C. Bailey. 1987. Increasing Mallards, Decreasing Arnerican Black Ducks: Coïncidence or Cause and Effect? The Journal ofWildlife Management 51 :523-529.
Bellrose, F. C. 1976. Ducks, Geese & Swans of North America. Second edition. Wildlife Management Institute, Stackpole Books, Harrisburg, Pennsylvania, USA.
Bordage, D. 1987. Suivi des couples nicheurs de Canard noir en forêt boréale- 1985. Service canadien de la faune, région du Québec. Série de rapports techniques No. 18. Sainte-Foy, Québec, Canada. [In French.]
Bordage, D. 1988. Suivi des couples nicheurs de Canard noir en forêt boréale- 1986. Service canadien de la faune, région du Québec. Série de rapports techniques No. 36. Sainte-Foy, Québec, Canada. [In French.]
Bordage, D., C. Lepage, and S. Orichefsky. 2003. 2003 Black Duck Joint Venture Helicopter Survey - Québec. Canadian Wildlife Service, Québec Region, Environment Canada, Sainte-Foy, Québec, Canada.
Brown, M. K., and G. R. Parsons. 1979. Waterfowl Production on Beaver Flowages in a Part ofNorthem New York. New YorkFish and Game Journal26:142-153.
Conroy, M . J., G. G. Bames, R. W. Bethke, and T.D. Nudds. 1989. Increasing Mallards, Decreasing Arnerican Black Ducks- No Evidence for Cause and Effect: A Comment. The Journal ofWildlife Management 53:1065-1071.
COSEWIC. 2007. Canadian Species at Risk. Committee on the Status ofEndangered Wildlife in Canada. J anuary 2007.
Cowardin, L M., V. Carter, F . C. Go let, and E. T. LaRoe. 1979. Classification of Wetlands and Deepwater Habitats of the United States. U.S. Department of the Interior, Fish and Wildlife Service, Washington, D.C., USA.
DesGranges, J. L, and M. Darveau. 1985. Effect oflake acidity and morphometry on the distribution of aquatic birds in southem Quebec. Holarctic Ecology 8:181-190.
Dwyer, C. P., and G . A. Baldassarre. 1994. Habitat Use by Sympatric Female Mallards and Arnerican Black Ducks Breeding in a Forested Environment. Canadian Journal of Zoology 72:1538-1542.
Elmberg, J., P. Nurnrni, H. Poysii, and K. Sjoberg. 2003. Breeding Success of Sympatric Dabbling Ducks in Relation to Population Density and Food Resources. Oikos 100:333-341.
Environmental Systems Research Institute. 2005. Version 9 .1. Environmental Systems Research Institute, Redlands, California, USA.
Gabor, T. S., H. R. Murkin, and J. W. Ingram. 2002. Waterfowl Use ofManaged and Unmanaged Beaver Ponds in South-Central Ontario. Northeast Wildlife 57:45-57.
Garshelis, D. L. 2000. Delusions in Habitat Evaluation: Measuring Use, Selection, and Importance. Pages 111-164 in L. Boitani and T. K. Fuller, editors. Research Techniques in Animal Ecology: Controversies and Consequences. Columbia University Press, New York, USA.
Gauthier, G., and J. N. M. Smith. 1987. Territorial Behaviour, Nest-Site Availability, and Breeding Density in Buffleheads. The Journal of Animal Ecology 56:171-184.
Lafond, R., and C. Pilon. 2004. Abondance du castor (Castor canadensis) au Québec- Bilan d'un programme d'inventaire aérien. Le Naturaliste canadien 128:43-51. [In French.] Legendre, P., and L. Legendre. 1998. Numerical Ecology. Second English edition. Elsevier,
Amsterdam, The Netherlands.
Leibowitz, S. G. 2003. Isolated Wetlands and their Functions: An Ecological Perspective. Wetlands 23 :517-531.
Lemelin, L. V ., and M. Darveau. 2006. Coarse and fine filters, gap analysis, and systematic conservation planning. The Forestry Chronicle 82:802-805 .
Létoumeau, J. P. 1999. Norme de cartographie écoforestière- Confection et mise à jour-Troisième programme de la connaissance de la ressource forestière. Direction des inventaires forestiers, Forêt Québec, Ministère des Ressources naturelles. [In French.] Longcore, J. R. , D. G. McAuley, G. R. Hepp, and J. M. Rhymer. 2000. American Black Duck
(Anas rubripes). Account 481 in A. Poole and F. Gill, editors. The Birds of North America. The Birds of North America, Philadelphia, Pennsylvania, USA.
Longcore, J. R., D. G. McAuley, G. W. Pendleton, C. Reid Bennatti, T. M. Mingo, and K. L. Stromborg. 2006. Macroinvertebrate abundance, water chemistry, and wetland
characteristics affect use ofwetlands by avian species in Maine. Hydrobiologia 567:143-167.
Mallory, M. L., P . J. Blancher, P . J. Weatherhead, and D. K. McNichol. 1994. Presence or Absence ofFish as a Cue to Macroinvertebrate Abundance in Boreal Wetlands. Hydrobiologia 279/280:345-351 .
Manly, B. F. J., L. L. McDonald, D. L. Thomas, T. L. McDonald, and W. P. Erickson. 2002. Resource Selection by Animais: Statistical Design and Analysis for Field Studies. Second edition. Kluwer Academie Publishers, USA.
Marklund, 0., H. Sandsten, L. A. Hansson, and 1. Blindow. 2002. Effects ofwaterfowl and fish on submergent vegetation and macroinvertebrates. Freshwater Biology 47:2049-2059.
Marshall, I. B., and P. H. Schut. 1999. A National Ecological Framework for Canada-Overview. Ecosystems Science Directorate, Environment Canada, and Research Branch, Agriculture and Agri -Food Canada. <http://sis.agr.gc.ca/ cansis/nsdb/ ecostrat/intro .html>. Accessed 25 Jun 2007.
McNicol, D. K., B. E. Bendell, and R. K. Ross. 1987. Studies of the effects of acidification on aquatic wildlife in Canada: waterfowl and trophic relationships in smalllakes in northem Ontario. Canadian Wildlife Service. Occasional Paper No. 62.
MDDEPQ. 2007. Traitement des demandes d'autorisation des projets dans les milieux humides -Une démarche équitable et transparente. Ministère du Développement durable, de l'Environnement et des Parcs du Québec (MDDEPQ).
<http://www.mddep.gouv.qc.ca>. Accessed 29 Jun 2007. [In French.]
Ménard, S., M. Darveau, and L. Imbeau.2006. Forest inventory maps: A useful tool for a wetland habitat classification and regionalization in Quebec's forests . Pages 105-110 in Proceedings of the 2006 Eastern CANUSA Conference. Natural Resources Canada-Canadian Forest Service, Ministère des Ressources naturelles et de la Faune du Québec-Direction de la recherche forestière, and Université Laval- Faculté de foresterie et de géomatique, 19-21 October 2006, Québec, Québec, Canada. [In French.]
Merendino, M. T., C. D. Ankney, and D. G. Dennis. 1993. Increasing Mallards, Decreasing American Black Ducks: More Evidence for Cause and Effect. The Journal ofWildlife Management 57:199-208 .
Neu, C. W., C. R. Byers, and J. M. Peek. 1974. A Technique for Analysis ofUtilization-Availability Data. The Journal ofWildlife Management 38:541-545.
Nudds, T.D . 1983. Niche Dynamics and Organization ofWaterfowl Guilds in Variable Environments. Ecology 64:319-330.
Nummi, P., and H. Pèiysa. 1995. Breeding Success ofDucks in Relation to Different Habitat Factors. Ibis 137:145-150.
Nummi, P., H. Pèiysa, J. Elmberg, and K. Sjèiberg. 1994. Habitat Distribution of the Mallard in Relation to Vegetation Structure, Food, and Population Density. Hydrobiologia 279/280:247-252.
Ozesmi, S. L., and M. E. Bauer. 2002. Satellite remote sensing ofwetlands. Wetlands Ecology and Management 10:381-402.
Paquette, G. A., and C. D. Ankney. 1996. Wetland Selection by American Green-winged Teal Breeding in British Columbia. The Condor 98:27-33 .
Rempel, R., K. F. Abraham, T. R. Gadawski, T. S. Gabor, and R. K. Ross. 1997. A Simple Wetland Habitat Classification for Boreal Forest Waterfowl. The Journal ofWildlife Management 61:746-757.
Renouf, R. N. 1972. Waterfowl Utilization ofBeaver Ponds in New Brunswick. The Journal ofWildlife Management 36:740-744.
Ringelman, J. K., J. R. Longcore, and R. B. Owen, Jr. 1982. Breeding habitat selection and home range ofradio-marked black ducks (Anas rubripes) in Maine. Canadian Journal of Zoology 60:241-248.
Robert, M., D. Bordage, J. P. L. Savard, G. Fitzgerald, and F . Morneau. 2000. The Breeding Range of the Barrow's Goldeneye in Eastern North America. The Wilson Bulletin 112:1-7.
Ross, R. K. 1985. Helicopter vs. ground surveys ofwaterfowl in the boreal forest. Wildlife Society Bulletin 13:153-157.
Savard, J. P. L., and M. Robert. 2007. Use ofNest Boxes by Goldeneyes in Eastern North America. The Wilson Journal of Ornithology 119:28-34.
Stewart, R. E ., and H. A. Kantrud. 1971 . Classification of natural ponds and lakes in the glaciated prairie region. Bureau of Sport Fisheries and Wildlife, U.S. Fish and Wildlife Service, Washington, D .C . and Northern Prairie Wildlife Research Center, Jamestown, North Dakota. Resource Publication 92. Washington, D .C., USA.
ter Braak, C . J.F., and P. Smilauer. 2002. Canoco for Windows . Version 4.5. Biometris-Plant Research International. Wageningen, The Netherlands.
Toft, C. A., D . L. Trauger, and H . W . Murdy. 1982. Tests for Species Interactions: Breeding Phenology and Habitat Use in Subarctic Ducks. The American Naturalist 120:586-613.
respectively italicized (low~!"Rreference) or highljghted in bold (higher preference) whether < or> 1.0.
Habitat type Ca Go• WoDu AmWi BwTe GwTe ABDu Mali RnDu Seau CoGo Ba Go Buff SuSe BISe CoMe HoMe Rb Me CoLo Open water
Lake - offshore zone Obs xb 1.7
a 0.7
Exp 41.1
s
0.0Lake - shore zone Obs x 30.1 a 2.6 Exp 43.9
s
0.7 Pond - connected Obs x 54.9 a 2.8 Exp 9.3s
5.9 Pond - isolated Obs x 3.8 a 1.1 Exp 0.2s
19.2 River Obs Exps
x a 9.5 1.7 5.5 1.7Total open water
Obs x 62.6 Stream Obs Open wetland a 2.2 IBP 1,209 x a IBP 32.9 2.1 635 0.0 0.0 41.4 0.0 25.2 6.7 44.9 0.6 67.5 7.2 9.0 7.5 1.2 1.7 0.2 5.4 6.1 3.7 4.4 1.4 67.4 5.9 163 31.8 5.9 77 13.4 8.2 52.8 0.3 32.8 11.2 35.5 0.9 43.3 11.9 4.9 8.8 0.0 0.0 0.3 0.0 10.4 7.3 6.6 1.6 64.4 9.2 67 33.7 9.1 35 0.0 0.0 38.0 0.0 21.1 13.0 43.6 0.5 52.6 15.9 10.4 5.0 2.6 5.1 0.2 11.8 23 .7 13.5 7.8 3.0 54.3 11.7 38 41.4 11.5 29 2.9 1.0 39.1 0.1 23.3 2.7 45.2 0.5 59.2 3.1 9.6 6.1 1.6 0.8 0.2 8.6 13.0 2.1 5.9 2.2 2.0 0.3 39.2 0.1 33 .7 1.1 45.3 0.7 53.6 1.2 9.7 5.5 1.7 0.3 0.2 9.0 9.0 0.7 5.7 1.6 59.9 74.1 2.4 0.9 977 6,883 37.7 24.6 2.4 0.9 615 2,283 2.9 1.3 35.3 0.1 30.7 3.6 48.5 0.6 50.2 3.9 9.7 5.2 1.0 0.8 0.2 4.4 15.3 2.8 6.3 2.4 1.0 0.3 39.2 0.0 27.7 1.3 45.2 0.6 65.5 1.4 9.6 6.8 1.7 0.4 0.2 9.0 4.1 0.6 5.7 0.7 57.1 87.0 2.9 0.9 629 4,456 39.9 2.9 439 11.7 0.9 601 4.2 2.4 33.3 0.1 47.1 6.0 47.6 1.0 40.3 5.9 9.3 4.3 3.4 2.2 0.3 10.8 4.9 2.6 9.5 0.5 2.8 0.5 39.2 0.1 35.5 1.5 45.3 0.8 54.5 1.6 9.7 5.6 0.9 0.3 0.2 4.6 6.4 0.8 5.7 1.1 93.9 91.7 2.8 0.8 263 3,759 5.4 2.6 15 7.8 0.8 321 0.9 1.8 31.0 0.0 32.1 8.9 50.9 0.6 64.2 9.1 15.3 4.2 0.0 0.0 O.l 0.0 2.8 3.2 2.7 l.l 93.0 4.7 106 5.3 4.1 6 6.2 2.9 38.5 0.2 43.2 6.0 46.6 0.9 41.3 6.0 8.5 4.9 2.7 2.0 0.2 113 6.6 3.0 62 1.1 91.2 3.3 259 7.0 3.0 20 6.1 2.4 39.8 0.2 55.7 5.0 45.7 1.2 33.2 4.8 10.0 33 1.1 1.0 0.3 4.0 4.0 2.0 4.2 0.9 13.0 7.5 33.2 0.4 61.0 10.9 48.5 1.3 13.0 7.5 8.8 1.5 1.3 2.5 0.5 2.7 11.7 7.2 9.0 1.3 5.1 0.7 39.3 0.1 58.3 1.7 45.3 1.3 23 .9 1.4 9.6 2.5 0.4 0.2 0.2 2.2 12.3 l.l 5.7 2.2 0.6 0.5 39.4 0.0 26.5 2.7 43.8 0.6 65.5 2.9 10.2 6.4 2.6 1.0 0.2 13.1 4.8 1.3 6.4 0.7 98.4 100.0 89.6 77.5 1.2 0.0 1.0 2.2 377 77 3,387 1,060 1.6 1.2 6 0.0 0.0 0 9.9 1.0 376 21.0 2.2 287 12.3 7.2 55.9 0.2 61.7 10.6 32.6 1.9 13.6 7.5 5.7 2.4 0.0 0.0 0.2 0.0 12.3 7.2 5.5 2.2 21.9 2.1 39.2 0.6 67.2 2.4 45.5 1.5 7.5 1.3 9.6 0.8 O.l 0.2 0.2 0.7 3.3 0.9 5.5 0.6 98.8 98.9 2.4 0.5 81 1,524 1.2 2.4 1 1.0 0.5 15 Obs x 4.6 0.8 1.9 4.3 2.5 1.4 3.0 1.3 0.7 0.5 1.8 1.8 0.0 0.0 0.4 1.5 0.0 0.1 a 0.9 1.1 2.6 4.7 0.8 0.2 1.0 0.3 1.0 0.2 2.4 1.5 0.0 0.0 0.2 0.7 0.0 0.2 IBP 88 2 2 3 40 129 33 65 2 21 2 5 0 0 17 21 0 2 n IBP 1,932 242 104 70 1,632 9,295 1,101 5,122 280 4,101 114 284 383 77 3,780 1,368 82 1,541
• CaGo =Canada goose, WoDu =wood duck, AmWi = American widgeon, BwTe = blue-winged teal, GwTe = green-winged teal, ABDu= American black duck, Mali= mallard, RnDu = ring-necked duck, Seau= greater scaup and lesser scaup, CoGo = common goldeneye, Ba Go = Barrow's goldeneye, Buff= bufflehead, SuSe= surf scoter, BISe= black scoter, CoMe= common merganser, HoMe= hooded merganser, RbMe = red-breasted merganser, and CaLo= common loon.