THÈSE
En vue de l’obtention du
DOCTORAT DE L’UNIVERSITÉ DE TOULOUSE
Délivré par l'Université Toulouse 3 - Paul Sabatier
Présentée et soutenue par
HOA PHAN
Le 3 décembre 2018
Suivi des surfaces rizicoles par télédétection radar
Ecole doctorale : SDU2E - Sciences de l'Univers, de l'Environnement et de l'Espace
Spécialité : Surfaces et interfaces continentales, Hydrologie Unité de recherche :
CESBIO - Centre d'Etudes Spatiales de la Biosphère Thèse dirigée par
Mehrez ZRIBI et Thuy LE TOAN Jury Agnes BEGUE Francesco MATTIA Nicolas BAGHDADI Laurent POLIDORI Jerome HELBERT Mehrez ZRIBI Thuy LE TOAN
Directrice de Recherche, CIRAD, Montpellier Senior Research Scientist CNR-Bari, Italie Directeur de Recherche, IRSTEA, Montpellier
Directeur de Recherche CNRS, Toulouse Ingénieur de Recherche, TPZ, Toulouse Directeur de Recherche CNRS, Toulouse Ingénieur de Recherche CNRS, Toulouse
Rapporteur Rapporteur Examinateur Examinateur Examinateur Directeur de thèse Co-directrice de thèse
ii
Table of Contents
Acknowledgements ... v Abstract ... vii Résumé ... ix List of Tables ... xiList of Figures ... xiii
Chapter 1 Introduction ... 1
1.1.Importance of rice... 1
1.2.State of the art in the use of remote sensing for rice monitoring ... 4
1.3.Research objectives and thesis structure ... 7
Chapitre 1 Introduction (français) ... 9
1.1.L’importance du riz ... 9
1.2.Etat de l’art de l’utilisation de la télédétection pour le suivi du riz .... 12
1.3.Objectifs de recherche et structure du manuscrit ... 16
Chapter 2 Rice in the world ... 19
2.1. Introduction ... 19
2.2. Cultural practices ... 20
2.3. Rice growth cycle ... 23
2.4. Rice productivity ... 25
2.5 Global emissions from rice fields ... 26
iii
Chapter 3 Study region and material ... 29
3.1. Study region ... 29
3.2. Ground data ... 35
3.3. SAR data ... 39
Chapter 4 Analysis and interpretation ... 51
4.1. Ground data analysis ... 52
4.2. Radar backscatter analysis & physical interpretation ... 62
4.3. Derivation of Indicators for rice mapping and rice monitoring... 79
Chapter 5 Methodology development ... 81
5.1. Calculation of classification features ... 83
5.2. Seasonal date selection ... 84
5.3. The rice/non-rice mapping algorithm ... 86
5.4. Estimation of sowing date ... 89
5.5. Detection of long/short cycle rice variety ... 90
5.6. Detection of rice phenological stage at S1 acquisition ... 91
5.7. Estimation of plant height ... 92
5.8. Estimation of crop intensity ... 93
5.9. Discussion and conclusion ... 94
Chapter 6 Mapping products generation, validation andaccuracy assessment .. 95
6.1. Mapping products generation, validation and accuracy assessment .. 96
6.2. Discussion and conclusion ... 114
Chapter 7 Use of Sentinel-1 retrieved information in models estimating rice yield and methane emission ... 117
7.1. Introduction ... 117
iv
7.3. Rice production estimation using ORYZA2000 model ... 125
7.4. Methane emissions estimation using DNDC model ... 129
7.5. Discussion and conclusion-way forward ... 133
Chapter 8 Conclusion ... 135
8.1.Conclusions ... 135
8.2.Perspectives ... 137
Chapitre 8 Conclusion (français) ... 141
8.1.Conclusions ... 141
8.2.Perspectives ... 144
v
Acknowledgements
It is a genuine pleasure to express my deep sense of thanks and gratitude to Thuy Le Toan, my supervisor extraordinaire, who made these 3 years of thesis at CESBIO happen in the most enjoyable and motivational way. Without her help, inspiration, expertise, and encouragement, I would not be where I am today and this thesis would never have happened. Thank you very much for giving me so many wonderful opportunities!
I am extremely thankful to Mehrez Zribi for agreeing to be my administrative thesis director, for his great support and timely suggestions, with kindness and lots of encouragement throughout my thesis. I would like to thank Agnès Bégué, Francesco Mattia, Laurent Polidori, Nicola Baghdadi, and Jérôme Helbert for agreeing to be reviewers and examiners of this thesis, and especially for their relevant proofreading, valuable comments and enthusiasm for the manuscript and for the defense.
This thesis has been funded by Telespazio France and ANRT. I am very grateful to a number of people from Telespazio, particularly Jérôme Helbert, Christelle Barbey, and Guevara Sandrine who helped me coordinate my thesis in the best possible manner.
I would like to thank the many people with whom I had great international collaborations during my thesis. A special thanks goes to colleagues from AGS (Applied GeoSolutions, USA), particularly Williams Salas and Nathan Torbick for their great support and guidance me to carry out the DNDC modeling within the limited time; colleagues from IRRI (International Rice Research Institute, Philippines): Tri Deri Setiyono, Alice Laborte, Emma Quicho for helping me complete the work with the ORYZA2000 model. A sincere thanks goes to Arai Hironori, who has provided me with in-situ data for those models simulations.
I would also like to thank many friends and colleagues at CESBIO where it has been my pleasure and honor to work for the last 5 years. My sincere thanks to Juliette, Charlotte, Béatriz, Emilie and many other colleagues for the nice time we shared with each other. A special thanks goes to the BIOMASS team for their continuous support and encouragement. In particular Alexandre, Ludovic, Stéphane, Thierry, I appreciate all their contributions of time and ideas to make my PhD experience productive and stimulating.
I wish to thank many other people for all the emotional support, camaraderie, entertainment, and caring they provided. A special appreciation is due to Caroline and
vi
Stéphane who are like my family in France, and who, from the first day I came to France have been nothing less than a continuous source of support and motivation. A warm thanks to Ine and Pete for coming to Toulouse from Netherlands for my defense. A special thanks goes to Anne-Sophie, Patrick, Pauline and especially to Lucas for so many things and also for being there. I have no valuable words to express my thanks, but from bottom of my heart, thank you so much. Furthermore, I would like to thank all the people who have spent their time to attend my thesis defense and bring me a lot of energy, special mention goes to Diane and Martin, Juliette, Thang, Ha, Nguyen, Trong, Julien and Léa, Lucien, Pierre, Sylvain and all colleagues at CESBIO. I greatly appreciate your support.
I would like to extend my deep sense of gratitude to the University Paris Diderot (master Méthodes physics en télédétection), the University of Science and Technology of Hanoi (master Space and Applications), and the Advanced Physics at Hue University, for providing me all the valuable knowledges, competencies and opportunities to be able to complete this thesis today.
Lastly, and most importantly, I wish to thank my entire family in Vietnam, particularly my grandparents and parents, brothers and sisters-in-law, lovely nephews and niece, for their unconditional love, support and especially for their understanding of my choices. Finally, I apologize to all the unnamed others who helped me and supported me in various ways during this journey, one page is not enough for me to express all my sincere gratitude but what I truly want to say is, I am really thankful to all of you.
vii
Abstract
Rice is the primary staple food of more than half of world’s population and plays an especially important role in global economy, food security, water use and climate change. The objective of this thesis was to develop methods for rice monitoring based on Sentinel-1 data and to effectively use the mapping products in various applications concerning food security and global environment.
Specifically, the study aims at providing tools for observation of the rice cultivation systems, by generating products such as map of rice planted area, map of rice start-of-season and phenological stages, and map of rice crop intensity, together with rice crop parameters such as category of rice varieties (long or short cycle), and plant height. The information to be provided is necessary for the estimation of crop production, and for the management of rice ecosystems at the regional scale. We also investigated on how the products derived from EO Sentinel-1 data can be integrated in process-based models for rice production estimation and methane emission estimation.
The test region is one of the world’s major rice regions: the Mekong River Delta, in Vietnam. This region presents a diversity in rice cultivation practices, in cropping density, from single to triple crop a year, and in crop calendar.
The first step was to understand the temporal variation of the backscatter Sentinel-1 backscatter of rice fields, at VH and VV polarizations. For this purpose, in-situ data have been collected on 60 fields during 2 years, for the 5 rice seasons. It was found that backscatter time series of rice fields show very specific temporal behavior, with respect to other land use land cover types. The temporal and polarization variations of the rice backscatter have been interpreted with respect to physical interaction mechanisms to relate the backscatter dynamics to the key phenological stages, when the plants change its morphology and biomass. Because the same trend of temporal curves was observed over 5 rice seasons, it was possible to derive a mean curve to be used in the methodology developed for detecting rice phenology, and deriving information such as the date of sowing, the rice varieties of long and short duration cycle, or plant height, at each SAR acquisition date.
The methods have been developed and applied to the Mekong delta. Products validation provides a good agreement with the reference data sets: 98% in rice/non-rice accuracy, the sowing dates RMSE of about 4 days, plant height RMSE of 7.8 cm, the
viii
long/short variety map has 91.7% accuracy and for phenology, only one season has been processed with good detection rate of 59/60.
Finally, the use of the rice monitoring products as inputs in two process-based models was assessed. The models are ORYZA2000 for rice production estimation and DNDC for methane emission and water demand estimation. Sentinel-1 data retrieved information (sowing date, phenology, long/short variety, plant height) were used as model inputs, giving good agreement with the results making use of ground survey only. Based on the two process models with inputs from Sentinel-1 data, it was possible to have an integrated result on rice yield, water use, and methane emissions. The preliminary results show a good potential for the optimization of water management in rice fields in order to reduce water use and GHG emission, without reducing the yield.
To achieve the objective which is the effective use of Sentinel-1 data for rice monitoring for food security and global environment, more works need to be done concerning the consolidation of the rice monitoring method development and the integration of Sentinel-1 derived information in models aiming at estimating and predicting rice production, methane emission and water use.
ix
Résumé
Le riz est la principale denrée de plus de la moitié de la population mondiale et joue un rôle particulièrement important dans l’économie mondiale, la sécurité alimentaire, la consommation d’eau, et le changement climatique. L’objectif de cette thèse consistait à développer des méthodes pour le suivi du riz basées sur des données Sentinel-1 ainsi qu’a utiliser les produits de cartographie obtenus dans diverses applications portant sur la sécurité alimentaire et l’environnement mondial.
Plus spécifiquement, l’étude a pour but de fournir des outils pour observer la culture du riz, en produisant la cartographie des surfaces cultivées, celle des stades phénologiques de la plante comprenant le début de la saison, celle des deux principales catégories de variétés de riz à cycle court et cycle long, la hauteur de la plante, et la carte annuelle du nombre de récoltes de riz par an. Ces informations sont nécessaires à l’estimation de la production du riz, et à la gestion des cultures à l’échelle régionale. Nous étudions aussi l’intégration des produits ainsi développés dans un modèle de processus destinés à estimer le rendement du riz, et un modèle permettant la dérivation de l’émission du méthane et le volume d’eau nécessaire à la culture.
La région test est l’une des régions rizicoles majeures à l’échelle mondiale, qui est le Delta du Mékong, au Vietnam. Cette région est caractérisée par une grande diversité de pratiques agricoles, du nombre de cultures du riz par an, et dans les calendriers des récoltes.
La première phase du travail est la compréhension de la variation temporelle des valeurs de rétrodiffusion radar de Sentinel-1, en polarisation VH et VV. Pour cela, des données de terrain ont été collectées sur 60 champs, sur 5 saisons de riz pendant 2 ans. Les variations temporelles des mesures radar ont été interprétées en fonction de la croissance des plantes le long des stades phénologiques. Les mêmes courbes caractéristiques observées lors des 5 saisons ont suggéré l’utilisation d’une courbe ‘type’ dans le développement des méthodes pour fournir les produits requis.
Les résultats obtenus sur le Delta du Mékong ont été validés à l’aide des données terrain de référence, et sont très satisfaisants : 98% de précision pour la carte riz/non riz, une RMSE de 4 jours pour la date de semis, une RMSE de 0.78 cm pour la hauteur de plante, 91,7% de précision pour la distinction entre deux types de riz (cycle court et cycle long), et 98% de précision sur l’estimation du stade phénologique.
x
Enfin, nous avons évalué l’utilisation de ces produits issus de données Sentinel-1 dans le modèle ORYZA2000 destiné à estimer le rendement du riz, et dans le modèle DNDC destiné à estimer le volume d’eau nécessaire à la culture, ainsi que l’émission de méthane par les rizières. Les résultats, préliminaires, montrent le bon potentiel de l’approche pour fournir le rendement, le bilan d’eau, et les taux d’émission de méthane sur les champs de riz considérés. Cette approche permettrait de faire des analyses de sensibilité, par exemple pour optimiser la gestion d’irrigation afin de réduire la consommation d’eau et l’émission de méthane, tout en préservant le rendement du riz.
Ces travaux, qui démontrent le potentiel des données Sentinel-1 pour le suivi du riz à large échelle, seront à compléter afin de réaliser des applications effectives opérationnelles. Il s’agira de renforcer les méthodes et de les tester sur différents systèmes rizicoles, et de poursuive l’étude sur l’intégration de ces produits de télédétection dans les modèles permettant d’évaluer la productivité, les besoins en eau et les émissions des gaz à effet de serre des rizières.
xi
List of Tables
Table 1. Three main growth environments ... 21 Table 2. Main rice seasons in the Mekong Delta ... 32 Table 3. Crop calendar in three main regions (North, Center and South) in Vietnam. For each
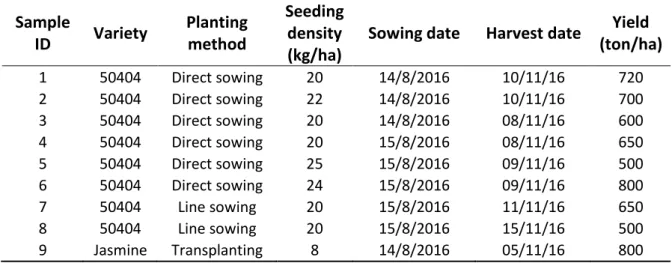
season, the planting, mid-season and harvest stage correspond to the lighter-darker colors. ... 33 Table 4. Crop calendar in Cambodia ... 34 Table 5. Example of general collection information of rice fields under study. ... 36 Table 6. Example of rice plant parameters measured at some sample rice fields under study. ... 37 Table 7. Sentinel-1 operative modes. ... 46 Table 8. Ground survey of the sowing dates and harvest dates of 60 rice field samples under
study over 5 rice cropping seasons. ... 52 Table 9. Summary of the number of surveyed fields by rice varieties, planting methods,
seeding density, and rice cycle duration of the 60 sampled rice fields under study over 5 rice cropping seasons. ... 54 Table 10. The incidence angle (in degrees) of the IWS data corresponding to the 3 different
sub-swaths of different incidence angle ranges from 29.1° to 46°. ... 68 Table 11. Calendar of the Summer-Autumn rice season in 2016 in the 13 rice growing
xii
for 2015 and 2016 are shown to point out the change in crop calendar decided by farmers and local authorities motivated by the impacts of El Nino in 2015. ... 84 Table 12. Comparison in rice/non-rice check points from Ground Survey and the rice map
derived from the Sentienl-1 data. ... 102 Table 13. Rice planted area (in ha) provided by the 13 provinces and estimated by Sentinel-1 for the Summer-Autumn Rice season of 20Sentinel-16. ... Sentinel-102 Table 14. Comparison long/short cycle rice variety from Ground Survey and the Sentinel-1
product. ... 107 Table 1. Water demand under two water management scenari for 2016 rice seasons (triple
crop). ... 132 Table 2. The simulated results of rice yield, CH4 emission and water demand for the fields
xiii
List of Figures
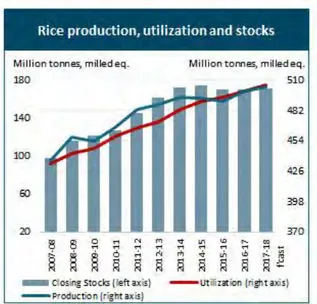
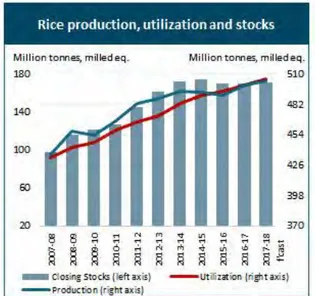
Figure 1. Main crop with the maximum harvested area in every country in the world (Source: FAOSTAT, 2004). ... 2 Figure 2. 2007-2018 variation of world rice production, rice utilization, and stocks (in Million
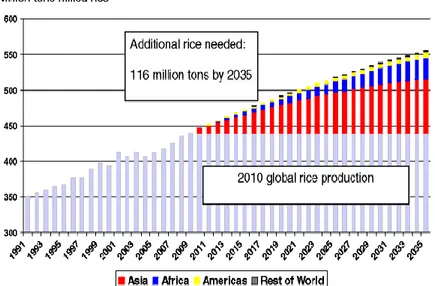
tons) (source: FAO, 2018). ... 2 Figure 3. Projection of the additional rice needed by 2035, as compared to the 2010 level (Seck et
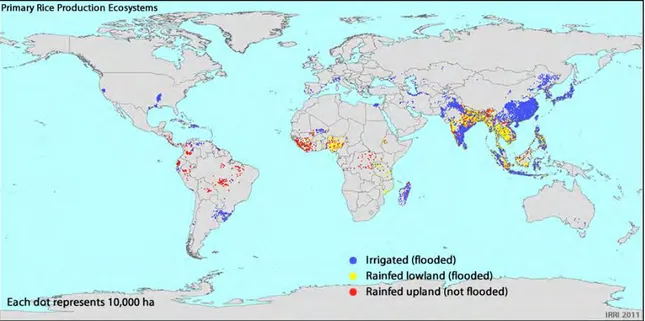
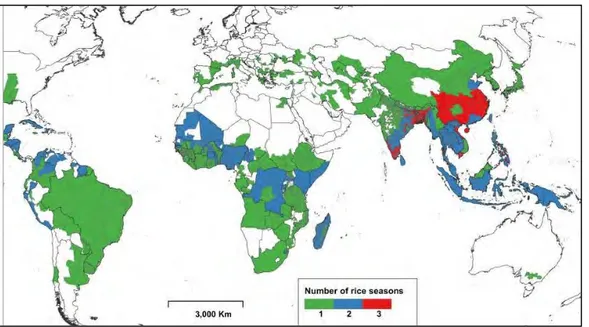
al., 2012). ... 3 Figure 4. Map of the main rice production ecosystems. Source: IRRI. ... 22 Figure 5. Map of cropping density or number of rice seasons per year (Laborte et al., 2017). .... 23 Figure 6. Illustration of the vertical structure of rice plant at vegetative phase (Source:
Ricepedia.org)... 24 Figure 7. Illustration of the plant structure of rice at reproductive phase (Source: Ricepedia.org). ... 24 Figure 8. Import, export, production and consumption of rice in 2017 (milled rice equivalent –‘000
tons) (Data from FAO, 2018). ... 25 Figure 9. The Study region and map of 13 provinces in the Mekong Delta, Vietnam ... 30 Figure 10. The time table of the study data sets: collected ground data and Sentinel-1 data, along
with the rice crop calendar in the An Giang province, Mekong Delta, Vietnam. ... 36 Figure 11. Example of check points for rice map product validation recorded during the 3-8 July
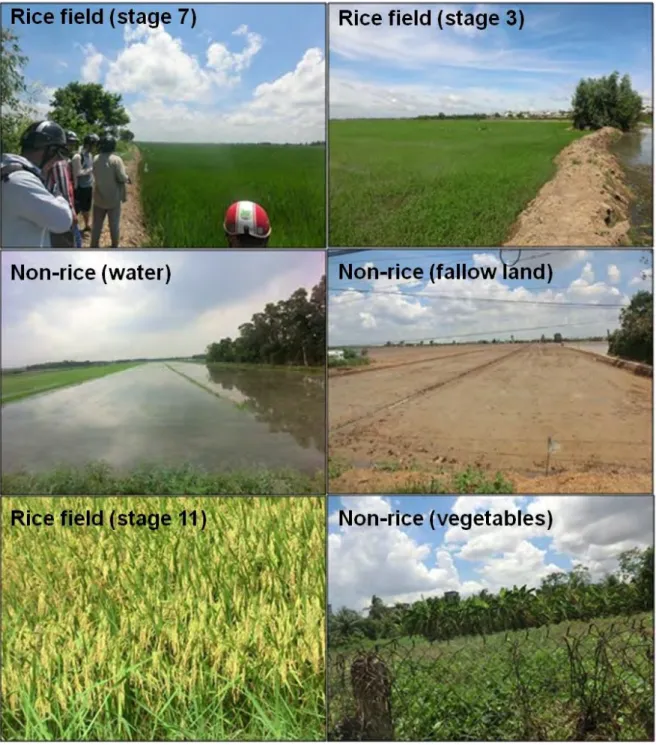
2016 campaign. Around 100 rice and 30 non rice points for each of the 3 main rice regions. ... 38 Figure 12. Example of the rice and non-rice sample photographs taken during the field trip in the
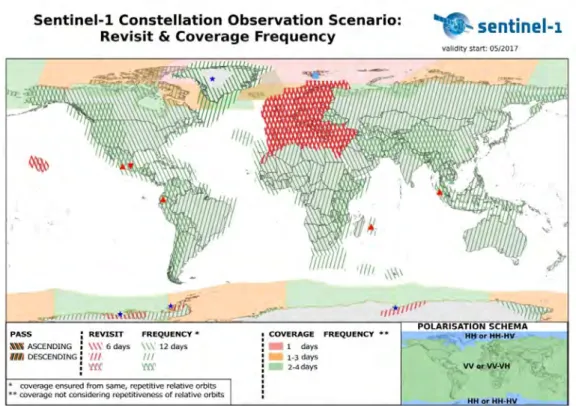
Mekong Delta, Vietnam. ... 39 Figure 13. Sentinel-1 satellite and acquisition mode (Source https://sentinel.esa.int/). ... 45 Figure 14. An example of the archived observation scenario maps of the Sentinel-1 mission. This
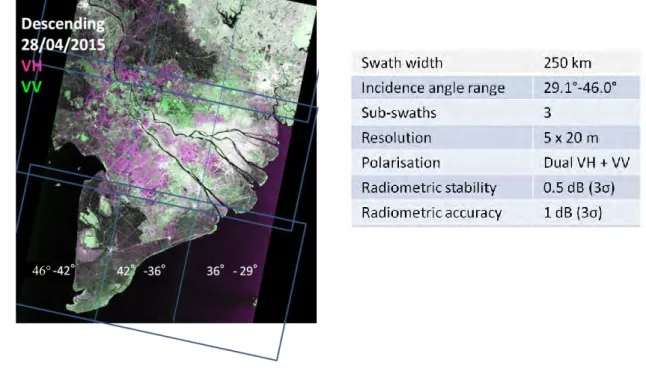
map contains information of orbit pass, revisit frequency, coverage frequency and polarization scheme globally. (Modified from https://sentinel.esa.int/). ... 47 Figure 15. Example of Sentinel-1 image (descending pass) on 28/04/2015 to cover the whole
Mekong River Delta, Vietnam (left) and Sentinel-1 image characteristics (right). The three incidence angle ranges are noted on the image. ... 48 Figure 16. Sentinel-1 data schema over 4 strips coverage Vietnam and Cambodia. ... 49
xiv
Figure 17. The histogram of sowing date and harvest date of 60 rice field samples during 5 rice cropping seasons. N represents the number of fields, DoY is the Day of the Year. ... 53 Figure 18. The crop calendar (sowing dates, harvest dates and cycle duration) of 8 same rice field
samples over 5 rice cropping seasons. ... 53 Figure 19. Histogram of final yields of IR50404 (the first column), Jasmine & Taiwan (the second
column) and of all 60 rice field samples (the third column) over 3 consecutive rice cropping seasons in Summer-Autumn 2016 (the first row), Autumn-Winter 2016 (the second row) and Winter-Spring 2017 (the third row). The vertical axis represents the number of fields. .... 55 Figure 20. Histogram of final yields of IR50404 & OM5451 (the first column), Glutinous (the
second column), Jasmine (the third column) and of all 60 rice field samples (the fourth column) over 2 consecutive rice cropping seasons in Autumn-Winter 2017(the first row) and Winter-Spring 2018 (the second row). ... 56 Figure 21. Temporal variation of plant height (versus days after sowing): 15 sampling fields for
long-cycle rice plants (blue points and black polynomial regression); 51 sampling fields for short-cycle rice plants (red points and pink polynomial regression) of 2 consecutive rice cropping seasons in Autumn-Winter 2017 and Winter-Spring 2018. ... 57 Figure 22. Box plot of phenological stage (from 1 to 12, corresponding to the stage name on the
left part of the figure) of 51 short-cycle rice sampling of Autumn-Winter 2017 and Winter-Spring 2018 rice seasons. ... 58 Figure 23. Box plot of phenological stage of 15 long-cycle rice sampling of Autumn-Winter 2017
and Winter-Spring 2018 rice seasons. ... 59 Figure 24. Histogram at each phenological stage of 120 rice samplings (60 sampling of Autumn-Winter 2017 and 60 sampling of Autumn-Winter-Spring 2018 rice seasons). ... 59 Figure 25. The backscattering mechanisms involved in rice fields at the flooding stage in
traditional cultural practices, before transplanting (left), early vegetative stage (center), and late vegetative stage (right). ... 62 Figure 26. Simulation results from MIPERS (left), compared with Sentinel-1 backscatter profiles
(right), for the VH backscatter of a rice field following traditional cultivation (transplanting, continuous flooding,long cycle rice). ... 64 Figure 27. VH and VV backscatter coefficients and their ratioVH/VV extracted for the 60 sampled
fields from Sentinel-1 images from 06/10/2014 to 19/11/2017. It is noted that the revisit time of the Sentinel-1(A+B) from 26/09/2016 is every 6 days. The black curves are the averaged quantities for all 60 fields. ... 66
xv
Figure 28. Example of RGB combinations of different dates (R:26/10/2016, G:01/11/2016, B: 26/10/2016) from Sentinel-1 images, VH polarization over rice fields in the An Giang province. ... 67 Figure 29. Example of the temporal variation of VH, VV and ratio VH/VV backscatters over rice
fields in 44° (An Giang) and 31° (Ben Tre) in the Mekong Delta. ... 68 Figure 30. Maximum temporal change of VH backscatters over rice fields versus incident angle of
Sentinel-1 data in the Mekong Delta. ... 69 Figure 31. Temporal change of VH and VV backscatters over water bodies versus incident angle
of Sentinel-1 data in the Mekong Delta. ... 70 Figure 32. Variation of VH, VV backscattering coefficient, and polarization ratio VH/VV over
rice fields and water sample extracted from S1 images at ascending and descending orbits. ... 71 Figure 33. Variation of VH, VV backscattering coefficient, and polarization ratio VH/VV of the
30 sampled fields extracted from S1 images versus the sowing date of each field. On the horizontal axis, phenological stages from 1 to 12 are indicated. ... 73 Figure 34. Illustration at some phenological stages in the rice field under study. ... 74 Figure 35. Temporal evolutions and standard deviation of VH (the first row), VV (the second row),
and VH/VV (the third row) of short rice cycle (the first column) and long rice cycle (the second column) over 4 rice cropping seasons Autumn-Winter 2016 (AW-16), Winter-Spring 2017 (WS-17), Autumn-Winter 2017 (AW-17) and Winter-Spring 2018 (WS-18). ... 75 Figure 36. VH backscatter as a function of plant age (days after sowing) of two rice fields under
study: long cycle rice (transplanting, continuous flooding) on the left and (direct seeding, AWD) on the right. ... 76 Figure 37. Temporal evolutions of VH, VV, and VH/VV backscatters of Sentinel-1 time series
over rice fields, of 3 crops a year (panel a), 2 crops a year (b), 1 crop a year (c), 3 rice crops a year followed by aquaculture (d), forest/tree (e), urban (f) and water body (g), from October 2014 to November 2017. ... 78 Figure 38. Workflow of rice monitoring method using Sentinel-1 data. ... 82 Figure 39. Example of maximum increasing of VH backscatter temporal change during rice growth
cycle. ... 83 Figure 40. PDFs of the intensity VH_max_inc of (red line) class A and (blue line) class B with
class parameters: 𝑟𝐴 = 2.95 dB and 𝑟𝐵 = 8.76 dB, 𝑟0 = 5.084 dB and Δr= 5.81 dB for L =4.4. ... 87
xvi
Figure 41. Probability of error (in %) of the ratio method as a function of the change in intensity ratio Δr (dB) between the two classes, for a number of looks L varying between 1 and 128 (Bouvet et al., 2010). ... 88 Figure 42. Experimentally derived curve of VH/VV used for sowing date retrieval. ... 89 Figure 43. Illustration of sowing date retrieval estimation method. ... 90 Figure 44. Smoothing function with VH/VV time series for rice cropping intensity estimation. 94 Figure 45. Mapping of main land use land cover in the Mekong River Delta including land water,
aquaculture, forest/ trees, urban or built up area. ... 97 Figure 46. Comparison of land cover maps of forest, river, urban and rice by Sentinel 1 with the
Google Earth map. ... 97 Figure 47. Rice map derived from 20 images of Sentinel-1 (10m spatial resolution) in Summer-Autumn 2018 in the Mekong Delta (left) and An Giang province (right). ... 98 Figure 48. Seasonal rice maps over 3 years 2015, 2016 and 2017 in the Mekong River Delta,
Vietnam. ... 99 Figure 49. Rice mapping in Winter-Spring 2015 is compared to Rice in Winter-Spring 2016 in the
Mekong Delta, Vietnam. Red: Rice, Blue: Water, Green: non-rice (forest, urban, etc.) .. 100 Figure 50. Example of rice map of the Summer-Autumn rice season in 2016 generated from
Sentinel-1, overlayed by GIS file of the 60 surveyed rice fields in the An Giang province (left) and overlay of GPS independent check points at a different region in the Mekong Delta (right). ... 101 Figure 51. Comparison in rice planted areas from the Sentinel-1 product and the Agency data for
the Summer-Autumn 2016 rice season. ... 103 Figure 52. Sowing date map derived from 20 images of Sentinel-1 (10m spatial resolution) in
Winter-Spring 2017 in the Mekong Delta (left) and An Giang province (right). ... 104 Figure 53. Retrieved sowing date in over 4 rice cropping seasons by Sentinel-1 vs. ground data
collection of 60 rice fields in Chau Thanh and Thoai Son districts, An Giang province. 105 Figure 54. The sensitivity of the sowing date estimation using time series of Sentinel-1 with a 6-day revisit and 12-6-day revisit. ... 106 Figure 55. The sensitivity of the sowing date estimation using time series of Sentinel-1 with a 6-day revisit over 3 rice cropping seasons. ... 106 Figure 56. Long short cycle rice in Winter-Spring 2017 in the Mekong Delta (left) and An Giang
province (right). ... 107 Figure 57. Phenological stage map on 12/01/2017 of Winter-Spring 2017 in the Mekong Delta
xvii
Figure 58. Comparison of the phenological stages detected by Sentinel-1 and recorded by ground survey. ... 109 Figure 59. The fieldtrip for in situ visual assessment of phenological stages mapping using
Sentinel-1 images in Can Tho province, Mekong Delta on 25 October 2016... 109 Figure 60. Plant height map in the Mekong River Delta on 12/01/2017 of Winter-Spring 2017 in
the Mekong Delta (left) and An Giang province (right). ... 110 Figure 61. Plant height validation using the ground measurement of Winter-Spring 2017. ... 110 Figure 62. Rice crop intensity map in the Mekong River Delta in 2016. ... 111 Figure 63. Mapping result in Vietnam and Cambodia using Sentinel-1 data from November 2015
to March 2016. ... 112 Figure 64. Dry season (12/2015-03/2016) 474.270k ha, compared to past AFSIS statistics in
Cambodia. ... 113 Figure 65. Rice mapping in Medium wet season 2015 is compared to Rice in Dry season 2016 in
Cambodia. Red: Rice, Blue: Water, Green: non-rice (forest, urban, etc.) ... 114 Figure 1. Schematic representation of ORYZA1 in the situation of potential production. Boxes are
state variables, valves are rate variables, and circles are intermediate variables. Solid lines are flows of material and dotted lines are flows of information (Bouman and Van Laar, 2006). ... 120 Figure 2. Structure of the DNDC model (New Hampshire, 2012). ... 122 Figure 3. Variations of water level, sunshine hours and precipitation from January 2015 to
December 2016 (adapted from data by Arai et al., 2016). ... 125 Figure 4. Comparison of rice yield simulated by ORYZA 2000 with in situ rice yields for 2 rice
plots (CF and AWD) in Can Tho province over 5 rice seasons (15, AW-15, WS-16, SA-16 and AW-SA-16). ... 126 Figure 5. Rice yield simulation of rice sample at continuously-flooding (CF) and of the alternate-wetting-and-drying field-water treatment (AWD) over 5 rice cropping seasons Summer-Autumn 2015 (SA-15), Summer-Autumn-Winter 2015 (AW-15), Winter-Spring 2016 (WS-16), Summer-Autumn 2016 (SA-16) and Autumn-Winter 2016 (AW-16). ... 127 Figure 6. Comparison of rice yield simulated by ORYZA 2000, using inputs from Sentinel-1
products with in situ rice yields for 2 rice plots in Can Tho province over 5 rice seasons (SA-15, AW-(SA-15, WS-16, SA-16 and AW-16). ... 128 Figure 7. Comparison of rice yield simulated by ORYZA 2000, using inputs from Sentinel-1
products and using in situ data sets for 2 rice plots in Can Tho province over 5 rice seasons (SA-15, AW-15, WS-16, SA-16 and AW-16). ... 128
xviii
Figure 8. Comparison of simulated methane emission based on Sentinel-1 data using DNDC and measured methane emission for 2 rice plots per season (CF and AWD) in Can Tho province over 5 rice seasons (SA-15, AW-15, WS-16, SA-16 and AW-16). ... 130 Figure 9. Methane emission simulation of rice sample at continuously-flooding (CF) and of the
alternate-wetting-and-drying field-water treatment (AWD) over 5 rice cropping seasons Summer-Autumn 2015 (SA-15), Autumn-Winter 2015 (AW-15), Winter-Spring 2016 (WS-16), Summer-Autumn 2016 (SA-16) and Autumn-Winter 2016 (AW-16). ... 130 Figure 10. Model outputs of DNDC simulation ... 131 Figure 11. Model result of water balance. ... 132 Figure 12. In situ data of irrigation water for each season in Can Tho experiment site for CF and
1
Chapter 1
Introduction
Contents
1.1 Importance of rice ... 1 1.2 State of the art in the use of remote sensing for rice monitoring ... 4 1.3 Research objectives and thesis structure ... 7
1.1. Importance of rice
Rice is the primary staple food of more than half of world’s population and plays an especially important role in global economy, food security, water use and climate change. In 2016, 754.6million tons of world rice production were estimated over 166 million ha of world rice production area (FAO, 2017), making it the second most-produced cereal after maize (825 million tons of maize), the second after wheat in cultivated areas (215 million ha of wheat) (Prospects and Situation, 2018). Worldwide, more than 3.5/7.6 billion people depend on rice for more than 20% of their daily calorie intake. Moreover, rice cultivation is the principal activity and source of income for more than 144 million farm households in the world, a majority of those in low-income and developing countries (IRRI, 2010). Figure 1 shows that rice is the main crop for most countries in Asia where over 90% of the world’s rice crop is produced and consumed.
2
Figure 1. Main crop with the maximum harvested area in every country in the world (Source: FAOSTAT, 2004).
At the global scale, rice consumption was found to increase steadily as shown in Figure 2, because increases in population have kept overall demand on the rise, despite the tendency for per capita rice consumption to decline. Figure 2 also shows that the rice production exceeded consumption up to 2014-2015, and since then, production and consumption are of the same order. It is noted that the inter-annual variation of the production can be significant.
Figure 2. 2007-2018 variation of world rice production, rice utilization, and stocks (in Million tons) (source: FAO, 2018).
3
Eventually, with the extremely rapid growth of population, rice production will face a challenge of attaining rice self-sufficiency and food security. By 2035, world human population is expected to reach around 9 billion, whereas recent estimates indicate that to meet the projected demand, global rice production will have to increase by 78% from its 2010 levels, as illustrated in Figure 3.
Figure 3. Projection of the additional rice needed by 2035, as compared to the 2010 level
(Seck et al., 2012).
Milled rice: rice with the husk and the bran layers removed to produce white rice for consumption. For most varieties, around 70% of milled rice is produced from rough rice.
On the other hand, rice agriculture is strongly linked to environmental issues from water management to climate change. Firstly, rice is a very sensitive cereal crop which is seriously affected by the adverse impacts of climate change. In the last decade, rice has become increasingly threatened by the effects of drought. Drought stress greatly influences the growth duration, but also leads to damages during reproductive stages of the rice crop, especially during flowering. Moreover, in the humid regions of Southeast Asia, there are many hectares that are technically appropriate for rice production but are left uncultivated or are grown with very low yields because of salt intrusion which affect the soils. Low water levels in Viet Nam’s Mekong River Delta, the country’s rice bowl, have resulted in an inward flow of salt water, increasing the salinity in the river water and endangering rice paddies (Redfern et al., 2015).In addition, the increase in the number of floods and some of the most devastating cyclones are also directly affected to rice production. Reversely, rice fields are a major generator of methane and nitrous oxide, responsible for 25% of the total budget of global methane emissions from agriculture (Saunois et al., 2016).
4
In summary, it is evident that rice agriculture is globally significant in terms of food security, water resources, and climate change.
In this context, comprehensive, reliable and timely information on rice crop are highly needed for national food security, in terms of risk occurrence and annual production projections, with potential impact on political stability. With respect to global environment, accurate information is needed on the spatial distribution of rice fields, on water resource management and greenhouse gas emissions, to assess the role of rice agriculture in the global carbon and water cycle.
1.2. State of the art in the use of remote sensing for rice monitoring
The use of remote sensing imagery for rice mapping and monitoring has been demonstrated in several studies using different sensors of various spectral characteristics and spatial resolutions. Both optical and microwave remote sensing systems offer practical means for rice mapping and monitoring in different parts of the world.
Optical satellite sensors provide multi-temporal and multi-spectral reflectance data over croplands that can be used for deriving time-series of vegetation indices (VIs) in the spectral range 0.4 to 2.5 µm. The reflectance spectrum of a rice crop canopy is the result of a complex relationship between its biophysical and biochemical attributes. The most commonly applied optical sensors include Landsat, SPOT-VGT, MODIS, etc. to explore the ability of optical remote sensing instruments to identify rice areas (Xiao et al., 2005, Nguyen et al., 2012, Son et al.,2013, Clauss et al., 2018, Singha et al., 2017). However, cloud cover exceeding 70% of the time in most rice growing region in the tropics tropical regions limits the use of high resolution optical data (of the order of 10-30 m). On the other hand, coarse spatial resolution data (i.e., in the range 500 m to 1 km) with higher temporal resolution are less adapted to rice cropland monitoring at local scale where fields are not uniform and whose size is of the order of 1 ha or smaller (Bellon et al., 2017).
Microwave remote sensing techniques have the advantage of their all-weather capability, and Synthetic Aperture Radars (SAR) can provide high resolution data. Studies on rice fields monitoring using SAR systems have been carried out since late 80s. These studies have been conducted to assess the potential of SAR systems operating at different frequency bands for rice cropland monitoring, including L-band (Wang et al., 2005), C-band (Le Toan et al., 1997, Bouvet et al., 2009, Lam-Dao et al., 2009, Bouvet et al.,2011, Nguyen et al., 2015, Nguyen et al., 2016), and X-band (Lopez-Sanchez et al., 2011, Fan et al., 2011,
5
Inoue and Sakaiya 2014a). In a comprehensive study conducted using ground based experimental data by Inoue at al. (2002), the relations of radar backscatter at various frequencies (Ka-, Ku-, X-, C-, L-) polarization and incidence angles with rice biophysical parameters have been analysed.
However, those demonstration studies have not yet resulted in effective applications. One of the major obstacles is the lack of systematic, high resolution and cost effective SAR data. According to the studies, monitoring of rice from remote sensing requires cost effective SAR data at high resolution (10-30 m) and temporal resolution of the order of 10 days. With the launch of Copernicus Sentinel-1 satellite in 2014 (Sentinel 1A) and 2016 (Sentinel 1B), the required data, which are systematically and globally acquired every 12 (or 6) days, widely accessible at no cost, are now available.
Mapping the rice areas extent using SAR data has been widely demonstrated. In many studies, rice fields were identified by their low backscatter at the start of season where the fields are flooded (Shao et al., 2001, Nelson et al., 2014, Nguyen et al.,2016, Torbick et al., 2017). This is no longer adapted to rice fields with new planting practices of direct sowing on wet soil. Le Toan et al., (1997) found that the identification of rice fields cannot be conducted properly by employing standard classification methods based on the similarity in the image intensity of rice fields. Temporal change measurement methods were developed for the mapping of rice fields based on the temporal variation of the SAR signal in order to cope with inter-field differences (Le Toan et al., 1997, Chen et al., 2007, Liew et al., 1998, Ribbes et al., 1999, Bouvet et al., 2011) using ERS-2, RADARSAT-1, and ENVISAT/ASAR. The polarization behavior of rice fields resulting from the vertical structure of rice plants during the vegetative stage has been exploited in the use of polarization ratio (e.g. HH and VV of ENVISAT/ASAR) (Wang et al., 2005, Bouvet et al., 2009, Lam Dao et al., 2009, Lopez-Sanchez et al., 2010). Other use of both temporal and polarization variation of rice fields has been demonstrated, for example using a Wishart distribution-based multi-temporal classifier of ENVISAT-ASAR APS or a combined entropy decomposition and support vector machine (EDSVM) method using RADARSAT-1 data (Tan et al., 20RADARSAT-1RADARSAT-1) (as described in the review of Kuenzer et al., 20RADARSAT-13 and Mosleh et al., 2015).
A number of research efforts have been directed towards the detection of rice growth stage. The works have been realized with multi-temporal C-band SAR using ERS, RADARSAT-1 or ASAR (Inoue et al., 2014, Chakraborty et al., 1997, Inoue et al., 2002). To detect the start of the season (SoS), which corresponds to the sowing or transplanting
6
date, has been estimated in several studies, either as a mere step in the rice mapping process (Inoue et al., 2014a) or as a self-standing product (Liew et al., 1998). Other studies use the polarimetric SAR data to detect phenology stages, these studies rely on the fact that the rice plant changes its structure at each phonological stage. This leads to the change in ‘polarimetric signature’ of rice fields. The studies were conducted by Lopez-Sanchez et al., (2012) in X- and C-band, and by Inoue et al., (2014) using the X- and C-band data from COSMO-Skymed and RADARSAT-2, respectively. Later on, the methods suggested by Vicente-Guijalba et al., (2014), De Bernardis et al., (2015), Nr et al., (2017), and Kucuk et al., (2016) improved the growth stage estimation algorithms using advanced methods such as Kalman filters, particle filters, and Support Vector Machines.
For rice production estimation, in most studies, yield data obtained by post harvest ground survey are combined with rice planted area detected by remote sensing to provide rice production (Shao et al., 2001, Ferencz et al., 2004). Other approaches are based on empirical relationships between backscatter temporal data and the final yield to extend the yield estimates over larger area (Prasad et al., 2006, Bolton et al., 2013, Koide et al., 2013, Maki et al., 2017). Despite the encouraging results (94% prediction accuracy), these approaches are difficult to generalize, and they have no prediction capability. Agro-meteorological yield prediction models are important tools to understand the impacts of weather, soil, plant characteristics, and cultural practices on the final yield. Regarding rice yield models, the most important model is ORYZA2000 (Bouman et al., 2001) and later on, different versions are proposed in literature (Li et al., 2017). The models consider the factors impacting the growth rate which are solar radiation, temperature, and cultivar characteristics governing the phenological and morphological development of the plants. Until recently, the use of remote sensing in the model has been addressed through the Leaf Area Index, derived mainly from MODIS data (Doraiswamy et al., 2005). The SAR data have been used for localization of rice pixels, and in a recent paper (Setiyono et al., 2018), for deriving the Start of Season as an input to the ORYZA model.
For methane emission estimation from rice fields, during the past two decades, many empirical and physical models have been developed to predict GHG emissions from rice fields. In a number of empirical models, the regression relationships between CH4
emission rate and rice biomass or yield were used to estimate CH4 production (Sinha et al.,
1995, Kern et al., 1997, Anastasi et al., 1992, Zhang et al., 2011). Although these empirical approaches were easy to use, the accuracy and precision of estimated results could not be ensured, and the variation in emissions at regional scale also could not be explained
7
reasonably. The major models that are able to simulate CH4 production include MEM (Cao
et al., 1995a), MERES (Matthews et al., 2000), InfoCrop (Aggarwal et al., 2004), and DNDC (Li et al., 1992a). Among the candidate models, DNDC has been tested for the rice paddies in China and other Asian countries (Fumoto et al., 2008, 2010; Kai et al., 2010; Zhang et al., 2011; Katayanagi et al., 2017). As a process-based biogeochemical model, DNDC is able to track carbon (C) and nitrogen (N) cycles in agro-ecosystems driven by both the environmental factors and management practices. Model simulations have been conducted at experimental fields and compared with in situ measurements of methane emissions (Salas et al., 2010; Torbick, Salas, et al., 2017). Extension to emissions at regional scale has been done by assigning the same emissions to rice fields identified at the region using remote sensing.
For rice production estimation and prediction, and for methane emissions estimations, research still needs to be conducted on the effective use of remote sensing data as inputs or validation data in rice yield prediction and methane emission models.
1.3. Research objectives and thesis structure
The objective of this PhD thesis is to exploit the time series of Sentinel-1 SAR data for rice mapping and monitoring. This thesis also aims to further apply the results of rice mapping and monitoring using SAR data, as inputs for models of rice production and methane emission estimations. The core of this work is to develop and test methods based on the knowledge of the temporal development of the rice plants and rice fields under different conditions, and on the understanding of the related temporal variation of the radar backscatter. The purpose here is not to derive the best possible rice map at each site through intensive calibration or large-scale fieldwork, but to introduce a simple approach that is robust, repeatable and suitable for rapid rice mapping over large extents with cost-effective field work. The overarching goal is to demonstrate that SAR-based operational mapping of rice crops across a diverse range of environments is possible based on the increasing availability of multi-temporal SAR data. The thesis is a timely contribution to remote-sensing applications for food security, since it presents a method to derive sufficiently accurate rice area maps under different conditions that are typical of the diversity of rice environments in Asia. The thesis is structured in 8 chapters, including introduction and conclusion.
8
The importance of rice in food security, methane emission and water consumption were presented in this chapter in order to determine the information requirements for rice monitoring with respect to rice productions and methane emissions. The state of the art concerning the rice mapping and monitoring using remote sensing and applications is also presented in this chapter.
Next, chapter 2 gives an overview of the rice in the world including socio economical aspect, rice ecosystems and its growing cycle, rice productivity and methane emissions from rice cultivation.
Then, chapter 3 describes our study area and the data sets used through this thesis. The first part presents the general characteristics of the study site and experimental studies. In the second part, the remote sensing data set characteristics and data available for this research as well as data pre‐processing chain are presented.
Chapter 4 consists in SAR data analysis as a function of ground data, and then physical interpretation of the temporal and polarization behavior of the radar backscatter response on rice canopy. This chapter is concluded by derivation of indicators for rice mapping and monitoring. Based on the analysis and interpretation results, chapter 5 describes the methodologies developed for the mapping of rice area, rice varieties, rice cropping intensity and rice parameters retrieval (sowing date, phenological stage and plant height).
Products derivation is presented in chapter 6 together with products validation and accuracy assessment. At last, the applications of the rice monitoring products are described in the chapter 7. For that, two process-based models are used in this thesis for rice yield estimation and methane emission using the mapping products developed in this research as direct input parameters. To conclude the chapter, some discussion and conclusion-way forward are presented in order to improve the performances of the models.
Finally, Chapter 8 concludes this thesis by summarizing and discussing the main finding in this thesis and dedicates the perspectives for future researches in relation to this thesis.
9
Chapitre 1
Introduction
Contents
1.1 L’importance du riz ... 9 1.2 Etat de l’art de l’utilisation de la télédétection pour le suivi le riz ... 12 1.3 Objectifs de recherché et structure du manuscrit ... 16
1.1. L’importance du riz
Le riz est la principale denrée de plus de la moitié de la population mondiale et joue un rôle particulièrement important dans l’économie mondiale, la sécurité alimentaire, la consommation d’eau, et le changement climatique. En 2016, la production mondiale de riz a été estimée à 754,6 millions de tonnes sur 166 millions d’hectares de surface cultivée (Up, 2017), ce qui en fait la deuxième céréale la plus produite après le maïs (825 millions de tonnes), et la deuxième en termes de surface cultivée après le blé (215 millions d’hectares) (Prospects and Situation, 2018). Plus de 3,5 sur 7,6 milliards d’individus à travers le monde dépendent du riz pour plus de 20% de leur apport calorique journalier. De plus, la culture du riz est l’activité principale et la première source de revenus pour plus de 144 millions de foyers dans le monde, la plupart dans des pays en développement et à faibles revenus (IRRI, 2010). La Figure 1 montre que le riz est la culture principale pour la plupart des pays d’Asie, où plus de 90% de la production de riz est réalisée et consommée.
10
Figure 1. Culture avec la plus grande surface cultivée par pays (Source : FAOSTAT, 2004).
Comme le montre la figure 2, il a été observé au niveau mondial que la consommation de riz est en augmentation constante, ce qui est dû au fait que la croissance de la population a provoqué une hausse de la demande globale, malgré la tendance décroissante de la consommation de riz par personne. La figure 2 montre également que la production de riz était plus importante que la consommation jusqu’à 2014-2015, et que les deux quantités sont depuis du même ordre de grandeur. Il est également observé que la variation interannuelle de production peut être considérable.
Figure 2. Evolution de la production de riz, de l’utilisation du riz produit, et des réserves de riz (en millions de tonnes) de 2007 à 2018 (Source : FAO, 2018).
11
À terme, étant donné la croissance importante de la population mondiale, la production de riz risque de ne plus être suffisante pour assurer les besoins alimentaires mondiaux. D’ici 2035, il est attendu que la population mondiale atteigne environ 9 milliards d’individus, et des estimations récentes indiquent que la production mondiale de riz devra augmenter de 78% par rapport à son niveau de 2010 pour satisfaire la demande prévue, comme indiqué sur la figure 3.
Figure 3. Prévision de la quantité de riz additionnelle nécessaire jusqu’en 2035, par rapport au niveau de 2010 (Seck et al., 2016).
Milled rice : riz dont l’enveloppe et le son ont été retirés pour produire du riz blanc propre à la consommation. Pour la plupart des variétés, environ 70% de milled rice sont produits à partir du riz brut.
L’agriculture du riz est également fortement liée à des défis environnementaux de la gestion de l’eau au changement climatique. Tout d’abord, le riz est la culture céréalière la plus sensible aux effets néfastes du changement climatique. Dans la dernière décennie, le riz s’est vu de plus en plus menacé par les effets de sécheresse. Le stress hydrique provoqué par la sécheresse non seulement influence grandement la durée de croissance du riz, mais provoque également des dommages pendant le stade reproductif de la culture de riz, particulièrement pendant la floraison. De plus, dans les régions humides du Sud-Est de l’Asie, il existe de nombreux hectares de terrain en théorie appropriés à la production de riz, mais non cultivés ou alors avec des rendements très faibles à cause de la salinité des sols. Les basses altitudes de la région du Delta du Mekong vietnamien, le ‘bol de riz’ du pays, ont eu pour conséquence un afflux d’eau salée vers l’intérieur des terres, augmentant ainsi la salinité de l’eau de rivière et mettant en péril les rizières (Redfern et al., 2015). En outre, l’augmentation du nombre d’inondations et de typhons particulièrement violents affecte
12
directement la production de riz. Ensuite, les champs de riz sont des sources majeures de méthane et d’oxyde nitreux, responsables de 25% du bilan d’émission de méthane de l’agriculture mondiale (Saunois et al., 2016).
En résumé, il est évident que la culture du riz est mondialement très significative en termes de sécurité alimentaire, ressources en eau, et changement climatique.
Dans ce contexte, des informations complètes, sûres, et fréquentes sur les cultures de riz et leur évolution sont grandement nécessaires pour la sécurité alimentaire nationale, en termes de survenance de risque et de prévisions annuelles de production, qui éventuellement pour la stabilité politique du pays. Par rapport à l’environnement mondial, des informations précises sur la distribution spatiale des champs de riz, sur la gestion des ressources en eau, et sur les émissions de gaz à effet de serre, sont nécessaires pour estimer le rôle de la culture du riz dans le cycle mondial d’eau et de carbone.
1.2. Etat de l’art de l’utilisation de la télédétection pour le suivi du riz
L’utilité de l’imagerie satellite dans le suivi et la cartographie de riz a été démontrée dans plusieurs études à l’aide de différents capteurs de caractéristiques spectrales et résolutions spatiales variées. Les systèmes de télédétection aussi bien dans le domaine de l’optique que dans celui des micro-ondes offrent des moyens pratiques pour la cartographie et le suivi temporel des cultures de riz dans des zones variées du globe.
Les capteurs optiques procurent des données de réflectance multi-temporelles et multi-spectrales sur les cultures, qui peuvent être utilisées pour produire des séries temporelles d’indices de végétation dans le domaine spectral compris entre 0,4 et 2,5 μm. Le spectre de réflectance d’un couvert de riz est la résultante d’une relation complexe entre ses attributs biophysiques et biochimiques. Les capteurs les plus utilisés pour estimer la capacité des instruments de télédétection optique à détecter le riz comprennent Landsat, SPOT-VGT, MODIS, etc. (Xiao et al., 2005, Nguyen et al., 2012, Son et al.,2013, Clauss et al., 2018, Singha et al., 2017). Cependant, la couverture nuageuse est présente plus de 70% du temps dans la plupart des zones de culture de riz des régions tropicales (Nelson et al., 2014), et limite l’utilisation de données optiques à haute résolution spatiale (i.e. de l’ordre de 10-30m). Par ailleurs, les données de résolution spatiale plus grossière (i.e. de l’ordre de 500-1000m) mais de résolution temporelle plus élevée sont moins adaptées au suivi de cultures de riz à l’échelle locale pour laquelle les champs ne sont pas uniformes et ont habituellement une taille de l’ordre de 1 hectare ou moins (Bellon et al., 2017).
13
Les technologies de télédétection micro-onde ont l’avantage de fonctionner quelles que soient les conditions météorologiques, et les Radars à Synthèse d’Ouverture (RSO, ou Synthetic Aperture Radars – SARs) peuvent fournir des données à haute résolution spatiale. Des études sur le suivi des champs de riz utilisant ces systèmes RSO ont été réalisées depuis la fin des années 80. Ces études ont été menées dans le but d’estimer le potentiel des systèmes RSO opérant à différentes bandes de fréquence dans le suivi des cultures de riz, dont la bande L (Wang et al., 2009), la bande C (Le Toan et al., 1997, Bouvet et al., 2009, Lam-Dao et al., 2009, Bouvet et al., 2011, Fan et al., 2011, Nguyen et al., 2015, Nguyen et al., 2016), et la bande X (Lopez-Sanchez et al., 2011, Fan et al., 2011, Inoue and Sakaiya 2014a). Dans une étude exhaustive menée par Inoue et al. (2002) utilisant des données expérimentales de terrain, les relations entre les paramètres biophysiques du riz et la rétrodiffusion radar à différentes fréquences (Ka-, Ku-, X-, C-, L-), polarisations et angles d’incidence, ont été analysées.
Cependant, ces études de démonstration n’ont pas encore mené à des applications concrètes. L’un des principaux obstacles à cet objectif est le manque de données RSO acquises de manière systématique, à haute résolution spatiale, et bon marché. Selon les différentes études réalisées, le suivi des cultures de riz par télédétection requiert des données possédant une résolution spatiale de l’ordre de 10 à 30m, et une résolution temporelle de l’ordre de 10 jours. Avec le lancement des satellites Copernicus Sentinel-1 en 2014 (Sentinel-1A) et 2016 (Sentinel-1B), ces données nécessaires, acquises systématiquement et sur l’ensemble du globe tous les 12 (ou 6) jours, accessibles gratuitement par tous, sont aujourd’hui une réalité.
La cartographie de l’étendue des zones de riz via l’utilisation de données SAR a été largement démontrée. Dans de nombreuses études, des champs de riz ont été identifiés par leur faible rétrodiffusion en début de saison quand les champs sont inondés (Shao et al., 2001, Nelson et al., 2014, Nguyen et al.,2016; Torbick et al., 2017). Cette méthode n’est plus adaptée aux champs de riz utilisant de nouvelles pratiques de plantation consistant à semer directement sur du sol mouillé. Le Toan et al. (1997) a observé que l’identification de champs de riz ne peut pas être réalisée correctement en utilisant les méthodes de classification classiques basées sur une supposée similarité de la rétrodiffusion des champs de riz. Des méthodes basées sur la mesure du changement temporel ont été développées pour la cartographie des rizières ; elles utilisent la variation temporelle (plutôt que la valeur absolue à une date donnée) du signal SAR afin de s'affranchir de l'effet des différences de rétrodiffusion d'un champ à l'autre, à partir d'images issues de ERS-2, RADARSAT-1, et
14
ENVISAT/ASAR (Le Toan et al., 1997, Chen et al., 2006, Liew et al., 1998, Ribbes et al., 1999, Bouvet et al., 2011). Les caractéristiques de polarization des champs de riz, dues aux structures verticale des plants de riz pendant le stade végétatif, ont été exploitées via l'utilisation de rapports de polarization (par exemple HH et VV avec ENVISAT/ASAR) (Wang et al., 2005, Bouvet et al., 2009, Lam Dao et al., 2009, Lopez-Sanchez et al., 2010). D'autres exemples d'utilisation de variation temporelle et polarimétrique des champs de riz ont été proposés, utilisant par exemple un classificateur multi-temporel basé sur la distribution de Wishart appliqué à des données ENVISAT-ASAR APS, ou une utilisation combinée de décomposition d'entropie et de machine à vecteurs de support (EDSVM) à partir de données RADARSAT-1 (Tan et al., 2011) (comme décrit dans les revues de Kuenzer et al., 2013 et Mosleh et al., 2015).
Des efforts de recherche ont été dirigés vers la détection des stades de croissance du riz. Ces travaux ont utilisé des données RSO multi-temporelles en bande C des instruments ERS, RADARSAT-1 ou ASAR (Inoue et al., 2014, Chakraborty et al., 1997, Inoue et al., 2002, Boschetti et al., 2009). La détection du début de saison (DdS), qui correspond à la date de semis ou de repiquage, a été présentée dans plusieurs études, soit comme une simple étape du processus de cartographie des rizières (Inoue, Sakaiya and Wang, 2014a), soit comme un produit à part entière (Liew et al., 1998). D'autres études utilisent le RSO polarimétrique pour détecter les stades phénologiques. Ces études reposent sur le fait que la structure de la plante de riz change à chaque stade phénologique, ce qui cause des changements dans la "signature polarimétrique" des champs de riz. Ces études ont été conduites par Lopez-Sanchez et al., (2012) et par Inoue et al., (2014) en bande X et bande C à partir de COSMO-Skymed et RADARSAT-2 respectivement. Par la suite, les méthodes proposées par Vicente-Guijalba et al., (2014), De Bernardis et al., (2015), Nr et al., (2017), and Kucuk et al., (2016) ont amélioré les algorithmes d'estimation des stades phénologiques à l'aide de méthodes avancées telles que les filtres de Kalman, les filtres à particule, et les machines à vecteurs de support.
En ce qui concerne l'estimation de la production de riz, dans la plupart des cas, des données de rendement obtenues lors d'enquêtes de terrain après la récolte sont combinées avec les surfaces plantées en riz détectées par la télédétection pour fournir la production de riz (Shao et al., 2001, Ferencz et al., 2004). D'autres approches sont basées sur des relations empiriques entre des données temporelles de rétrodiffusion et le rendement final pour étendre l'estimation de rendement sur de grandes régions (Prasad et al., 2006, Bolton et al., 2013, Koide et al., 2013, Maki et al., 2017). Malgré des résultats encourageants (94% de
15
précision dans la prédiction), ces approches sont difficilement généralisables et n'ont pas de capacités prédictives. Les modèles agro-météorologiques de prédiction de rendement sont des outils importants pour comprendre l'impact du climat, du soil, des caractéristiques des plantes, et des pratiques culturales sur le rendement final. Parmi ces modèles de rendement de riz, le plus important est ORYZA2000 (Bouman et al., 2001), différentes versions ayant été proposées ensuite dans la littérature (Li et al., 2017). Le modèle considère les facteurs qui impactent le taux de croissance, comme le rayons solaire, la température, et les caractéristiques du cultivar qui pilotent le développement phénologique et morphologique des plantes. Jusqu'à récemment, l'utilisation de la télédétection dans le modèle a été effectué au travers de la surface foliaire (Leaf Area Index), dérivé principalement de données MODIS (Doraiswamy et al., 2005). Les données SAR ont été utilisées pour la localisation des pixels de riz, et dans un article récent (Setiyono et al., 2018), pour estimer la date de Début de Saison utilisée comme entrée du modèle ORYZA.
Concernant l'estimation des émissions de méthane des rizières, dans les deux dernières décennies, de nombreux modèles empiriques et physiques ont été développés pour prédire les émissions de gaz à effet de serre par les rizières. Dans certains modèles empiriques, les relations de régression entre le taux d'émission de CH4 et la biomasse, ou le
rendement du riz, ont été utilisés pour estimer la production de CH4 (Sinha et al., 1995; Kern
et al., 1997; Anastasi et al., 1992). Bien que ces relations empiriques soient faciles à utiliser, l'exactitude et la précision des estimations ne peuvent être assurés, et la variation des émissions à l'échelle régionale n'a pas pu être expliquée de manière raisonnable. Les principaux modèles capables de simuler la production de CH4 incluent MEM (Cao et al., 1995a), MERES (Matthews et al., 2000), InfoCrop (Aggarwal et al., 2004), et DNDC (Li et al., 1992a). Parmi les modèles candidats, DNDC a été testé sur les rizières en Chine et dans d'autres pays d'Asie (Fumoto et al., 2008, 2010; Kai et al., 2010; Zhang et al., 2011; Katayanagi et al., 2017). En tant que modèle bio-géochimique basé sur des processus, DNDC est capable de simuler les cycles du carbone (C) et de l'azote (N) dans les agro-écosysèmes déterminés par les facteurs environnementaux et les pratiques de gestion. Des simulations ont été conduites sur des champs expérimentaux et les résultats ont été comparés à des mesures in situ d'émissions de méthane (Salas et al., 2010; Torbick, Salas, et al., 2017). L'extension à des émissions à l'échelle régionale a été faite en assignat les mêmes taux d'émissions aux champs de riz identifiés dans la région à partir de la télédétection.
L'estimation et la prédiction de la production de riz et l'estimation des émissions de méthane nécessitent de continuer la recherche sur l'utilisation effective des données de télédétection
16
comme entrées ou données de validation dans les modèles de prédiction de rendement de riz et d'émissions de méthane.
1.3. Objectifs de recherche et structure du manuscrit
Ce travail de thèse a pour objectif l’utilisation de séries temporelles RSO de Sentinel-1 pour la cartographie et le suivi de rizières. De plus, cette thèse vise à évaluer l’apport des résultats de cartographie et de suivi de la culture du riz à partir des données RSO comme données d’entrée pour la calibration de modèles de rendement et d’émission de méthane. Les travaux menés ont principalement consisté à développer et tester des méthodes d’identification des rizières et de suivi du développement du riz dans différents contextes ainsi qu’à la compréhension de la variabilité temporelle de la rétrodiffusion radar en lien avec ces questions. Plutôt qu’une approche de calibration ardue ou de collecte de données sur des terrains très étendus, qui permettraient de générer des cartes complètement exhaustives de rizières mais à un coût très élevé, ces travaux visent la recherche d’alternatives simples, robustes, reproductibles et applicables sur de larges étendues à moindre coût et moyennant des relevés de terrain limités. L’objectif sous-jacent consiste donc à évaluer l’apport de données RSO pour des applications opérationnelles de cartographie des rizières pour une large diversité de contextes, apport que l’on suppose déjà très pertinent étant donnée notamment la disponibilité croissante de données RSO multi-temporelles. La thèse présentée dans ce manuscrit constitue une contribution très attendue en télédétection appliquée au maintien de la sécurité alimentaire. Elle présente en effet une méthode robuste et précise pour la cartographie des rizières dans différents contextes de production représentatifs de la diversité des systèmes de production rizicoles d’Asie.
Le manuscrit est organisé en huit chapitres, qui incluent une introduction et une conclusion générale. L’importance et les enjeux relatifs à la culture du riz en termes de sécurité alimentaire, d’émissions de méthane et d’utilisation des ressources en eau ont été présentés dans ce chapitre, afin d’identifier les attentes relatives à l’observation des surfaces de production du riz et de leurs émissions de méthane. Il présente aussi un état de l’art concernant les méthodes de télédétection permettant la cartographie et le suivi des rizières ainsi que leurs applications.
Ensuite le chapitre 2 établit une vue d’ensemble des connaissances et questions relatives à la culture du riz dans le monde. Il couvre notamment ses aspects socio-économiques, agronomiques et environnementaux, avec une attention particulière portée à
17
la question des émissions de méthane, et rappelle les différents stades du cycle de croissance du riz.
Le chapitre 3 présente alors le site d’étude qui a été sélectionné et le jeu de données qui a été utilisé au cours de cette thèse. Dans une première sous-partie, les caractéristiques générales du site d’étude et de l’approche expérimentale sont données. Dans une seconde sous-partie, le jeu de données de télédétection disponible et utilisé dans la suite des travaux est décrit ainsi que la chaine de pré-traitement qui a été implémentée.
Le chapitre 4 rapporte tout d’abord une analyse de données RSO comme proxy de l’état de la surface puis une interprétation physique de la variabilité temporelle ainsi que de polarisation du signal rétrodiffusé par les rizières. Dans une dernière partie, ce chapitre présente une méthode pour le calcul de différents paramètres destinés à la cartographie et le suivi des parcelles en riz. Sur la base de ces résultats, le chapitre 5 décrit les méthodes développées permettant la cartographie des surfaces en riz, des variétés de riz, de la densité du couvert, ainsi que l’extraction de certains paramètres (dates de semis, stades phénologiques, hauteur du couvert).
L’obtention de ces produits est présentée par le chapitre 6 ainsi que leur validation et l’estimation de leur précision. Puis le chapitre 7 décrit les différentes applications à partir des produits de suivi du riz. Deux modèles agronomiques de croissance du riz ont notamment été utilisés au cours de la thèse pour estimer les rendements en riz et les émissions de méthane. Dans ce but, les produits cartographiques générés par télédétection ont été utilisés directement comme paramètres d’entrée de ces modèles. Ce chapitre s’achève par une discussion et conclusion concernant les futurs développements qui permettront d’améliorer les performances de modélisation.
Enfin, le chapitre 8 de conclusion générale résume et discute les principaux résultats de la thèse et propose des perspectives de recherche qui mériteront d’être poursuivies.
19
Chapter 2
Rice in the world
Contents
2.1 Introduction ... 19 2.2 Cultural practices ... 20 2.3 Rice growth cycle ... 23 2.4 Rice productivity ... 25 2.5 Global emissions from rice fields ... 26 2.6 Summary on Earth observation requirements for rice monitoring ... 28
This chapter gives an overview of the rice in the world including rice cultural practices, rice ecosystems and its growing cycle, rice productivity and methane emissions from rice cultivation. The information of rice growing system in the world is important to determine the needs and requirements for rice mapping and monitoring using Earth observation data.
2.1. Introduction
As described in the first chapter, rice is the world’s most important food crop. It is harvested from over 166 million ha in more than 100 countries (Laborte et al., 2017). Rice is grown in diverse cropping systems and various environmental conditions. These can go from single crop systems with both rainfed and irrigated in temperate and tropical climates, to multiple crop systems (2 or 3 crops annually) in tropical irrigated areas where rice is intensely cultivated.
Statistics exist and can be used to derive information on the rice area and production by region and country globally (e.g., FAOSTAT, USDA). However, for some countries, the