HAL Id: hal-02168086
https://hal-mines-paristech.archives-ouvertes.fr/hal-02168086
Submitted on 28 Jun 2019HAL is a multi-disciplinary open access archive for the deposit and dissemination of sci-entific research documents, whether they are pub-lished or not. The documents may come from teaching and research institutions in France or abroad, or from public or private research centers.
L’archive ouverte pluridisciplinaire HAL, est destinée au dépôt et à la diffusion de documents scientifiques de niveau recherche, publiés ou non, émanant des établissements d’enseignement et de recherche français ou étrangers, des laboratoires publics ou privés.
Creating value from data in an ecosystem: building and
expanding relationships between data and seemingly
distant usages
Raphaëlle Barbier, Benoit Weil, Pascal Le Masson
To cite this version:
Raphaëlle Barbier, Benoit Weil, Pascal Le Masson. Creating value from data in an ecosystem: building and expanding relationships between data and seemingly distant usages. R&D Management 2019, Jun 2019, Palaiseau, France. �hal-02168086�
Creating value from data in an ecosystem: building and expanding
relationships between data and seemingly distant usages
Raphaëlle BARBIER
MINES ParisTech – PSL University [email protected]
Benoit WEIL
MINES ParisTech – PSL University [email protected]
Pascal LE MASSON
MINES ParisTech – PSL University [email protected]
Abstract
Creating socio-economic value from data seems to be a shared concern in almost every industry, public and research area. In this paper, “value” is taken in a large meaning considering that creating value boils down to connecting data and usages. In the Earth Observation field, this concern is all the more challenging as data and usages often seem to be “distant” – that is not related at first sight. This paper explores the question of how to build relationships in such a context and how these relationships can evolve over time. Our analysis is based on the historical case study of a research lab that has progressively build services for solar energy. The importance of several elements is enhanced: (1) a new interpretation of the role of “information” in the value creation process, as playing a pivotal role between usages and data, which is thus proposed to be coined “inter-formation”; (2) the importance of how models are designed, suggesting a new way of gaining a competitive advantage that is not only focused on the nature of data or final usages, but on the structure of models; (3) the related expansion dynamic of the ecosystem, suggesting a specific form of expansion that is related to all the elements of the data-usage relationship, and not only thanks to data pushing for new usages or usages pushing for new data. These findings contribute to bring some insights on the creation and expansion of data-based ecosystems, at both organization and ecosystem’s levels.
I.
Introduction
In recent years, the development of internet, new sensors, and computational means has dramatically increased the flow of data in almost every business, industry and research area. This phenomenon, commonly referred as “big data”, has largely been discussed in the literature, shedding light on its definition, opportunities and challenges, especially the issue of how value can be created out of this new flow of data (Günther et al. 2017; Philip Chen et Zhang 2014; Gandomi et Haider 2015; Sheng, Amankwah-Amoah, et Wang 2017).
In this paper, we would like to bring new insights on value creation process in an ecosystem by delving into the evolution of a traditional scientific discipline - Earth Observation - that has also been affected by this “big data” phenomenon. Earth Observation (EO) refers to the gathering of information about planet Earth’s physical, chemical and biological systems (for example ocean currents, solar radiation reaching the ground, composition of the atmosphere, characterization of vegetation). Different kinds of instruments are currently used for this purpose: in-situ sensors (for example floating buoys to monitor ocean currents, temperature and salinity; or land stations that record air quality and rainwater trends), airborne sensors, or satellites. In recent years, with the development of remote-sensing satellites and increasingly high-tech “in-situ” instruments, Earth observation has become more and more sophisticated and has generated an increasing amount of data, leading to concerns about a “Big Earth Data” phenomenon (Guo 2017). Therefore concerns about handling new flows of data are raised, but also about their usages. Indeed, the European Union has significantly invested to make this scientific data a common good, freely accessible to all potential users and is now pushing for the development of new socio-economic applications that would not only benefit Earth observation scientific community but also public authorities, private companies, industry, universities, citizens. This context seems particularly interesting to study how the value creation process of data seems to be closely linked to the development of a rich ecosystem involving heterogeneous communities.
In the Earth Observation field, several issues seem to hinder the development and new usages for EO data. First, the final user is often different from the data owner and might even not be aware that satellite data can be helpful for its own activities because of the complexity of this type of data. Second, for the people in charge of processing satellite data, usually resulting in a first usage, it seems difficult to have an idea of how this first usage might be further expanded towards new usages in the future. Hence this type of situation seems to be characterized by a very large the distance between data and usages and is calling for specific approaches to cope with this distance. This large distance will help us to examine more closely the role of hidden elements in literature, especially how models are designed, and also rediscuss the role of ubiquitous elements, namely “information” usually seen as an intermediate step between data and usage.
Leveraging on this specific context, the paper aims at bringing a fresh look on the value creation process in an ecosystem. More specifically, the following elements will be enhanced: (1) a new interpretation of the role of “information” in the value creation process, as
(2) the importance of how models are designed, suggesting a new way of gaining a competitive advantage that is not only focused on the nature of data sources or final usages, but on the structure of models;
(3) the related expansion dynamic of the ecosystem, suggesting a specific form of expansion that is related to all the elements of the data-usage relationship.
II. Literature review
1. Value creation as a shared issue
Literature seems to agree on the important consequences of “big data” in all scientific, industrial and business areas, stemming from its specificities (Günther et al. 2017; Philip Chen et Zhang 2014; Gandomi et Haider 2015; Sheng, Amankwah-Amoah, et Wang 2017). These specificities have been characterized with 3Vs dimensions (Chen, Chiang, et Storey 2012):
volume (referring to the huge amount of collected data, often reported in several terabytes
or petabytes), velocity (referring to the continuous stream of data received and the speed at which it should be analysed ), variety (referring to the heterogeneous sources of datasets). (Gandomi et Haider 2015) mention the use of other dimensions to describe big data, such as
veracity (importance of using reliable data and interpretations), or variability (continuous
stream of data and that requires to take into account continuous changes in data sets). In the academic field, a wide range of disciplines has discussed the consequences of this big data phenomenon, especially Management and Information Systems (Del Vecchio et al. 2018). Research agendas in these disciplines have particularly highlighted the crucial issue of better understanding the process of value creation from this new flow of data. In Management research, (George, Haas, et Pentland 2014) call for a better understanding “how ubiquitous data can generate new sources of value”, and how this value is distributed among the different stakeholders (companies, industries, governments) thanks to new business models and governance tools. In Information Systems research, (Abbasi, Sarker, et Chiang 2016) reports on the effect of big data on the traditional value chain leading to a specific “Big Data Information Value chain”.
Regarding the concept of “data value”, as exposed by (Furtado, Dutra, et Macedo 2017), different meanings can be found in literature. A distinction is often made between social and commercial or economic value (Chandy, Hassan, et Mukherji 2017; Günther et al. 2017), thus referring to the nature of benefits coming from the use of data. (Günther et al. 2017) define economic value as related to “the organization’s increase in profit, business growth, and competitive advantage resulting from big data adoption”, often resulting in monetary profits. For the same authors, social value refers to an improvement of social wellbeing and societal topics (in various fields such as healthcare, public safety and security, employment growth). In the following paper, we will take a more general meaning of “value” without referring to a specific type of benefits. We will consider that there is “value” when the use of data brings
benefits to the data user. The process of creating value from data can therefore be described
as building relationships between data and these specific usages where the user benefits from
the use of data. The question of value creation thus leads us to investigate how this data-usage relationship is built.
2. Two different approaches to build the data-usage relationship
In literature, two main types of situations are commonly reported. In the first type, the starting point is the access to new data and the objective is to find usages that embed value for the user. In the second type, the starting point is a target usage and the objective is to get data to generate it.
From data to usage
This scenario seems to be more frequently described in literature. The organization that has collected new data can use it to support its existing activities, such as supply chain management (Hazen et al. 2014), marketing activities (Fan, Lau, et Zhao 2015), New Product Development processes by reducing time to market and costs and improving customers’ product adoption (Tan et Zhan 2017; Johnson, Friend, et Lee 2017). In the previous cases, data is used as a new source of information that brings useful insights about the existing processes (for example monitoring the efficiency of a production line) or about customers (for example needs and behaviors), thus helping to improve decision-making processes products and services delivered to customers. This approach is coined “inbound approach” by as the organization directly uses the gathered data to enhance its activities.
(Trabucchi et al. 2018) highlight the existence of a different approach coined “outbound strategy” where the collected data is sold to external parties who can see in them a greater value. The authors take the example of Strava application allowing users to track their sport activities and get useful information such as average speed, performance stats and so on. Strava sold data aggregated from all runners and bikers’ activities to departments of Transportation. These data sets allowed the latter to better plan the construction of future bike lanes by identifying where they were the most needed. In this situation, the organization benefiting from the data usage is different from the one collecting data
From usage to data
As mentioned above, recent research has shed light on a second type of situation where the starting point is a target usage and the objective is to find data allowing to create it (Trabucchi et Buganza 2019). Several case studies are reported in this paper. One of them is exposed here as an illustrative example. Sage Bionetworks is a not-for-profit organization that partners with researchers, patients and healthcare stakeholders to drive data-driven projects contributing to health improvement. In of its projects, the organization aimed at finding new ways of managing symptoms of Parkinson’s disease and had to find a way to collect data on symptoms and their evolution. To do so, Sage Bionetworks launched mPower app, that could be used by people affected or not by the disease. Through this app and additional surveys, the organization was able to analyze different tasks based on the sensors embedded in the smartphone (camera, touchscreen and microphone), and therefore to analyze and monitor the symptoms over time. In this example, in order to bridge the gap between usage and data, is worth noticing that the organization had to design a whole process, including choosing instruments (smartphones and surveys) adapted to the measurements to be made (movement disorder), technical solutions to support data collection and distribution to researchers, and need for technical validity of these data (Bot et al. 2016). Based on this example, in order to better understand how the data-usage relationship is built, it seems crucial to examine how this process is handled in practice.
3. How the process of building data-usage relationship is handled in practice
Two complementary aspects can be found in literature. First, some authors propose frameworks detailing the different stages of the process to build a data-usage relationship. Second, given its specific features mentioned earlier (3Vs or 5Vs dimensions), handling big data and transforming it into value seems to require specific enabling factors, regarding techniques, skills and organizational aspects (Akter et al. 2016; Philip Chen et Zhang 2014; Troilo, De Luca, et Guenzi 2017).
Some frameworks are proposed in literature to clarify the important stages of building the data-usage relationship. In these processes, it seems that there is an intermediate step between data and its usage, which is the “information” or “insights” it gives (Gandomi et Haider 2015; Lim et al. 2018; Abbasi, Sarker, et Chiang 2016). Building the data-usage relationship thus includes building both a data-information relationship and an information-usage relationship.
To manage the process of building data-information-usage relationship, enabling factors are mentioned in literature, due to the specific nature of big data. (De Mauro, Greco, et Grimaldi 2016) defines big data as “the information asset characterized by such a high Volume, Velocity and Variety to require specific technology and analytical methods for its transformation into value.” This definition puts forward the need for a first enabling factor related to specific technologies and methods adapted to big data characteristics. These methods can include a larger number of disciplines, such as statistics, data mining, machine learning, neural networks, social network analysis, optimization methods and visualization approaches (Philip Chen et Zhang 2014; Wang et al. 2016). Specific tools and infrastructures are also needed to process data, for example the platform Hadoop for managing and exploiting large data sets across computer clusters (Philip Chen et Zhang 2014). In addition to technical enabling factors, personal skills mixing knowledge about domain and analytics techniques are highlighted to be important factors (Akter et al. 2016). Finally, organizational factors are mentioned in literature, for example foster collaboration between IT and marketing departments within a firm to foster service innovation (Troilo, De Luca, et Guenzi 2017). Interactions with the ecosystem are often mentioned as important factors (Tan et Zhan 2017; Del Vecchio et al. 2018).
4. Research gaps
If we compare the different situations that are commonly reported in the literature and the specific context of Earth Observation mentioned in the introduced, it seems that notion of “distance” between data and usages has little been taken into account. Indeed, in the examples given above, it is quite easy to understand that there is a link between collected data and final usage (data on consumer behaviors for new services for customers; data on internal processes to improve these processes; or even when a process needs to be built in the example of Sage BioNetworks, it seems apparent that data about the application users is related to the study of symptoms of these individuals). So in this type of situation, there is at least an apparent link between data and usage, even if this link remains to be constructed. Whereas in the case of Earth Observation data, in many cases the link is not apparent at first sight (to take an example in the energy sector, the grid operators might not be aware to what
extent and how satellite data could be used for their operations). This distance idea is not completely absent in literature. Recent research has examined how big data could be used to face societal challenges and points out that in several cases new usages have been developed thanks to technologies that were not initially designed for such purposes, for example military satellites for rain forest conservation (Chandy, Hassan, et Mukherji 2017). However, it seems unclear how this distance is taken into account in the overall process of value creation, and what makes possible to expand the initial usage to new ones. Therefore this paper aims at addressing the following questions: how to build a relationship between data and usage when
they seem very distant at first sight? Once a data-usage exists, how to make it evolve overtime?
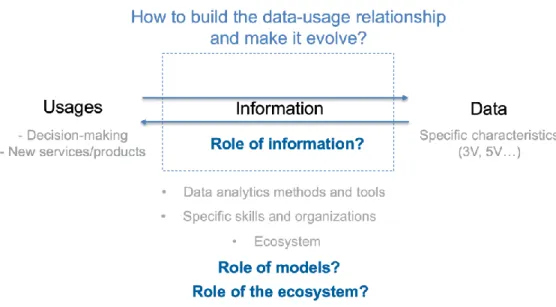
Intuitively, it appears that specific efforts are needed to first clarify the nature of the link between data and usage, therefore questioning the nature of the intermediate information stated in literature and the mathematical models making explicit the link between data and usage. Moreover, as data and usage are likely to belong to very different worlds and communities, it seems that the role of the ecosystem in this value creation process is central. Therefore, a specific focus will be made on these three elements: to build data-usages
relationships, what are the specific roles of information, models and ecosystem in a long-term perspective ?
Figure 1: Summary of literature review (grey) and research questions (blue)
III. Research settings
1. Methodology
Our research work is based on a historical case study in the Earth Observation field. As suggested by (Siggelkow 2007), it is leveraged to rediscuss basic notions, “sharpening existing theory by pointing to gaps and beginning to fill them”. Our case study describes a specific context that does not correspond to the two types of situations mentioned above: the starting point is neither the data nor a target usage. In this case, the organization had both access to new data and a target usage, and had to build a relationship between them. Moreover,
studying a historical case allows us to analyze how this relationship had been built progressively. This case study is analyzed by taking two complementary perspectives.
In a first stage, the organization focused on building the relationship between data and information. Moreover, because of the specific context of having both access to data and target information, the organization only had to focus on one aspect of the relationship: the model linking data and information (that is the mathematical function), and not sustainability aspects or specific processes to put in place as for the example of Sage Bionetworks. Therefore, it appears that this case is particularly adapted to examine the role of designing models, that seems to be overlooked in literature.
In a second stage, the organization had made this model evolved and had also focused on linking information with new usages. For our research questions, this case study helps us to analyse how the relationship data-usage is built overtime, especially showing the impact of the model structure and the role of the ecosystem in the long run.
2. Empirical material
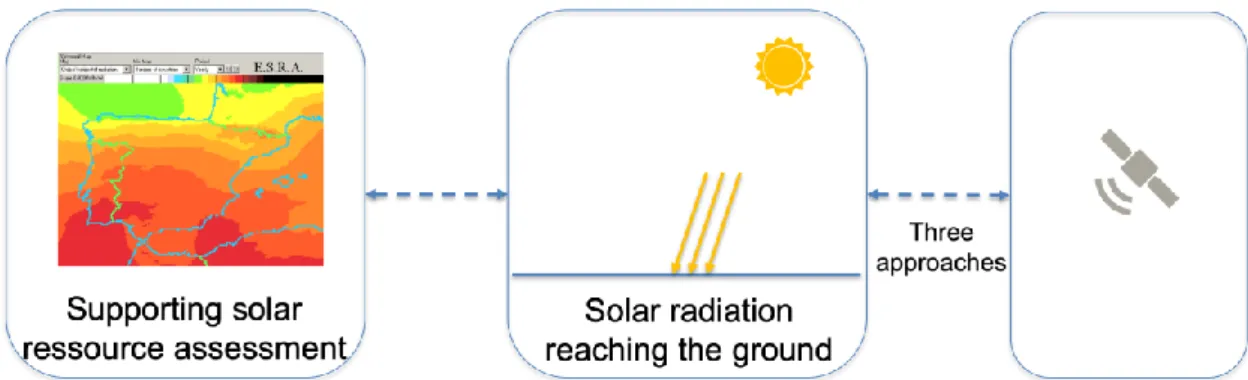
Our case study is based on the history of the research work of a lab based in Sophia-Antipolis, from the 1980s up to now. This lab has been working on solar radiation estimation (information in the previous framework) from satellite data, and the development of services in the solar energy field (usages in the previous framework). Regarding the two perspectives of our analysis:
The first focus is made on the early years of the lab’s research work on solar radiation, when it was involved in a project supported by the European Commission’s Solar Energy R&D Programme. The project aimed at assessing solar radiation more precisely and reliably, especially by integrating new data coming from satellites (whereas at the time solar radiation was mainly derived from networks of “in-situ” solar instruments, that were installed in a limited number of locations). Within this project, three different research institutes developed models in order to link solar radiation estimates and Earth observation data including new satellite data.
The second focus of our analysis examines how the research lab has built and rebuilt over time both the relationship between data and usages, analyzing the evolution of the lab’s research work and the interactions with its ecosystem.
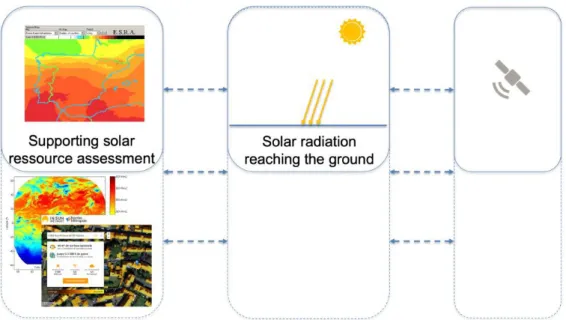
Figure 3: second focus of the analysis - expansion of data-usages relationships
3. Data collection
The first focus on our case study is based on second hand documents, composed of: (1) the final report of the European Commission describing the objectives of the project and the results of the three different approaches to derive solar radiation from satellite data (Grüter et al. 1986); (2) the PhD thesis detailing the specific modelling approach developed by the lab (Cano 1982).
The second focus of our case study is based both on interviews and second-hand documents. Semi-structured interviews (6 hours in total) were conducted with the researcher who had been working on the development of the solar radiations methods from the European project in the 80s to 2018. In addition to the interviews, we used scientific papers published by the lab allowing us to see the evolution of their research work.
IV. Case study analysis
1. First focus: building the model to obtain solar radiation estimates from satellite data
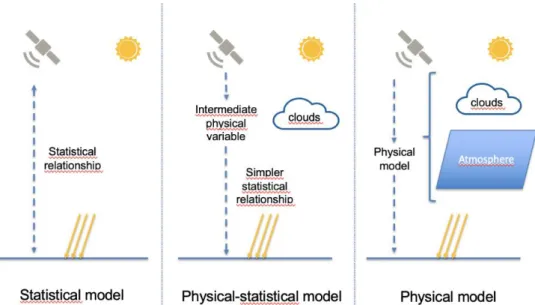
The comparison between the models developed in the 80s by the three different labs for the European project suggests the importance of the model structure. The three approaches can be described as follow:
Physical approach
One lab resorted to a physical approach: the model is based on a “radiative transfer model” that explicitly describes the physical processes (absorption, scattering etc…) occurring in the atmosphere. In this approach, the underlying idea is that satellite data are used to estimate
existing parameters of the physical model. The main advantage of this type of model is first to be understandable (as it relies on physical considerations) and to be more general compared to statistical models as it does not depend on specific areas. However, this approach requires additional sources of data coming from ground stations to estimate some of the parameters, resulting in higher computational times.
Statistical approach
Another lab resorted to a statistical approach: the model is based on statistical regressions between satellite measurements and solar radiation values at the Earth’s surface, measured by “in-situ” stations within the considered area. In this approach, no knowledge about physical phenomena occurring in the atmosphere. This results in relatively simple processing times. However, there is a lack of generality as the regression coefficients are determined for a specific location and have to be tuned in other areas.
Physical-statistical approach
Sophia-Antipolis lab resorted to a combination of the two previous approaches. They introduced an intermediary variable coined “cloud index”, that had a physical meaning as it was describing the level of cloudiness. This intermediary variable was a way of combining the advantages of the two previous approaches:
(1) Understandability and physical-relevancy as it is based on physical considerations to link cloud index to satellite measurement, by modelling part of the radiative transfer terms
(2) Simplicity as the cloud index is then statistically linked to solar radiation with a simple linear relationship. It limits the number of regression parameters compared to fully statistical approaches, and is a way to simplify the physical approach (as parameters that are difficult to model are statistically determined).
Figure 4: Comparison of the three modelling approaches
This physical-statistical approach had proved to be the most efficient one, in terms of quality of the estimation but also easiness of processing (almost ten times quicker than the physical one). Consequently, this method - called Heliosat – was the one adopted by the European
Commission to make the European Solar Radiation Atlas, testifying the success of the approach.
Findings
We are still working on better characterizing the specificities of the approach and the underlying mechanisms that made it as efficient. However we can at least enhance the importance of how models are designed in the value creation process, that seemed to be overlooked in literature. Indeed, this sheds light on another differentiating factor, which is neither related to specific efforts on data sources, nor to efforts on the identification of favorable usages, but to a specific way of designing models.
2. Evolution of data-usage relationship and interaction with the ecosystem
The second focus of our case analysis investigates how the data-usage relationship has evolved overtime and what is the role of the ecosystem in this process. In our case study, the nature of the ecosystem is quite complex as it gathers both the academic community (especially the one working in the Earth Observation field and related application domains), and also private entities and public authorities.
Evolution of the model linking satellite data and solar radiation
Regarding the relationship satellite data – solar radiation estimation, the interactions with the ecosystems seems to have occurred in two ways, from the research lab towards the ecosystem and from the ecosystem towards the research lab. First, how the model was built seems to have influenced the evolution of the ecosystem. Thanks to the mixed physical-statistical approach, the model proved to be efficient but also easily understandable (thanks to the introduction of the intermediate physical variable). As a result, the same model has been adopted by a large number of research organizations that in turn have worked on improving the method, thus contributing to the creation of a community on the same research issues. Second, the ecosystem has played an important role on the evolution of the model linking data and solar radiation. Indeed, Sophia-Antipolis lab has always been modifying their model in order to capture the scientific advances on atmosphere and clouds description thanks to the development of new instrument and computation means, sometime leading to completely rebuild the structure of the method moving to a much more physical approach (notably in 2008 to take advantage of the second generation of Meteosat instruments). To roughly summarize the overall strategy of the lab, it seems that they have always been targeting physical models but resorting to clever tricks whenever it was not possible.
From an initial usage to new usages
Moreover, the initial usage related to the European Commission’s needs has also been expanded. Sophia-Antipolis lab has progressively built web services to make solar radiation information accessible and used by all kinds of communities, outside the EO academic research sphere (for example, farmers, solar energy companies, etc…). The forms of these new usages have evolved over time thanks to the interaction with the users (moving from only solar resource maps to more complex tools indicating variation in time of solar radiation at a specific location,…). A specific business model has been built for these services, based on a freemium approach: free basic solar radiation information at a certain resolution and paid sophisticated services. Furthermore, this process resulted in the creation of new actors in the
ecosystem: in order to make the services operational 24h/24h and 7d/7d, the algorithms and processing chain was transferred to a commercial organization in charge of operating, maintaining and commercializing the services.
Implementation of standards
Finally, Sophia-Antipolis has become part of the Global Earth Observation community that aims at integrating observing systems and sharing data by connecting existing infrastructures. Therefore being part of this community has pushed Sophia-Antipolis lab to implement common standards impacting all the elements of the data-usage relationship. Implementing such standards has largely contributed to make Heliosat methods a reference, especially at the European level, as it is now one of the official provider of solar radiation data for the European Commission.
Findings
This case study seems to suggest that another form of ecosystem expansion can be described. In his situation, the ecosystem expansion is not only due to usage expansion resulting from new data flow, nor only to expansion of data sources resulting from new usages pushing for them. It seems that the ecosystem evolution is intertwined with the progressive evolution of the relationship between data and usages, that occurs on all the intermediary forms and processes of the data-usage chain. Moreover, this analysis further strengthens the role of designing models. In addition of being a strong differentiating factor, it seems that the capacity of redesigning them to take the best of recent advances is a key element for supporting the expansion of the ecosystem and also has an effect on the ecosystem in a retroactive way. Although it is probably not the only factor, the specific structure of the model facilitating its understandability has certainly played a role on its future expansion and the evolution of the lab’s ecosystem.
V. Conclusion and discussion
This paper aims at addressing the question of value creation from data in a ecosystem and the expansion dynamics over time.
1. Theoretical contributions
Based on the specific context of Earth Observation where data and usages appear as distant, the paper raises the question of how to build data-usages relationships and make them evolve. The specific roles of information, models and ecosystem have been more precisely examined, taking into account a long-term perspective.
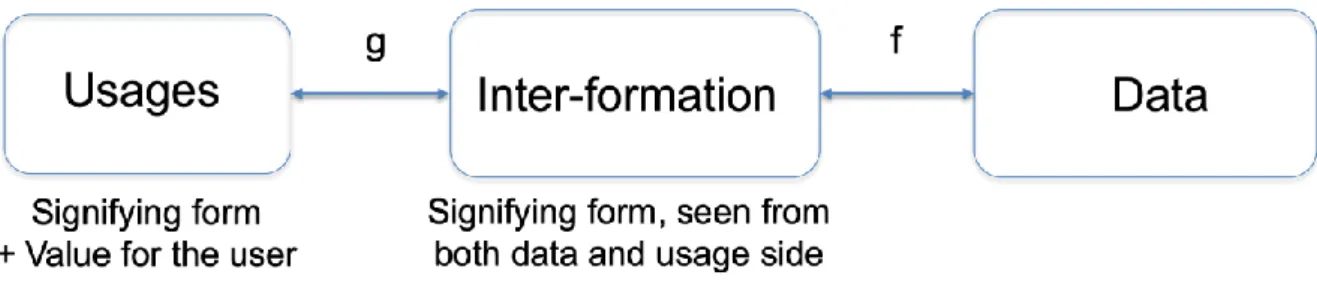
First, a new interpretation of the concept of “information” could be drawn from this case study. In our case study, data and usages appear at first sight as very distant. Therefore, it appears that this information has a significant role to cope with this distance. It could be described as the necessary bridge or pivot between data and usage. Indeed from the user’s point of view, solar radiation enables data to be understandable and manageable (unlike raw satellite data). From data owner’s point of view, solar radiation is the form that allows technologists to understand user needs in a language compatible with modelling language. It is worth noticing that according the French dictionary TLFI, the verb “inform” in an ancient
meaning refers to “give or receive a specific form, a signifying structure to something”. We find that this meaning describes quite well the role of information proposed above, as a “form which is more signifying from both data and usage’s points of view”. We could even talk about “inter-formation” to enhance its role of pivot between data and usage. The framework could be represented as below:
Figure 5: Proposed framework for value creation process
Second, this case study sheds light on the crucial role of designing models in the value creation process. Even when both information and data are given, there is still competition on how the model is designed. It can have both an immediate impact of the efficiency of the method, but also a long-term impact on the evolution of the ecosystem. We believe that these findings could also contribute to the current debate around data science. Indeed, issues concerning best ways of designing models are largely discussed in data-science today: do bigger samples only contribute to a better estimation or also to refine models? If new phenomena become observable, how to build the model enabling to link this new data flow with usages? How to take into account specific domain knowledge in the ways models are built? Our case study could thus give indications on (1) a way of building a model that include specific hypothesis on its possible structure based on a certain domain knowledge; and (2) the consequences on the long-run for the organization building the model and its ecosystem. To investigate this question, our findings still need to be further explored to better characterize the specificities of the physical-statistical approach and better explain the reasons of the successful evolution of this approach.
Third, this research also highlights a specific way of an ecosystem expansion: not only in a “data-push” perspective where data are expected to push for new usages, neither only in a “usage-push” perspective where usage is expected to call for new sources of data, but in both perspectives by progressively building and expanding the data-usage relationship, by playing on all its constitutive elements (data, usage, “inter-formation”, mathematical models, operationalization processes, etc…). To further investigate this question, the different actors of the ecosystem should be more precisely described, especially clarifying on which part of the data-usage relationship they specifically contribute to.
2. Practical contributions
Several practical implications could be discussed at several levels. First, it can be useful for practitioners in science, that are likely to be faced with contexts in which data and usages are not explicitly related to each other (in the case where data are produced thanks to specific instruments for an initial purpose, raising the question of how to explore other usages). Our
case study suggests the importance of considering the importance of how their models are designed. It could also be worth noticing that approaches adopted in other fields or companies where the link between data and usage is clearer (for example the use of big data in marketing activities where the collected data is explicitly linked to the data) are not completely adapted and they should be careful of not making misleading parallels.
Our research work could also give some insights for practitioners in companies. Even in situations where there is an existing usage for data or a usage quite clearly related to data, looking for new distant usages could be an interesting way of differentiating themselves. This would require having people able to design models and also taking into account the long-term effect of how models are designed. Other issues will have to be further addressed: how to design this “inter-formation” in a way that encourage new usages to be developed? How could it be practically managed within the companies’ activities? Methods, infrastructures and specific organizations to support the exploration of these possibilities need to be further investigated.
The latter questions could also be considered at the ecosystem’s level. Each element of our data/inter-formation/usage framework can be supported by different actors. As stated above, these actors still need to be further analyzed, however it can be assumed that many different configurations might exist, involving heterogeneous industry, public authorities, and citizens. Our case study highlights a certain configuration, where for example the idea of solar radiation estimation did not come from the lab itself but from the European Commission’s Solar Energy R&D Programme; or the maintenance and operations were taken up by a third party. In other cases, the lab might itself form the “inter-formation” and still take care of the operations. Investigating these configurations might open up new forms of interactions between science and society.
To conclude, we hope that further research could offer a fresh look on the creation and expansion of data-centered ecosystems, at both organization and ecosystem’s levels.
References
Abbasi, Ahmed, Suprateek Sarker, et Roger H. L. Chiang. 2016. « Big Data Research in Information Systems: Toward an Inclusive Research Agenda ». J. AIS 17: 3. https://doi.org/10.17705/1jais.00423.
Akter, Shahriar, Samuel Fosso Wamba, Angappa Gunasekaran, Rameshwar Dubey, et Stephen J. Childe. 2016. « How to Improve Firm Performance Using Big Data Analytics Capability and Business Strategy Alignment? » International Journal of Production Economics 182 (décembre): 113‑31. https://doi.org/10.1016/j.ijpe.2016.08.018.
Bot, Brian M., Christine Suver, Elias Chaibub Neto, Michael Kellen, Arno Klein, Christopher Bare, Megan Doerr, et al. 2016. « The MPower Study, Parkinson Disease Mobile Data Collected Using ResearchKit ». Scientific Data 3 (1). https://doi.org/10.1038/sdata.2016.11.
Cano, Daniel. 1982. « Etude de l’ennuagement par analyse de séquences d’images de satellite: application à l’évaluation du rayonnement solaire global au sol ». Thèse de docteur-ingénieur, France: Télécom ParisTech.
Chandy, Rajesh, Magda Hassan, et Prokriti Mukherji. 2017. « Big Data for Good: Insights from Emerging Markets*: BIG DATA FOR GOOD ». Journal of Product Innovation
Management 34 (5): 703‑13. https://doi.org/10.1111/jpim.12406.
Chen, Hsinchun, Roger H. L. Chiang, et Veda C. Storey. 2012. « Business Intelligence and Analytics: From Big Data to Big Impact ». MIS Quarterly 36 (4): 1165‑88. https://doi.org/10.2307/41703503.
De Mauro, Andrea, Marco Greco, et Michele Grimaldi. 2016. « A Formal Definition of Big Data Based on Its Essential Features ». Library Review 65 (3): 122‑35. https://doi.org/10.1108/LR-06-2015-0061.
Del Vecchio, Pasquale, Alberto Di Minin, Antonio Messeni Petruzzelli, Umberto Panniello, et Salvatore Pirri. 2018. « Big Data for Open Innovation in SMEs and Large Corporations: Trends, Opportunities, and Challenges ». Creativity and Innovation Management 27 (1): 6‑22. https://doi.org/10.1111/caim.12224.
Fan, Shaokun, Raymond Y.K. Lau, et J. Leon Zhao. 2015. « Demystifying Big Data Analytics for Business Intelligence Through the Lens of Marketing Mix ». Big Data Research 2 (1): 28‑32. https://doi.org/10.1016/j.bdr.2015.02.006.
Furtado, Leonel, Moisés Dutra, et Douglas Macedo. 2017. « Value Creation in Big Data Scenarios: A Literature Survey ». Journal of Industrial Integration and Management 02 (01): 1750002. https://doi.org/10.1142/S2424862217500026.
Gandomi, Amir, et Murtaza Haider. 2015. « Beyond the Hype: Big Data Concepts, Methods, and Analytics ». International Journal of Information Management 35 (2): 137‑44. https://doi.org/10.1016/j.ijinfomgt.2014.10.007.
George, Gerard, Martine R. Haas, et Alex Pentland. 2014. « Big Data and Management ».
Academy of Management Journal 57 (2): 321‑26. https://doi.org/10.5465/amj.2014.4002.
Grüter, W., H. Guillard, W. Möser, J. M. Monget, Willeke Palz, E. Raschke, R. E. Reinhardt, P. Schwarzmann, et L. Wald. 1986. Solar Radiation Data from Satellite Images:
Determination of Solar Radiation at Ground Level from Images of the Earth Transmitted by Meteorological Satellites - An Assessment Study. Solar Energy R&D in
the Ec Series F: Springer Netherlands. https://www.springer.com/la/book/9789027722041.
Günther, Wendy Arianne, Mohammad H. Rezazade Mehrizi, Marleen Huysman, et Frans Feldberg. 2017. « Debating Big Data: A Literature Review on Realizing Value from Big Data ». The Journal of Strategic Information Systems 26 (3): 191‑209. https://doi.org/10.1016/j.jsis.2017.07.003.
Guo, Huadong. 2017. « Big Earth Data: A New Frontier in Earth and Information Sciences ».
Big Earth Data 1 (1‑2): 4‑20. https://doi.org/10.1080/20964471.2017.1403062.
Hazen, Benjamin T., Christopher A. Boone, Jeremy D. Ezell, et L. Allison Jones-Farmer. 2014. « Data quality for data science, predictive analytics, and big data in supply chain management: An introduction to the problem and suggestions for research and applications ». International Journal of Production Economics 154 (août): 72‑80. https://doi.org/10.1016/j.ijpe.2014.04.018.
Johnson, Jeff S., Scott B. Friend, et Hannah S. Lee. 2017. « Big Data Facilitation, Utilization, and Monetization: Exploring the 3Vs in a New Product Development Process: BIG DATA VOLUME, VARIETY, AND VELOCITY ». Journal of Product Innovation Management 34 (5): 640‑58. https://doi.org/10.1111/jpim.12397.
Lim, Chiehyeon, Ki-Hun Kim, Min-Jun Kim, Jun-Yeon Heo, Kwang-Jae Kim, et Paul P. Maglio. 2018. « From Data to Value: A Nine-Factor Framework for Data-Based Value Creation in Information-Intensive Services ». International Journal of Information Management 39 (avril): 121‑35. https://doi.org/10.1016/j.ijinfomgt.2017.12.007.
Philip Chen, C. L., et Chun-Yang Zhang. 2014. « Data-intensive applications, challenges, techniques and technologies: A survey on Big Data ». Information Sciences 275 (août): 314‑47. https://doi.org/10.1016/j.ins.2014.01.015.
Sheng, Jie, Joseph Amankwah-Amoah, et Xiaojun Wang. 2017. « A Multidisciplinary Perspective of Big Data in Management Research ». International Journal of Production
Economics 191 (septembre): 97‑112. https://doi.org/10.1016/j.ijpe.2017.06.006.
Siggelkow, Nicolaj. 2007. « PERSUASION WITH CASE STUDIES ». Academy of Management
Journal, 5.
Tan, Kim Hua, et Yuanzhu Zhan. 2017. « Improving New Product Development Using Big Data: A Case Study of an Electronics Company: A Case Study of an Electronics Company ».
R&D Management 47 (4): 570‑82. https://doi.org/10.1111/radm.12242.
Trabucchi, Daniel, et Tommaso Buganza. 2019. « Data-Driven Innovation: Switching the Perspective on Big Data ». European Journal of Innovation Management 22 (1): 23‑40. https://doi.org/10.1108/EJIM-01-2018-0017.
Trabucchi, Daniel, Tommaso Buganza, Claudio Dell’Era, et Elena Pellizzoni. 2018. « Exploring the Inbound and Outbound Strategies Enabled by User Generated Big Data: Evidence from Leading Smartphone Applications ». Creativity and Innovation Management 27 (1): 42‑55. https://doi.org/10.1111/caim.12241.
Troilo, Gabriele, Luigi M. De Luca, et Paolo Guenzi. 2017. « Linking Data-Rich Environments with Service Innovation in Incumbent Firms: A Conceptual Framework and Research Propositions: SERVICE INNOVATION IN DATA-RICH ENVIRONMENTS ». Journal of
Product Innovation Management 34 (5): 617‑39. https://doi.org/10.1111/jpim.12395.
Wang, Gang, Angappa Gunasekaran, Eric W. T. Ngai, et Thanos Papadopoulos. 2016. « Big data analytics in logistics and supply chain management: Certain investigations for research and applications ». International Journal of Production Economics 176 (juin): 98‑110. https://doi.org/10.1016/j.ijpe.2016.03.014.