HAL Id: hal-02384230
https://hal.archives-ouvertes.fr/hal-02384230
Submitted on 2 Dec 2019
HAL is a multi-disciplinary open access
archive for the deposit and dissemination of
sci-entific research documents, whether they are
pub-lished or not. The documents may come from
teaching and research institutions in France or
abroad, or from public or private research centers.
L’archive ouverte pluridisciplinaire HAL, est
destinée au dépôt et à la diffusion de documents
scientifiques de niveau recherche, publiés ou non,
émanant des établissements d’enseignement et de
recherche français ou étrangers, des laboratoires
publics ou privés.
Micro-scale trigenerative compressed air energy storage
system: Modeling and parametric optimization study
Cheayb Mohamad, Marin Gallego Mylène, Poncet Sébastien, Mohand
Tazerout
To cite this version:
Cheayb Mohamad, Marin Gallego Mylène, Poncet Sébastien, Mohand Tazerout. Micro-scale
trigen-erative compressed air energy storage system: Modeling and parametric optimization study. Journal
of Energy Storage, Elsevier, 2019, �10.1016/j.est.2019.100944�. �hal-02384230�
Contents lists available atScienceDirect
Journal of Energy Storage
journal homepage:www.elsevier.com/locate/estMicro-scale trigenerative compressed air energy storage system: Modeling
and parametric optimization study
Cheayb Mohamad
a,b, Marin Gallego Mylène
a, Poncet Sébastien
b,⁎, Tazerout Mohand
aaCNRS Joint Unit GEPEA, Department of Energy Systems and Environment, IMT Atlantique, Nantes, France bMechanical Engineering Department, Université de Sherbrooke, Sherbrooke, QC, Canada
A R T I C L E I N F O
Keywords:
Compressed air energy storage Trigeneration
Thermodynamic modeling Parametric study Optimization
A B S T R A C T
In this paper, a trigenerative compressed air energy storage system is considered giving priority to the electric energy production with the objective to apply it at a micro-scale, typically a few kW. A whole detailed thermo-dynamic model of the system is developed including the existing technological aspects and the relations between components. The study then focuses on investigating the mutual effects of the design parameters and their in-fluences on the system performances, energy density and heat exchanger footprints via a parametric study. From this analysis, it is found that the temperature of the thermal energy storage, the number of compression stages and the effectiveness of heat exchangers should be selected as a trade-off between the system efficiencies, heat ex-changers footprints and the required number of expansion stages. Meanwhile, the selection of the maximum storage pressure is a choice whether to increase the energy density or the system efficiencies. An optimal design guideline of the above key parameters is then provided. This guideline, the method and the procedure presented in this paper can be applied to the optimization of the trigenerative compressed air energy storage and could be extended for the adiabatic one with minor changes. Based on existing technologies and using an optimal set of parameters, the round trip electrical efficiency of our system remains low at 17%, while the comprehensive ef-ficiency reaches 27.2%. The poor performances are mainly linked to the exergy losses in the throttling valve and the low values of the component efficiencies at a micro-scale. The most optimization potentials are also addressed.
Abbreviations
CAES compressed air energy storage A-CAES adiabatic CAES
T-CAES trigenerative CAES TES thermal energy storage AM compressed air motor HEX heat exchanger
Pinch pinch point temperature difference
η efficiency
COP coefficient of performance
ηg comprehensive efficiency
1. Introduction
Nowadays, electrical energy storage (EES) plays a key role in integrating renewable energy sources as shown in the reviews by Luo et al.[1]and Chen et al.[2]. EES systems enable load-energy bal-ance, meet demand peaks [3] and ensure the flexibility and
reliability of grid operations [4]. Among EES technologies, com-pressed air energy storage CAES is considered a very promising technology. At a large scale, it is a strong alternative to the pumped hydroelectric when nearby mountains are not available [1,5]. In addition, at smaller scales, CAES attracted recently more attention due to their possible benefits[6–10]and their potential applications especially for off-grid sites as demonstrated by the studies of Jannelli et al.[9]and Zafirakis et al.[11].
Until now, only two commercial Compressed Air Energy Storage (CAES) installations have been operated. They have been built to minimize the fuel consumption in conventional gas turbine cycles during high demand periods[12–14]. In fact, in this simple concept of CAES called diabatic (D-CAES), the heat produced during the com-pression phase is wasted leading to moderate efficiencies (42%)[13]. Recently, this technology regained attention with a major improve-ment, namely the use of the heat from the compression process in the expansion phase. This second generation recognized as adiabatic com-pressed air energy storage (A-CAES) could be competitive with others EES as found by the techno-economic study of Abdon et al.[15], thanks
https://doi.org/10.1016/j.est.2019.100944
Received 19 March 2019; Received in revised form 22 July 2019; Accepted 7 September 2019
⁎Corresponding author.
E-mail address:[email protected](P. Sébastien).
Available online 26 September 2019
2352-152X/ © 2019 Elsevier Ltd. All rights reserved.
to its high availability and starting reliability, environmentally benign, long life, low operation and maintenance costs[13,15].
The working principle of A-CAES is as follows: during periods of surplus of renewable energy production or low energy demand, elec-trical energy is used to compress air, which is cooled to increase the energy density. The heat is stored in a thermal energy storage (TES). During periods of high demand, the compressed air is heated by TES and expanded in a turbine to produce the necessary electric energy.
At present, A-CAES has not been built at the utility scale whereas aboveground and underground pilot plants have been tested in China [16]and Switzerland[17,18], respectively. The pilot “TICC-500” de-signed by Wang et al.[16]achieved an efficiency of 22.6% with five compression stages driven by a motor of 350 kW, three expansion stages connected to a generator of 500 kW, air tanks with storage pressure ranging from 2.5 MPa to 9.5 MPa, and pressurized water as thermal energy storage at 108 °C. Geissbühler et al.[17]tested the air storage at a maximum storage pressure of 7 bars in an unused tunnel with different charging/discharging frequency, the calculated round trip efficiency based on variable compression and expansion ratio was within the range [63–74%]. Becattini et al.[18]examined a combined sensible/latent TES formed by Al–Cu–Si alloy and packed bed of rocks with compressed air temperature at 566 °C, and their results showed a high TES efficiency ranging from 77% to 91%.
The research and development on A-CAES have been very active in recent years. Budt et al.[12]carried out a literature review on CAES technologies and classified A-CAES according to the temperature level of TES. Previous researches demonstrated that this temperature level as well as the unavoidable heat at the exhaust of the expansion process have minor effect on system performances. Budt and Wolf [19] de-monstrated that a low level of this temperature (below 200 °C) keeps a
high level of round-trip efficiency and overcomes technological pro-blems related to high-temperature output of compressors. Zhang et al. [20]investigated the effect of thermal energy storage on the efficiency of A-CAES and found that a proportion of heat is left in TES which could be used to improve the efficiency of the system. In response, Zhou et al. [21]studied the effect of recovering the exhaust heat released from the output of the last stage turbine on the system efficiency of conventional CAES and A-CAES. The improvement on A-CAES is not significant be-cause of the low value of the temperature of the exhaust flow.
Recent research investigations put the accent on the influence of the efficiency of turbines and compressors as well as the storage pressure on the system performances. Hartmann et al.[22]proved that the round trip efficiency of polytropic configuration is 10% lower than the isen-tropic configuration at 70%. Grazzini and Milazzo[23]focused on the optimization of the design parameters of heat exchangers dedicated for A-CAES and they proposed in[24]an optimization strategy by using different arrangements of the compressors and expanders from parallel to series according to the pressure of the air reservoir. Mozayeni et al. [25]showed that the storage pressure has a significant effect on the amount of energy stored and found that the round-trip electric effi-ciency increases from 35% to 74% by increasing the effieffi-ciency of the compressors and turbines from 0.65 to 0.95. In agreement with this, Luo et al.[26]developed a detailed model for A-CAES and focused on the system efficiency optimization via a parametric analysis. The main conclusion is that the system efficiency is mainly dominated by the isentropic efficiency of compressors and turbines and the heat transfer rate of heat exchangers. He et al.[27]studied the compression phase with variable pressure ratio and optimized the compression efficiency keeping it above 80% by varying the blade inlet angle and the rota-tional speed. Based on energy and exergy analysis, Szablowski et al.
Nomenclature
T temperature (°C) P pressure (bar) ΔPl pressure losses (bar)
r ideal gas constant (J.K−1.kg−1)
Cp heat capacity (kJ.kg−1.˚C−1)
Nc number of compression stages
Ne number of turbines
n polytropic coefficient
βc compression ratio
βAM expansion ratio of air motor
βe expansion ratio of turbine
W power (kW)
m mass flow rate (kg.s−1)
ɛ heat exchanger effectiveness
ms stored mass (kg)
δ maximum to minimum pressure ratio
V volume (m³)
t time (s)
Nres number of air storage tanks Nu Nusselt number
Ra Rayleigh number
h heat convection coefficient (W.m−2.K−1)
H height (m) d thickness (m) D internal diameter (m) Rth thermal resistance (W−1.m.K) Qs heat stored (kWh) λ thermal conductivity (W.m−1.K−1)
Qr heat recuperated used on preheating of the compressed air (kWh)
Qcool cooling energy (kWh)
Qheat heating energy (kWh)
Qs heat stored (kWh)
UA heat exchanger footprint (W.K−1)
Ed energy density (kWh.m−3)
Subscripts
c compression
e expansion
i compression stage or heat exchanger number i j expansion stage or heat exchanger number j out output in input amb ambient d expansion valve el electrical m mechanical th thermodynamic
th,m thermodynamic to mechanical conversion tt total to total
ts total to static s isentropic 0 stagnation rem remaining
cold,TES cold thermal energy storage h,TES hot thermal energy storage
ch charge
dis discharge
a air
w water
res reservoir
max maximum pressure min minimum pressure
[28] found out, for a large scale system, that the major exergy de-struction occurs in the compressors and turbines, and an important exergy loss is located at the throttling valve relaxing the air from 70 bars to 43 bars. Guo et al.[29]developed a dynamic model of A-CAES operating between 4.2 MPa and 7 MPa taking into consideration part-load operations of compressors and turbines and demonstrated that those components are also the main responsible for the exergy destructions. According to design parameters, the system efficiency obtained by those studies ranged from 52% to 70%.
In order to reduce the system losses, many researchers proposed innovative solutions. Houssainy et al.[30]proposed a patented novel hybrid high temperature thermal energy storage and low temperature A-CAES including a turbocharger unit that provides supplementary mass flow rate which contribute to decrease the storage pressure/vo-lume and reducing the system cost. Kim[31]carried out an energy and exergy analysis of different configurations of CAES with adiabatic or quasi-isothermal compression and expansions, constant volume and constant pressure air storage. The results demonstrated that the con-figuration with constant pressure and isothermal process presents the higher performances. They proposed a patented constant-pressure compressed air energy storage (CAES) system combined with pumped hydro storage[32]. Mazloum et al.[33]proposed an innovative con-stant isobaric A-CAES including multistage adiabatic compression and expansion which achieved a round trip electrical efficiency of 53.6%.
Previously, it has been demonstrated that CAES is adaptable to produce heating and cooling energy[6–10,34,35], hence the trigen-erative compressed air energy storage T-CAES has been introduced. Many configurations have been proposed, which differ according to the manner in which the heat of compression is used. Facci et al.[6], Lv et al.[7], Liu and Wang[8]and Arabkoohsar et al.[34]devoted the heat produced during the charge phase for heating purposes while the electricity and the cooling energy are generated in the discharge phase. On the other hand, Jannelli et al.[9], Li et al.[10]and Han and Guo [35]suggested their configurations on the base of using an amount of heat stored during the expansion to increase the electrical efficiency while keeping the possibility to produce cooling and electrical energy. With regards to experimental setup for T-CAES, Venkataramani et al. [36] constructed an experimental setup composed of a wind turbine (3.2 kW), a scroll compressor and expander and a reservoir (capacity of 400 L and maximum pressure of 8 bars). An investigation has been made on the effect of the discharge mass flow rate on the round trip efficiency, which achieved its best value of 22.02% with the highest mass flowrate. Cheayb et al.[37]used an experimental bench installed at IMT Atlantique, France. The experimental pilot is composed of multi-stage compressor driven by a motor of 3.17 kW, an air re-servoir having a capacity of 300 L and a maximum pressure of 310 bars and an air motor. The model results were found in good agreement with the experimental results with a maximum error of 13.2%. Besides, the two latter studies stressed on the importance of the cogeneration in improving the round trip efficiency of the system.
The studies on T-CAES focused on introducing its concept, demon-strating its adaptability to specific applications and also on the mod-eling and optimization aspects. The proposed systems distinct in terms of their configuration and the choice of design parameters so that the resulted system efficiency was widely different varying from 30% to 76.3%. Facci et al.[6]introduced a configuration with variable com-pression and expansion pressure ratio and proved the compatibility of the system with small size civil applications by means of satisfying peak shaving, heating and cooling demand. They investigated the effect of the design parameters on the efficiencies of the system such as the number of compression and expansion stages, turbines and compressors efficiency, maximum storage and expansion pressures. Values around 30% and 50% respectively were found for electric efficiency and exergy efficiency. Apart from that, Janelli et al.[9]proposed a configuration of 3.17 kW input and 1.25 kW output power with a maximum storage pressure of 35 bars and input expansion pressure of 25 bars and
developed a design methodology of the storage system by applying it on a small scale stand-alone power station with photovoltaic energy pro-duction. The storage system has a round trip electric efficiency equal to 57% with a contribution on satisfying the cooling demand. Minutillo et al.[38]optimized the latter configuration considering it in different climate zones. Their results highlighted that the best performances are achieved by choosing both the lowest average pressure and the highest operating pressure range of the air tank. Liu and Wang[8] demon-strated that the coefficient of performance of the CAES system is im-proved by the cogeneration of heat and cold in the range of 20–30% depending on the values of the expansion ratio, the maximum storage pressure and the polytropic coefficient of the expanders. Lv et al.[7] applied a theoretical thermodynamic model on a T-CAES configuration with variable compression and expansion ratios and a low maximum storage pressure of 15 bars. The system was applied for electrical en-ergy peak load shifting in a hotel. The results showed a high value of efficiency (76.3%) and an annual monetary cost saving of about 53.9%. Li et al.[10]introduced the comprehensive efficiency index to evaluate the T-CAES and investigated a configuration of the system for load shifting and for meeting the cooling and heating demands of an office building. The overall comprehensive efficiency achieved was high in winter months at 50% and lower in summer months at 30%. Ara-bkoohsar et al.[34]demonstrated the potential of this system to sup-port district heating and cooling and reserve services in electricity market for a typical large-scale application. The system was designed with different arrangement (series or parallel) of compressors and ex-panders. The values of power-to power, cooling and power-to-heat efficiencies of this system were 30.6%, 32.3% and 92.4% respec-tively. Han and Guo[35]derived a T-CAES configuration from the A-CAES and focused on optimizing the system by operating the expanders under variable pressure.
Previous optimization studies on the A-CAES and T-CAES identified different optimization opportunities such as varying the number of compression/expansion stages, increasing the effectiveness of heat ex-changers and changing the storage pressure and other parameters stated above. Authors focused on one or more aspects and investigated the potential performance improvement. However, they overlooked or not clearly addressed the relations between the design parameters of the equipment. For instance, when the number of compression stages is changed the number of expansion stages was kept constant and when the water mass flow rate of intercooling heat exchangers HEX is changed (which changes the thermal energy storage temperature) the flow of the preheating HEX is fixed. Another limitation that could be highlighted in some studies when considering a variable pressure ratio is that the thermal energy storage is inadequately correlated to other compounds. This leads to an inaccurate estimation of the efficiency improvement.
In addition, the system was evaluated based on one or many eva-luation criteria separately without taking into account most of them at the same time. As an example, when the round-trip efficiency was concerned the energy density and other parameters reflecting economic criteria were often discounted. Besides for the T-CAES, the technolo-gical aspects and technical constraints were often ignored in the mod-eling and simulation studies. This explains the wide range of choices of simulation parameters and the results found in the literature, mis-leading to have an accurate assessment of the system.
The objective of this study is to derive an optimal design guideline of the trigenerative compressed air energy storage based on an accurate thermodynamic model and parametric optimization, focusing at the same time on all interdependent design parameters of equipment and paying attention to the majority of assessment criteria at once. The contributions and novelties of this paper turn out as follows:
- The developed thermodynamic model accounts for technological and technical issues, pays a particular attention to interrelation between components especially heat exchangers integration as well
as temperature levels of the thermal energy storage tanks. Besides, it appeals to the experimentally validated model of air side compo-nents published by Cheayb et al.[37].
- The parametric optimization focuses on the mutual effect of the design parameters in the case where the choice of one of them is conditional on others. In addition, the optimal number of expan-sions stages is derived and the effect of the thermal of energy storage is quantified for the first time. Indeed, no similar approach could be encountered in the literature.
- The study applies various criteria used to assess the energy storage technologies such as energy density, heat exchanger footprints, round trip electric efficiency and the comprehensive efficiency in the optimization of the T-CAES.
The entire structure is arranged as follows:Section 2presents the methodology. Section 2.1 illustrates the proposed configuration of small-scale T-CAES based on the maximization of its electric efficiency. Sections 2.2and2.3explain the thermodynamic model and the opti-mization procedure. The discussion of the results and the conclusions are carried out inSections 3and4, respectively.
2. Methodology
2.1. System description
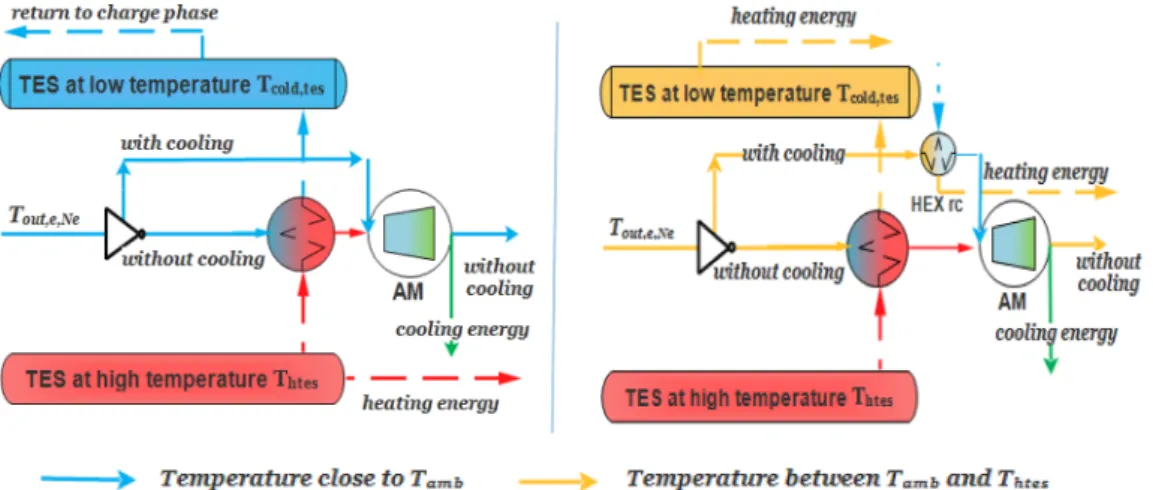
Fig. 1 shows the schematic diagram of the novel trigeneration system proposed in this paper.Fig. 2presents the schematic of the last expansion stage and illustrates the temperature levels of air and heat transfer medium. The proposed concept derives from A-CAES with the difference being it enables producing heating and cooling energy. As well as A-CAES, during the charge phase ambient air is compressed via multistage compressors. The compressed air is cooled after each com-pression stage in a heat exchanger (HEX) by thermal energy storage medium (Fig. 1). Volumetric compressors are the most suitable for small-scale applications of CAES as reported by Cheayb et al.[37]so that they are selected in this study.
Regarding the thermal energy storage medium (TES), this study adopted the approach of low-temperature A-CAES presented by Budt and Wolf[19]where the temperature level of TES is below 200 °C. It is known that phase change material could be used in favor of high energy density and constant storage temperature. However, in order to offer a flexibility in control and reduce the system cost, sensible heat storage is preferred. Among heat transfer medium such as thermal oil [9,10],
water[23]or Therminol 66[35], pressurized water remains adequate for our application because of the low cost, the high thermal capacity and conductivity and being environmental friendly[12,26].
In order to achieve a high energy recuperation rate, the counter-flow heat exchangers remains the best choice. On the other hand, shell and tube HEX exhibit a high design flexibility for different values of heat capacity and mass flowrates, high adaptability to high values of pressure and temperature[39]. By combining the advantages of these two types of HEX, a shell and tube heat exchanger with one shell and tubes pass and counter flow arrangement is chosen in the present study. In the discharge phase, as shown inFig. 1, the air pressure is re-duced by a throttling valve (TV) in order to be compatible with the expansion machinery and to ensure a high energy density of the air stored at constant volume. Existing small scale pilot scale applications rely on volumetric expanders (see[8,37]) .These later are considered as an ideal choice for small-scale CAES because of its low costs and low operational speed rotation[40]. In the other hand, existing volumetric expanders ratios are limited between 8 and 14 for piston expanders and 5 for scroll type as reported by Lemort et al.[41]. However, it is well known that a low expansion ratio lowers the electric efficiency of the system[8, 37], so the expansion machine should be designed to handle high input pressure. Recently, the Deprag company in collaboration with the University of Applied Science Amberg-Weiden (Germany)[42] developed a micro axial turbine which could work with an input pressure going to 25 bars. Thus, the first expansion stages are selected as axial turbines and the last stage as an air piston motor (AM) as an improvement for the previous study of Cheayb et al. [37] (see the discharge phase components inFig. 1).
Since the preheating of air before expansion increases the round-trip efficiency, the heat stored should be exploited at the highest possible level. Consequently, when the cooling energy is needed it can be de-duced from the last stage (seeFigs. 1and2) and the heat is deployed in other stages (Fig. 1). Otherwise, the air is heated before all the ex-pansion stages.
The analysis below highlights the identification of two design ap-proaches, which lead to consider two configurations, as shown inFig. 2: – In the first configuration: the aim is to simplify the design and use the water temperature of cold TES directly in the charge phase so that the cold TES temperature should be as low as possible (close to ambient temperature) (see Fig. 2 left). Consequently, the output temperature of each turbine must be close to the ambient tem-perature and the cooling is achieved by releasing the outlet air of
turbines directly at the input of the air motor. This can be achieved by minimizing the water mass flow rate in the preheating heat ex-changers so that the remaining water in hot TES tank is used directly for heating purposes (further explications can be found inAppendix 2andSection 2.3).
– In the second configuration: the goal is to maximize the system electric efficiency by maximizing the air preheating. The air input temperature should be as high as possible, close to the hot TES temperature. As a result, the output temperature of each expansion stage would be higher than the ambient temperature (see Fig. 2 right), leading to adding a cooling HEX just before the AM (nomi-nated by HEXrc inFig. 2right) to produce cooling energy when needed. This design concept induces a high value of the water temperature at the outlet of the HEX (orange colors inFig. 2right), which is used to satisfy the heating demand. Furthermore, as ex-plained later inSection 2.2.3, there will be no water remaining in the hot-temperature reservoir of TES.
2.2. Thermodynamic model of the T-CAES system
The air-side components model developed by Cheayb et al.[37]– which is validated experimentally – is used. The useful equations of this previous model are summarized inAppendix 3. Some improvements such as pressure losses and the model of heat exchangers HEX, air turbines and TES are added. In this section, only the complementary equations to the previous study[37]are presented below.
The model is based on the following hypotheses: ➢Air is considered as an ideal gas.
➢Pressure losses in the pipes are negligible.
➢It can be noticed from the tables giving the thermal properties of pressurized water that the effect of temperature on the heat capacity may be ignored.
➢Since operating pressure of expansion is much lower than of com-pression phase and pressure losses in HEX are proportional to the operating pressure as shown later inEq. (2), the pressure losses in HEX of discharge phase are neglected compared with the losses in HEX of discharge phase.
➢Since there is no data concerning the variation of the polytropic coefficient of the air motor as a function of its input temperature, it is considered constant at 1.1[37].
➢Since the temperature output of the throttling valve varies with the pressure of the compressed air[37], a dynamic model is needed to account these temperature variations, which is beyond the scope of this study. In order to deal with this issue, it was assumed that the heat exchanger installed after the throttling valve is able to maintain
the temperature input of the first preheating heat exchanger Tin, e, 1 at the ambient temperature. Besides, the associated cooling poten-tial of this heat exchanger is not taken into account.
➢The temperature of the cold TES reservoir in the charge phase is at the ambient temperature. It is basically saying that: in the first configuration, the water at Tcold, TES(which is slowly higher than the ambient temperature) achieved the room temperature just at the beginning of the charge phase by losing its small amount of heat to the environment. In the second configuration, all the heating energy is used so that the temperature of water supply of the cold TES re-servoir is at the room temperature.
2.2.1. Modeling of compressors and air reservoirs
The calculations of temperatures input and output of each stage, the mass flow rate and the thermodynamic model of air stored in the re-servoir are explained in details in the former paper[37]and summed up inAppendix A3. Firstly, the optimal distribution of compression ratio of each stage βc, iis symmetrical[43], so that:
= P P c optimal in res atm N , , 1/c (1) Pressure losses in HEX are included in this paper as an improvement of the previous model [37]. An accurate account of these losses ΔPl depends on the mass flowrate and design parameters of HEX, which is an advanced task. Herein, the approximation formula (2) of ΔPlfor each HEX of intercoolers reported by Jubeh and Najjar[44]and Liu and Wang[8]is used. = = P 0.0083 P P 1 0.0083 1 . l c i c i c i out c i c i c i c optimal i atm , , , , , , , , , (2)
The required output pressure of each compression stage used to compensate the pressure losses ΔPl, c, iis shown inEq. (3)and the actual compression ratio of each stage βc, iis calculated byEq. (4).
= +
Pout c i, , c optimal, i.Patm Pl c i, , (3)
= P P . c i out c i ci atm , 1, , (4)
2.2.2. Modeling of turbines and air motor
Throughout the turbine, the thermodynamic energy of compressed air expressed by its enthalpy is transformed to kinematic energy in the stator, then to mechanical energy by the rotor. It is known that heat transfer is negligible in turbomachinery and the ideal process corre-sponds to an isentropic one, ideal power is written as:
Fig. 2. Schematic diagram of the last expansion stage subsystem (the air motor AM) and temperature levels of streams for the first (left) and the second configuration
= = W m h h m C T P P . ( ) . . . 1 ( ) e ideal e in s out e p a s in e in e out e , 0, 0 , , 0 , , 0, , 0, , 1 / (5) where T0and P0are the stagnation temperature and pressure
respec-tively and the index s refers to isentropic transformation.
Due to irreversibility induced by internal heat, the output tem-perature is actually higher than T0s, out, thus real power is indeed:
= =
We real, m he( 0,in h0,out) m Ce p a, (T0, ,in e T0,out e,) (6) The ratio between the real and ideal work stands for the thermo-dynamic efficiency. However, the exit fluid velocity of the rotor is not at zero and the associated kinematic energy (named exhaust loss) shouldn't be ignored so that the terms total to total efficiency ηttand total to static efficiency ηtshave been employed[45]. The formerEq. (5) does not include the kinematic energy whereas it is considered by the latter.
Owning that the kinematic energy can be converted in the sub-sequent turbine stage or the air motor, ηttis considered in this study, hence: =
(
)
T T T ( ) . 1 ( ) tt in e out e s in e PP 0, , 0, , 0 , , 0,0, ,out ein e, 1 / (7)ηttis classically determined according to the two dimensionless
para-meters flow coefficients and stage load[45], which vary depending on design parameters and operation parameters (pressure ratio and flow rate). Performance curves can be found in text books, nonetheless those curves are developed using experimental tests on common and com-mercialized turbines at medium or large scale[45,46].
In this study, the turbine used is recently developed and it is difficult to account for the performance characteristics. Notwithstanding, a value of 57% for the total to static efficiency is provided by the designer in which the compressed air is the working fluid and the expansion ratio is 10[47]. This value was assumed in this study and considered as constant independently of operating conditions (pressure ratio, flow rate). At the same time, exhaust losses in turbines are estimated at around 3% to 5% of total losses[45], so that ηttwas deducted from ηts, equal to 1.05 ηts.
To conclude, the output temperature and electric power are derived fromEqs. (5)–(7) as follows:
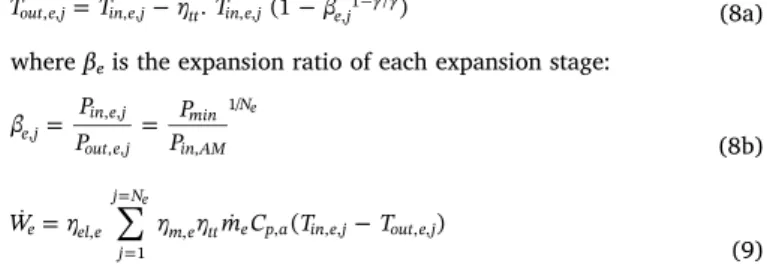
=
Tout e j, , Tin e j, , tt.Tin e j, , (1 e j,1 / ) (8a) where βeis the expansion ratio of each expansion stage:
= P = P P P e j in e j out e j min in AM N , , , , , , 1/e (8b) = = = We el e m C (T T ) j j N m e tt e p a in e j out e j , 1 , , , , , , e (9)
ηm, eis the mechanical conversion efficiency estimated to 95% for small scales turbines, and ηel, eis the electric efficiency of the generator.
For the second configuration, the temperature input of each stage is calculated by:
=
Tin e j, , Th TES dis, , Pinche (10)
The relation between the pinch point temperature difference Pinche and HEX effectiveness is derived inAppendix 1. It is expressed by:
=
Pinche (1 e)(Th TES dis, , Tout e j, , 1) (11) As for the air motor, for more details, the reader can refer to re-ference[37].
It is important to figure out that the number of expansion stages Ne play a key role in the design of T-CAES (note that Ne denotes the number of expansion stages without the air motor because AM was
devoted for cooling purposes). With this intention, let us consider the second configuration: for an imposed value of the temperature of TES, the input temperature of each expansion stage Neis related to Th, TES, disand the effectiveness of HEX (Eqs. (10)and (11)). A lower number of expansion stages Neresults in a decrease of the output temperature and furthermore to decrease the electric efficiency .It can be easily seen that there is a critical number of Ne(called Ne, critical) from which the output temperature of each stage become higher than the ambient tempera-ture.
Taking into account the first configuration, at this value of Ne, critical the input temperature of each expansion stage should be lowered to achieve the design condition ofTout e i, , =Tamb. Increasing Ne beyond
Ncriticalmeans a further decrease of the input temperature of each stage and consequently the electric efficiency. As a conclusion, the optimal number of expansion stagesNe optimal, =Ne crtical, .
It is true that in the second configuration, the electric efficiency may increase if Ne> Ne, crtical. However, it can be noticed from the results of the previous study of Luo et al.[26]that the global electric efficiency ηe increases slightly above a value of Necorresponding to Tout, e, iclose to
Tamb. Moreover, many simulations were carried out and proved the latter achievement. Besides, it is more valuable to compare the two configurations for the same number of stages. The flow diagram of the method used to determine Ne, optimalis presented inFig. 3. It is found by an iteration procedure by increasing the value of Ne, and calculating the output temperature of turbine stages Tout, e, i. The iteration stops as soon as Tout, e, ibecomes higher than Tamb.
Now, Ne, optimaland the temperature input and output of turbines for the second configuration are known. By contrast, in the first config-uration, the temperature input of each stage should satisfy the condi-tion ofTout e j, , =Tamb.As a result, Tin, e, jcould be expressed by using Eqs. (8a) and (8b) as:
= T T 1 . 1 in e j amb tt PP , , 1 / in e j out e j , , , , (12)
2.2.3. Modeling of heat exchangers and TES
Typical input design parameters of HEX are mass flow, heat capacity and outlet temperatures of hot and cold fluids[39]. The number of transfer unit method NTU has been used, which is described subse-quently. Further details and comprehensive information are presented inAppendix 1.
The main design characteristic of HEX is its effectiveness which is generally defined by Eqs. (13a) and (13b).
= C T T C T T
. ( )
( )
hot in hot out hot min in hot in cold
, , , , (13a) or = C T T C T T . ( ) ( )
cold out cold in cold min in hot in cold
, ,
, , (13b)
C is the thermal capacity of the flow, which equals the product of the
mass flow rate of the flow and its heat capacity.
The number of transfer unit NTU is a function of heat exchanger efficiency, flow arrangements, Cmin to Cmax ratio and HEX type (for example number of shell pass and tube passes, cross flow HEX) .NTU approach and relations for different types of HEX are reported in details in[48]. In this study, shell and tube HEX with one shell and tube pass and counter flow arrangements was considered, the corresponding NTU relations are shown in Eqs. (14a) and (14b):
< =
( )
for z z 1 : NTU ln ln(1 ) z 1 . 1 j j (14a) = = for z 1 : NTU 1 j j (14b) = z C C where min maxFollowing the NTU method, the HEX footprint is expressed by:
= UA NTU C
( ) . min (15)
The charge phase is common to both configurations so the same model is used. During the charge phase, once Th, TES, chis imposed, heat balance between air and water sides enables the calculation of water mass flow rate of each HEX as follow:
= + m C T T C T T ( ) ( ) w ch i min in c i in c i p w h TES cold TES
, , , , , , 1
, , , (16)
whereCmin=ma c,.Cp a, andCmax=mw ch i, ,.Cp w, (see annex 1). It should be noted that the maximum value of Th, TESis to be chosen such as Cmin≤ Cmax, thus Th, TESshould satisfy the following condition:
+
+
Th TES, (Tin c i, , Tin c i, , 1) Tcold TES, (17)
The total mass flow of water that can be stored at the temperature
Th, TES is the sum of the flows leaving HEX, the total mass of stored water and the necessary volume of the storage tank are expressed in Eqs. (18)and (19). = = mTES m .t i N w ch i ch 1 , , c (18) = Vres TES mTES
w
,
(19) In the end, the total thermal energy that could be stored could be computed from the air side or water side byEq. (20).
= = = = + = = Q m C T T t m C T T t . . ( ). . . ( ). s i i Nc c p a out c i in c i ch i i Nc
w ch i p w cold TES h TES ch
1
, , , , , 1
1
, , , , ,
(20) During the storage process, it is obvious that the water mass is conserved, but the temperature of TES drops due to heat transfer with the environment. One can account this loss by integrating a model of the TES reservoir. However, it is supposed that the TES tank is suffi-ciently isolated to achieve a high thermal efficiency of 95% with a short storage period (range of hours). The thermal efficiency is defined as:
=m C T T = m C T T T T T T ( ) ( ) TES
TES p w h TES dis amb
TES p w h TES amb
h TES dis amb
h TES amb
, , ,
, ,
, ,
, (21)
The temperature of TES in the discharge phase is calculated by:
= +
Th TES dis, , TES(Th TES, Tamb) Tamb (22)
Heat loss is then:
=
Qloss mTES p wC, (Th TES, Th TES dis, , ) (23)
Next, modifications were included in the model depending on the configuration of the discharge phase.
2.2.3.1. Equations of the discharge phase for the first configuration. In the
discharge phase, for the first configuration the output temperature of water flow Tout, dis, jin HEX is governed by its effectiveness or its pinch point temperature difference Pincheas expressed byEq. (24a), while the mass flow rate is determined by the heat balance between each flow of the HEX (Eq. (24b)).
= +
Tout dis j, , Tout e j, , 1 Pinche (24a)
where the relation between Pincheand the HEX effectiveness is shown inEq. (A1.6). = m C T T C T T ( ( )
w dis j max in e j out e j p w h TES ch out dis j
, , , , , , 1)
, , , , , (24b)
whereCmin=mw dis j, ,.Cp w, and Cmax=ma e,.Cp a, for the first configuration.
By applying the heat and mass balance, the accumulated mass of the outflow water of preheating HEX and its temperature, the remaining mass in high TES temperature tank and also the heating energy po-tential are presented onEqs. (24c)–(24e).
= = + mcold TES m .t i N x w dis j dis , 1 , , e (24c) = = = +
mrem h TES mheating mTES m .t
i N x w dis j dis , , 1 ¯ , , e (24d) where: =x¯ 1if the cooling is activated, otherwisex¯=0.
=
Qheat,1 mrem h TES, , .Cp w, . (Th TES, Tamb) (24e)
2.2.3.2. Equations of the discharge phase for the second configuration. For
the second configuration, one can design the HEX such as the temperature variation in the air side is the same as the water side which decreases the temperature difference between the two sides and the required footprint. In order to minimize this latter, the maximum mass flow rate and the least possible temperature output of water flow should be chosen (seeFig. A2.1). This is achieved by pumping all the water of the hot temperature reservoir to the reservoir at low temperature. Consequently, the water mass flow is determined by applying the mass balance on TES (Eq. (25b)). The heat balance in the HEX enables the calculation of the output water temperature (Eq. (25a)).
=
T T C
C T T
. ( )
out dis j h TES dis e j min
max h TES out e j
, , , , , , , , 1 (25a) = + m m N x t ( ) w dis j TES e dis , , (25b) where: =x 0if the cooling is activated, otherwise =x 1.
=
Cmin ma e,.Cp a, andCmax=mw dis j, ,.Cp w, for the second configura-tion.
Returning to TES, as mentioned above:
•
In the first configuration, an amount of water is remaining in the hot TES tank which is used for heating and the temperature return ofpreheating HEX approaches the ambient temperature.
•
In the second one, the return temperature of TES is sufficiency high to be used for heating purposes and the reservoir at high tempera-ture is fully empty by the end of the discharge phase.= =
mcold TES, mheating mh TES, (25c)
= mrem h TES, , 0 (25d) = + + + Q m C T T x C T T t . . ( ) . ( ).
heat cold TES p w cold TES amb
max Ne out dis Ne amb dis
,2 , , ,
, 1 , , 1 (25e)
where the second term of theEq. (25)accounts for the energy required in order to recool the outlet air of the last turbine stage before it is introduced in the air motor AM to produce cooling energy. This term will be void if the cooling energy is not activated.
It is important to note that mw dis j, , is sufficiently high to verify the design method based on mw dis j, ,.Cp w, ma e,.Cp a, , say:
m C C w dis j min p w , , , (26)
2.2.3.3. Equations of the cold TES for the first and second configurations. The
temperature Tcold, TESof the returning water can be calculated by applying energy balance as shown inEq. (27).
= = + T m T m t cold TES i N x
w dis j out dis j cold TES dis
, 1 , , , , , e (27) In the end, the thermal energy recuperated to preheat the air before expansion can be computed from the air side or water side byEq. (28) and cooling energy is deduced byEq. (29).
= = = = + = = + Q m C T T t m C T T t . . ( ). . . ( ). r i i Ne x e p a out e j in e j dis i i Ne x
w dis j p w h TES out dis j dis
1 ¯ , , , 1 , , 1 ¯ , , , , , , (28) where Tout, e, 0is the temperature input of the first HEX.
=
Qcool x m C¯. e. p a,. (Tamb Tout AM, ).tdis (29)
where: =x¯ 1if the cooling is activated, otherwisex¯=0.
2.3. Parametric study for the optimization of the T-CAES
The optimization of energy systems can be conducted by using thermo-economic analysis, multi-objective optimization or parametric study[49]. However, our system is recently proposed and the analysis via parametric study figures out the key drivers for the optimization of the performances of the T-CAES. This analysis starts by identifying the design parameters and dissect their effect on the performances of the system. In this section, the relevant parameters were retained from the thermodynamic model to reveal their impact on the evaluation criteria described below inSection 2.4.
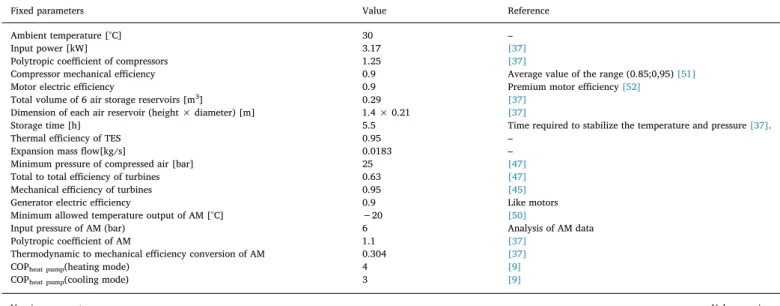
Table 1lists the base values of the fixed parameters used in our study. Herein, firstly, input power scale and reservoir volumes correspond to a small scale unit in accordance with Jannelli et al.[9]and the experi-mental pilot used by Cheayb et al.[37]. Secondly, the output tempera-ture of the air motor should be upper than the minimum allowed tem-perature specified by the designer (−20 °C according to[50]). Owning that the minimum ambient temperature on which the cooling energy should be activated is 25 °C, a simple calculation gives that an output temperature of air motor at −20 °C corresponds to a pressure input of 6 bar (absolute value). The expansion mass flow rate at 0.0183 kg/s corresponds to the maximum efficiency of the air motor at the fixed pressure[37], while at the same time it is ensured its adaptability to air turbines and to produce a total output power (ranging from 1.5 kW to 2 kW) to meet the need of a small scale electric load. In the end, the values of the performance parameters of machinery such as efficiency were collected from available commercial data (where the highest values are taken) or from the estimated values in the literature.
Table 1
Fixed parameters and variable parameters of the parametric study.
Fixed parameters Value Reference
Ambient temperature [°C] 30 –
Input power [kW] 3.17 [37]
Polytropic coefficient of compressors 1.25 [37]
Compressor mechanical efficiency 0.9 Average value of the range (0.85;0,95)[51] Motor electric efficiency 0.9 Premium motor efficiency[52]
Total volume of 6 air storage reservoirs [m3] 0.29 [37]
Dimension of each air reservoir (height × diameter) [m] 1.4 × 0.21 [37]
Storage time [h] 5.5 Time required to stabilize the temperature and pressure[37].
Thermal efficiency of TES 0.95 –
Expansion mass flow[kg/s] 0.0183 –
Minimum pressure of compressed air [bar] 25 [47] Total to total efficiency of turbines 0.63 [47] Mechanical efficiency of turbines 0.95 [45] Generator electric efficiency 0.9 Like motors Minimum allowed temperature output of AM [°C] −20 [50]
Input pressure of AM (bar) 6 Analysis of AM data Polytropic coefficient of AM 1.1 [37]
Thermodynamic to mechanical efficiency conversion of AM 0.304 [37]
COPheat pump(heating mode) 4 [9]
COPheat pump(cooling mode) 3 [9]
Varying parameters Value ranging
Temperature of hot TES [°C] [70; 150]
Effectiveness of HEX [0.65; 0.97]
Maximum pressure of compressed air [bar] [30; 350]
Table 1also presents the design varying parameters and their ranges of variation. These parameters are varied one at a time or many at the same time to study their effects on the system performances. As an illustration, when the temperature of TES is varied the number of compression stages and HEX effectiveness are constant (the parameters are varied one at a time). On the other hand, when the number of compression stages is varied the effectiveness of HEX is constant, while the thermal energy storage temperature should be changed (many parameters are changing at the same time). Each case will be explained further inSection 3.
2.4. Evaluation criteria
It is recognized that each energy storage technology should be as-sessed based on different criteria such as: technical maturity, energy density, efficiency, cost and others criteria. All of them are well ex-plained in details by Luo et al. [1]and Chen et al. [2]. Hence, the criteria which can be accounted for by the thermodynamic modeling are well established in this study and listed as follows:
Energy density Ed(kWh/m3) is defined by the amount of output en-ergy provided per unit of volume as expressed byEq. (30). This criterion is of crucial importance, as higher energy density requires a small volume which makes the system more compact and may reduce its cost.
= E E V d out el e res , , (30) where Eout, eleis the output electrical energy and is accounted by:
=
Eout el, Wel e,.tdis (31)
Round trip electrical efficiency or simply electrical efficiency: it is defined by the ratio of energy output to energy input.
=E = E W t W t el out el in el el e dis el c ch , , , , (32)
Since our system produces heating and cooling energy, the coeffi-cient of performance defined byEq. (33)accounts for these elements. By contrast, it is more appropriate to compare our system with other electrical energy storage technologies, so the comprehensive efficiency defined byEq. (34)is used on which the cooling and heating energy are replaced by the equivalent electrical energy to produce the heating and
cooling energy by a conventional heat pump (see [10]and[37]for further details). = + + COP Q Q E E g s cool out el in el , , (33) = + + E E g Q COP Q COP out el in el , , heat ref heat cool ref cool , , (34) where COPref, heatand COPref, coolare the performance coefficients of conventional heat pump functioning on heating and cooling mode re-spectively.
The cost of the system is a vital criterion to be assessed. It begins with finding the characteristics of each component of the system including the number of compression and expansion stages, heat exchangers foot-prints, reservoir volume and operating pressures. All these parameters will be discussed for the sake of reducing the cost of the system. Note that the estimation of the cost of each component is beyond the scope of this article. Finally, the system is also assessed in term of the time of charge and discharge which have a useful practical significance.
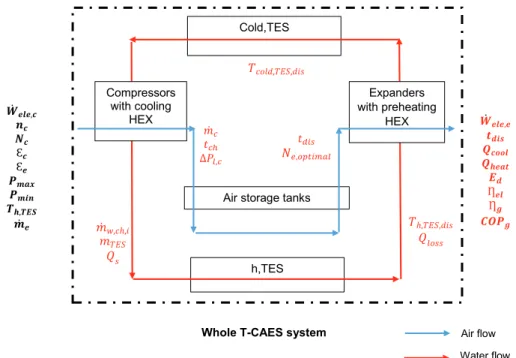
To sum up the thermodynamic model and the evaluation criteria, Fig. 4shows the block diagram of the T-CAES system model with the main input and output parameters. In previous studies[6,10,26], op-timization study via parametric analysis was made by varying one parameter and taking the others as default values. In our study, as mentioned earlier the mutual effects of the parameters are studied at-tempting to find optimal solutions for the design of the system. Using the method explained in the previous section, the effect of the para-meters listed inTable 1was evaluated by taking into consideration the impact of each parameter in others. Then, optimal solutions are derived and the two configurations are compared. The cooling energy was in-itially activated in all cases and then disabled to investigate its effect.
3. Results and discussions
3.1. Effects of the temperature of the thermal energy storage
The following parameters are fixed: 1 Number of compression stagesNc=3.
Fig. 4. Block diagram of the thermodynamic model of the whole T-CAES system with main input parameters (black) and output parameters (red). (For interpretation
2 Maximum pressurePmax=200bars. 3 The effectiveness of HEX : = = 0.85c e .
The variation of electric and comprehensive efficiencies and also the optimal number of expansion stages, HEX footprints and finally the temperature of cold TES and the output temperature are shown in Fig. 5(a), (b) and (c) respectively.
In the discharge process, in order to satisfy the condition of the output temperature of the turbine close to the ambient temperature, a higher level of Th, TESmeans a low number of expansion stages which decreases at a critical values of Th, TESat 80 °C and 130 °C (seeFig. 5(a)). According to Fig. 5(a), in the second configuration, the electrical efficiency and the comprehensive efficiency increase continuously a little due to the fact that the input temperature of turbines increases with Th, TES. In the other hand, in the first configuration those effi-ciencies raises only as from the critical values of Th, TES(corresponding to a change of Ne).the maximum increase of the electrical efficiency and comprehensive efficiency is about 8.5% and 3.6% respectively of its initial values at 14.6% and 26%. These values have proved that the cogeneration option increases the global efficiency (by about 11.4% in this case) and the temperature of TES have a minor impact on the electric efficiency as stated by Wolf and Budt[19].
Before analyzing the required HEX footprints, it is known that the total footprint of a number of HEX is governed by the logarithmic mean temperature difference (LMTD) of each HEX and obviously the number of HEX.
In the charge process, once the temperature of thermal energy sto-rage is changed while keeping the HEX effectiveness as constant, the water mass flow rate should decrease and the logarithmic mean tem-perature difference (LMTD) of each HEX decreases. As a result, the total footprint of the three intercooling HEX in compression phase increases (seeFig. 5(b)).
In the discharge phase, it can be observed also fromFig. 5(b) that the general trend of the discharge phase HEX footprint decreases as Th, TESincreases due to the fact that the number of expansion stages de-creases. However, a further inspection says that at the critical values of
Th, TESthe footprint has its maximum value for the first configuration and its minimum values for the second configuration. Afterwards, the footprint of the first configuration decreases significantly (of an average value of 3.15 W/°C) which results from the increasing the LMTD of each HEX exchanger, whereas the footprint of the second configuration in-creases slowly (of an average value of 0.39 W/°C) which is linked also for the little increase of the LMTD.
In totality, the total footprint of all the HEX is mainly influenced by the HEX of the discharge phase (see the trend of the red line in Fig. 5(b)). It takes its minimum values always in the first configuration due the additional recooling HEX in the second configuration. The minimal possible of 103 W/K was achieved atTh TES, =120 Cin the first configuration, while the values were (130 °C; 215 W/K) for the second configuration.
FromFig. 5(c), it can be seen that the temperature of cold TES is almost constant at 10 °C higher than the ambient temperature which is linked to the pinch point temperature difference Pinche. By contrast, in the second configuration, since Pincheis related to Th, TES, Tcold, TES in-creases almost linearly versus Th, TESfor a fixed number of expansion stages and presents discontinuities with varying Ne. Its value is always above 60 °C which is suitable for heating purposes.
Finally, as can be predicted from the design methodology, the output temperature of air motor is constant at −15 (where the ambient tem-perature is 30 °C) for the first configuration but it is a little higher in the range of [−12;−15.2] in the second configuration which is attributed to the effectiveness of the recooling HEX. It should be noted that the heating and cooling energy shows a very little difference between the 2 config-urations (data are not shown because of the minor effect).
Fig. 5. (a) T-CAES efficiencies (left axis) and the
op-timal number of expansion stages (right axis) as a function of the temperature of TES (Solid line for first configuration and dashed line for the second). (b) Required HEX footprints (left axis) and the number of expansion stages (right axis) as a function of the hot temperature of TES (solid line for first configuration and dashed line for the second). (c) The temperature of AM and of the cold TES as a function of the hot tem-perature of TES. (For interpretation of the references to color in this figure legend, the reader is referred to the web version of this article.)
To summarize, generally speaking, an increase in the temperature of TES results in a decrease of the required expansion stages and the re-quired HEX footprint but a slight increase of the electric and compre-hensive efficiency. Besides, there are critical values of Th, TESto be avoided (80 °C and 130 °C for the first configuration) in order to reduce the HEX footprints without a much decrease of the efficiencies of the system. Eventually, the first configuration is simpler and better from an economical point of view (based on HEX footprints).
3.2. Effects of the number of compression stages
The effect of this parameter is studied in the literature taking into ac-count a constant temperature of TES[6]or constant mass flow rate of in-tercooling HEX[26]and with a constant number of expansion stages. It is important to reinforce the analysis by integrating a reasonable choice of Th, TES and varying the number of expansion stages. In this work, this tem-perature is varied according to the results obtained in theSection 3.1, it is chosen in order to reduce the system complexity (number of expansion stages and total HEX footprints) and simplify our analysis. Consequently, Th, TESwas selected the maximum possible value (in other wordsCmin=Cmax
for intercooling HEX) which matches these objectives (seeFig. 5(b)). The other parameters were fixed as follows:
1 Maximum pressurePmax=200bars. 2 The effectiveness of HEX : = = 0.85c e .
As evident fromFig. 6(a) the rise of the number of compression stages implies an increase of the expansion stages going from critical values (passing from three compression stages to two and from 6 to 7), meanwhile the temperature of TES is reduced which is a consequence of the decline of the temperature output of each compression stage.
Fig. 6(c) displays the variation of the ratio of discharge time to charge time and the heat stored as a function of the number of compression stages. It is known from the literature that a higher number of Nc in-creases the compression efficiency which means a reduce of the time of charge for a fixed electric power input, thus it can be seen that the ratio
tdis/tch augment with Nc substantially (around 19%) at the beginning (passing from 2 to 4 stages) and slightly (about 3%) afterwards. Turning to the heat stored, Nchas a marginal effect on it. Similarly, heating and cooling energy hardly varies (data are not shown here).
Fig. 6(b) reports the variation of the efficiencies of the system. Since the time of charge is increased, the electric and comprehensive effi-ciencies share the same behaviors as the tdis/tchratio, with a little in-crease when the number of compression stages are above three or four. These variations are consistent with that of Luo et al.[26]and Facci et al.[6]with a difference on the values of the electrical efficiency.
The required HEX footprints are given inFig. 6(d). Generally speaking, the rise of compression stages, as well as expansion stages and HEX are behind the increase of the total footprints. Adding that the required foot-prints of the second configuration are always higher than the first one. Nevertheless, some exceptional cases occur, for instance, the total footprint for the first configuration is slightly lower when Ncincreases from 6 to 7 which can be attributed to a higher LMTD of HEX in the discharge phase. To conclude, there is an optimal choice of the number of com-pression stages, which corresponds to a compromise between increasing the electrical efficiency and decreasing the system complexity and costs (stem from the number of stages and total footprints). The configura-tion with three compression stages is an optimal soluconfigura-tion in our case.
3.3. Effect of the effectiveness of intercooling HEX
As outlined in the introduction, the theoretical investigation of this
Fig. 6. (a) Temperature of hot TES (left axis) and
re-quired expansions stages (right axis) as a function of the number of compression stages. (Solid line for first configuration and dashed line for the second). (b) T-CAES efficiencies as a function of the number of compression stages. (c) Heat stored (left axis) and the discharge to charge time ratio (right axis) as a function of the number of compression stages (Solid line for first configuration and dashed line for the second). (d) The total required HEX footprints as a function of the number of compression stages.
parameter has been the subject of the study of Han and Guo [35]. Notwithstanding, their analysis is based on variable compression and expansion ratios. Alternatively, in this study, the effect of HEX effec-tiveness was carried out with a constant design temperature of TES respecting the current practical applications of HEX.
On the basis of the previous results, the following parameters are fixed as follow:
1 Number of compression stagesNc=3. 2 Maximum pressurePmax=200bars. 3 The effectiveness of expansion HEX = 0.85e
4 The temperature of the hot TES is fixed to 140 °C.
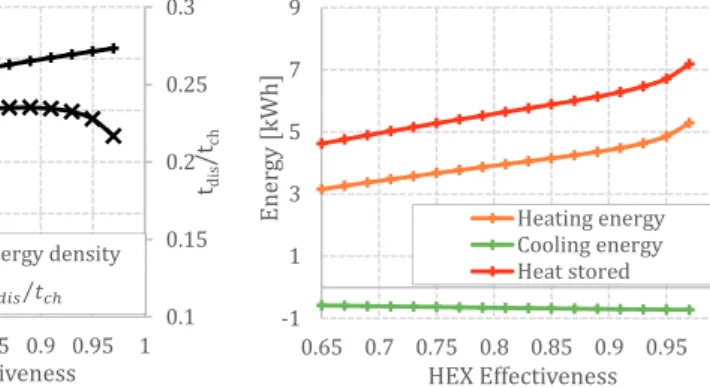
Since the charge parameters of the two configurations are the same, only the results of the first configuration are presented inFig. 7(a)–(c). Fig. 7(a) shows that the energy density grows linearly with the ef-fectiveness which arises from the drop of the temperature of the air inlet flowing to the air reservoir. In addition, the discharge to charge time ratio surges steadily with the effectiveness at the beginning, then it remains almost constant when the effectiveness is between 0.79 and 0.85 and it drops sharply when the effectiveness is above 0.93. The rise of this ratio mainly comes from the decrease of the charge time due to the growing of the air mass flow rate, and also to the increase of the discharge time due to the growing of the energy density. On the other hand, the decline of this ratio is due to the pressure losses that affect adversely the airflow and the charge time.
It is obvious that the improvement of the effectiveness increase
proportionally the heat delivered by each HEX. By combining this with the rise of the charge time, the heat stored and the heating energy in-crease significantly as can be seen fromFig. 7(b). Another conclusion which can be revealed from this figure is that the cooling energy in-creases linearly ascribed to the rise of the discharge time.
InFig. 7(c), the gain in the heat energy stored yields to the increase in the heat recuperated which gives rise to the electrical efficiency. As well, this increment with the increasing of the heating and cooling energy originates in the improvement of the comprehensive efficiency. ComparingFig. 7(a) and (c) shows that the discharge to the charge ratio and the electrical and comprehensive efficiency share the same beha-vior due to the fact that the compression and expansion powers are constant. All in all, the electrical and comprehensive efficiency increase moderately about 8% and 14.5% respectively from their initial values when the effectiveness goes from 0.65 to 0.85. It's important to note that these behaviors still in line with the results of Han and Guo[35] despite of the difference in the simulation conditions.
Finally, as can be found inFig. 7(c), the total HEX footprints rise moderately (26% of its initial value) when the effectiveness goes from 0.65 to 0.83 and then significantly (41 % of its initial value) when the effectiveness is above 0.85.
These analyses below allows us to conclude that the effectiveness of intercooling HEX should be chosen as an optimal trade-off between the system performances (efficiencies, cooling and heating energy) and the required footprints. In our cases, the optimal effectiveness is a value in the range of 0.77 to 0.86.
Fig. 7. (a) Energy density (left axis) and discharge to charge time ratio (right axis) as a function of the effectiveness of intercooling HEX. (b) Heating, cooling and
stored energy as a function of the effectiveness of intercooling HEX. (c)T-CAES efficiencies (left axis) and the total HEX footprints (right axis) as a function of the effectiveness of intercooling HEX.
3.4. Effect of the effectiveness of discharge phase HEX
Here, the same fixed parameters of the previousSection 3.3were adopted with the exception of taking = 0.85c and ɛevarying in the range of 0.65 to 0.97.
Fig. 8(a) and (b) report the simulation results in terms of the heating and cooling energy and performances respectively. The first important point to underline is that there is a critical value of the effectiveness at 0.79 on which the number of turbines can be re-duced from two to one. In the two range of variation of effectiveness ([0.65; 0.77] and [0.79; 0.97]) the parameters variations are similar.
In the first configuration, it can be noticed that there is a linear rise of 27.6 W/0.01 for the heating energy upon a decline of about 1 °C/ 0.01 of the temperature of the cold TES, which results in a total drop from 66.5 °C to 33.13 °C. This is originated from the proportional relation between ɛeand Pincheon the hand, and the heating energy on the other hand. Physically speaking, at low levels of HEX effectiveness the drop of the heating energy is elicited by the heat wasted from the cold TES reservoir to the environment. As for cooling energy, it is predicted that it remains constant as the temperature input of AM is unchanged. Owning that the temperature input and output of each turbine are also unchanged, the electrical efficiency remains constant at 14.5% then 15.2 % (Fig. 8(b)). On the other hand, the compre-hensive efficiency increases a few as 2.5%, which is accounted for the heating energy.
In the second configuration, inFig. 8(a), the cold TES temperature declines as long as the effectiveness rises. The heating energy and also the cooling energy barely increase when ɛeis below 0.77 and adversely when ɛeis above 0.77. Those effects are related in the first place to the rise of the preheating energy delivered to the air side and the increase of the amount of heat of the recooling HEX before the AM in the second place. For these reasons also, according toFig. 8(b), the electrical ef-ficiency and the comprehensive efef-ficiency slowly go up with a slope of 0.5%/0.15 and 0.3%/0.15 respectively.
Finally, the total footprints of HEX in the two configurations slowly rises as the effectiveness is below 0.83, by contrast it increases dra-matically as the effectiveness is above 0.85.
To conclude, it is crucial to choose the effectiveness of HEX above a critical value (at 0.79 in our case) in order to reduce the number of expansion stages. The overall efficiencies can be kept as high as ex-pected even if the effectiveness is at moderate values ([0.79; 0.85] in our case). Furthermore, in the first configuration, an additional option to economize in terms of the area of HEX area is to impose the effec-tiveness as lower as possible conditionally upon using the water mass of cold TES reservoir for heating purposes.
3.5. Effect of the maximum storage pressure
In order to isolate the effect of the number of compression stages they are fixed to two and the other parameters are chosen as follow:
1 The minimum pressure isPmin=25bars. 2 The effectiveness of HEX = = 0.85e c
3 Th, TESis the maximum possible value (Cmin=Cmax for intercooling
HEX).
Based on the perfect gas relation, the stored air mass and the time of charge are proportional to the maximum storage pressure so that the energy density rises linearly as evident inFig. 9(a). On the other side, the required charge time is greater than of the discharge one because of the former is proportional to β5(seeEq. (A3.3)), evidence for this is in
Fig. 9(a) where the discharge to charge ratio declines mostly from 30 bars to 180 bars.
The inspection ofFig. 9(b) indicates that the heat stored and the heating energy increase significantly with the maximum storage pres-sure, which is originated from two major effects: the increase of the discharge time and the rise of the heat power (due to the increase of the temperature output of each compression stage). Besides, the heat re-cuperated in the discharge phase increases, it can be seen by regarding the difference between points of the graph of the heat stored and of the heating energy inFig. 9(b). Simultaneously, for the past reasons, in Fig. 9(c), the electric and the comprehensive efficiencies plunge down over than 36% and 23% respectively from their initial values at 23.2% and 33.5% as the pressure goes from 30 bars to 130 bars. Afterwards the two electric and comprehensive efficiencies decrease moderately with a proportion of 12% and 8% respectively.
Regarding to the required HEX footprints shown inFig. 9(c), the total footprint decreases as high as 50% when the pressure rises to 130 bars and then as lower as 11%.
To sum up, increasing the ratio of maximum to minimum reser-voir pressure δ below than 5.2 (which correspond to Pmax< 130 whenPmin=25) entails substantial decrease on the system
perfor-mance and the required footprints, while the energy density increases linearly. It is difficult to find a trade-off between the performances and the energy density so that the choice of the maximum pressure will be gov-erned by the system application and cost.
However, Proczka et al.[53]showed that the cost consequences of operating a pressure vessel at too low pressure are more severe than at too high. As a result, keeping a low value of the ratio δ of the maximum to minimum pressures, let us say 2.5, and increasing the maximum pressure, as the simulation results illustrated inFig. 10, the efficiency drop is prevented while having the opportunity to achieve a high energy
Fig. 8. (a) Temperature of cold TES (right axis),
heating and cooling energy (left axis) as a function of the effectiveness of discharge phase HEX. (Solid line for first configuration and dashed line for the second). (b) T-CAES efficiencies (left axis) and the total HEX footprints (right axis) as a function of the effectiveness of discharge phase HEX.