HAL Id: inserm-00868020
https://www.hal.inserm.fr/inserm-00868020
Submitted on 1 Oct 2013
HAL is a multi-disciplinary open access
archive for the deposit and dissemination of
sci-entific research documents, whether they are
pub-lished or not. The documents may come from
teaching and research institutions in France or
abroad, or from public or private research centers.
L’archive ouverte pluridisciplinaire HAL, est
destinée au dépôt et à la diffusion de documents
scientifiques de niveau recherche, publiés ou non,
émanant des établissements d’enseignement et de
recherche français ou étrangers, des laboratoires
publics ou privés.
Richard Crooijmans, Mark Fife, Tomas Fitzgerald, Shurnevia Strickland,
Hans Cheng, Pete Kaiser, Richard Redon, Martien Groenen
To cite this version:
Richard Crooijmans, Mark Fife, Tomas Fitzgerald, Shurnevia Strickland, Hans Cheng, et al.. Large
scale variation in DNA copy number in chicken breeds.. BMC Genomics, BioMed Central, 2013, 14
(1), pp.398. �10.1186/1471-2164-14-398�. �inserm-00868020�
R E S E A R C H A R T I C L E
Open Access
Large scale variation in DNA copy number in
chicken breeds
Richard PMA Crooijmans
1*, Mark S Fife
2, Tomas W Fitzgerald
3, Shurnevia Strickland
5, Hans H Cheng
6, Pete Kaiser
7,
Richard Redon
3,4and Martien AM Groenen
1Abstract
Background: Detecting genetic variation is a critical step in elucidating the molecular mechanisms underlying phenotypic diversity. Until recently, such detection has mostly focused on single nucleotide polymorphisms (SNPs) because of the ease in screening complete genomes. Another type of variant, copy number variation (CNV), is emerging as a significant contributor to phenotypic variation in many species. Here we describe a genome-wide CNV study using array comparative genomic hybridization (aCGH) in a wide variety of chicken breeds.
Results: We identified 3,154 CNVs, grouped into 1,556 CNV regions (CNVRs). Thirty percent of the CNVs were detected in at least 2 individuals. The average size of the CNVs detected was 46.3 kb with the largest CNV, located on GGAZ, being 4.3 Mb. Approximately 75% of the CNVs are copy number losses relatively to the Red Jungle Fowl reference genome. The genome coverage of CNVRs in this study is 60 Mb, which represents almost 5.4% of the chicken genome. In particular large gene families such as the keratin gene family and the MHC show extensive CNV. Conclusions: A relative large group of the CNVs are line-specific, several of which were previously shown to be related to the causative mutation for a number of phenotypic variants. The chance that inter-specific CNVs fall into CNVRs detected in chicken is related to the evolutionary distance between the species. Our results provide a valuable resource for the study of genetic and phenotypic variation in this phenotypically diverse species.
Keywords: Copy number variation, Chicken, aCGH, Line-specific CNVs, Inter-specific CNVs, Genes
Background
The chicken was the first livestock species to have its genome completely sequenced [1]: a large collection of chicken single nucleotide polymorphisms (SNPs) has been available for almost a decade [2]. More recently, the number of SNPs has been enlarged to over 7 million [3]. Although numerous studies studying genetic vari-ation have focused on SNPs, there is growing evidence for the substantial role of structural polymorphism in phenotypic diversity [4]. Structural variation has been recognized as an important mediator of gene and gen-ome evolution within populations [5]. While the sizes of genetic variants range from a single base to whole chro-mosomes, historically only the extreme ends of the spectrum have been explored. DNA copy number
variants (CNVs) lie between these two extremes, ranging in size from thousands to millions of bases.
In human, many CNVs are in linkage disequilibrium with nearby genetic markers and thus appear to be an-cient [6]. Others are more recent, such as CNVs af-fecting olfactory receptor gene diversity [7], or can be recurrent [8]. Structural variants include a variety of mo-lecular alterations such as duplications, deletions, and inversions [9,10]. A comprehensive map that catalogues and indexes structural variants in particular CNVs -across the genome is a necessary prelude to understand-ing their role in the context of specific phenotypic traits. Early reports estimated that at least 2% of the human genome is affected by structural variations [11], but more recent studies suggest that as much as 3.75% of the human genome harbors common CNVs [12].
CNV regions (CNVRs) will be an important comple-ment to SNP-centric genome-wide association studies, since existing SNP discovery and genotyping methodolo-gies are biased against inclusion of these more complex
* Correspondence:[email protected]
1Animal Breeding and Genomics Centre, Wageningen University, P.O. box
338, Wageningen 6700 AH, The Netherlands
Full list of author information is available at the end of the article
© 2013 Crooijmans et al.; licensee BioMed Central Ltd. This is an Open Access article distributed under the terms of the Creative Commons Attribution License (http://creativecommons.org/licenses/by/2.0), which permits unrestricted use, distribution, and reproduction in any medium, provided the original work is properly cited.
Crooijmans et al. BMC Genomics 2013, 14:398 http://www.biomedcentral.com/1471-2164/14/398
genetic variants. Furthermore, many of the CNVRs are not very well represented and annotated in the genomic sequence due to biases in chromosome assembly. In order to estimate what fraction of the genome is affected by CNV, global studies have been performed in human, chimpanzee, dog, mouse and cattle. In cattle, for ex-ample, 177 high confidence CNVRs were reported as covering 28.1 Mb, 35 of these CNVRs being apparently breed-differential or breed-specific [13]. To determine the full extent of variation and its influence on pheno-typic variation, the reference genome assembly should be near completion and more individual genomes need to be sequenced for the species of interest. Analysis of CNVs in livestock species is of particular interest, not only because of their economic importance, but also due to the often- extensive selection pressure applied in generating the different lines and varieties.
Since CNVs potentially affect gene expression [8], CNVs may account for a significant proportion of the extensive phenotypic variation observed in this species. Examples of phenotypes associated with a CNV in the chicken include late feathering on chromosome Z (GGAZ) [14], pea comb on GGA1 [15], dark brown plumage color on GGA1 [16] and dermal hyperpigmen-tation on GGA20 [17]. Additional CNVs have been detected in the chicken using aCGH [18], but that study only examined ten individuals and only identified 96 CNVs corresponding to approximately 1.3% of the chicken genome. Furthermore only 27 of these CNVs were observed in more than one individual.
Here we applied an aCGH analysis to different chicken breeds in order to obtain a global CNV map of the chicken genome.
Results and discussion
CNV in chicken
aCGH was carried out using the Agilent 244K chicken array with a mean probe spacing of 4000 bp. This array is based on the chicken assembly WUSTL 2.1 (Galgal3) and covers chromosomes 1–28, 32 and the sex chromo-somes Z and W. The virtual chromosome “ChrUn” with concatenated unmapped contigs was not taken into ac-count in the probe design. To access the chicken CNV landscape, we selected 64 animals from 6 commercial lines (layer and broiler types), 7 experimental lines (layer and broiler types), Red Jungle Fowls and Silkies. DNA samples were labeled with Cy3 whereas the reference DNA sample - derived from UCD001, the Red Jungle Fowl animal previously selected to generate the chicken reference genome assembly - was labeled with Cy5.
We defined conservative parameters for CNV detec-tion to limit false positive calls (see Methods). Within the 15 lines used in this study, 3,154 CNVs with a diffe-rent start and/or end location on the chicken genome
were detected (Additional file 1). Seventy-five percent of these CNVs are losses. Being more conservative, i.e. re-quiring the CNV to be observed in at least 2 samples, 944 CNVs (29.9%) were detected with an average size of 46.1 kb. The real time PCR validation of 12 CNVs ran-ging in being present in 1 to 41 samples did give a suc-cessful validation of 92%. Only one marker in a potential CNV which was detected in only one animal failed valid-ation by showing no difference between the reference sample. These results indicated that the detected CNVs have a high chance of being a real CNVs. Furthermore, we could confirm 13 of the 26 high confidence CNVs (50%) identified by Wang et al. (2010) and 23 out of the 70 CNVs (23.9%) detected in only one animal in that study. However, we were only able to confirm 21% of the 238 CNVs detected in another study (Wang et al. 2012) (Additional file 1). One reason why fewer CNVs were detected in the studies of Wang et al. [18,19] is the use of only 10 and 6 animals respectively from three dif-ferent breeds in those two studies. Moreover, both stu-dies used a different reference animal and the reference animal was also from the same breed. Also, none of the chicken breeds were in common between our study and those of Wang [18,19] which may account for the lack of complete validation.
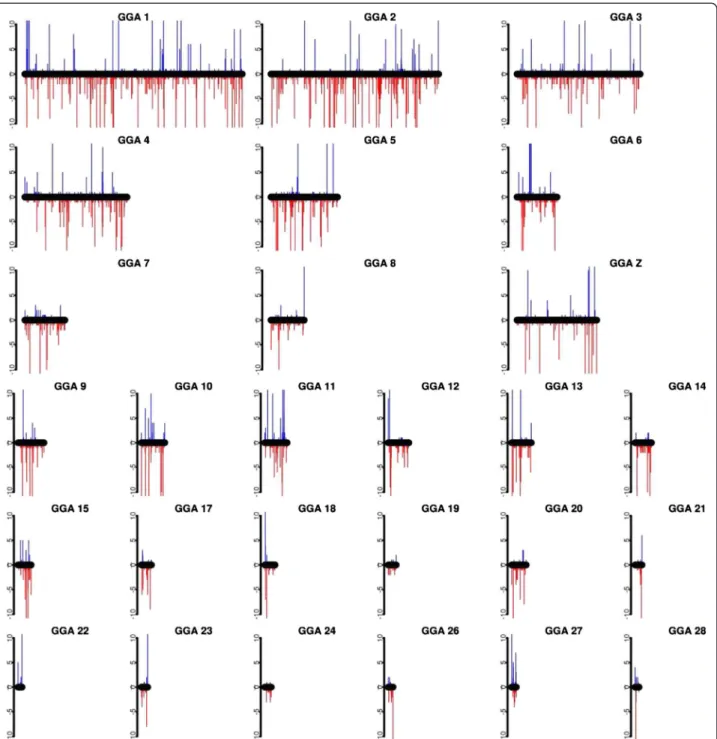
The distribution of the gain and loss CNVs over the genome is shown in Figure 1. The average size of the CNVs detected in this study is 46.3 kb, and the largest CNV, 4.3 Mb (CNV #3126), was observed on GGAZ. CNV distributions within the different chicken lines are given in Additional file 1: Table S1. Although limited sequence information is available for GGA16 (MHC-containing chromosome), the repetitive nature of this chromosome [1] was confirmed by detecting copy num-ber variations on the entire sequenced part of this chromosome. Another striking case was seen on GGA25 where 16 out of the 64 animals showed CNVs in a CNVR covering a substantial part of the genome se-quence (from 0 up to 1.85 Mb). Interestingly, GGA25 is one of the more GC-rich chromosomes and it contains a relatively large number of minisatellites [20].
The average number of CNVs per animal was 103, ranging from 61 to 209. The highest number of CNVs was detected in the commercial White Leghorn line with an average of 187.5 CNV per animal. The lowest number of CNVs was observed in the Red Jungle Fowl (Aviandiv) population with an average of 83.8 CNV per animal, which was expected as an inbred Red Jungle Fowl ani-mal was used as a reference in this study. The commer-cial broilers showed an average of 128.8 CNVs per animal. These numbers are considerably higher than those reported by Wang et al. (2012), where the average was 40 CNVs per animal. Even when our analysis is re-stricted to the autosomes, as was done in the study of
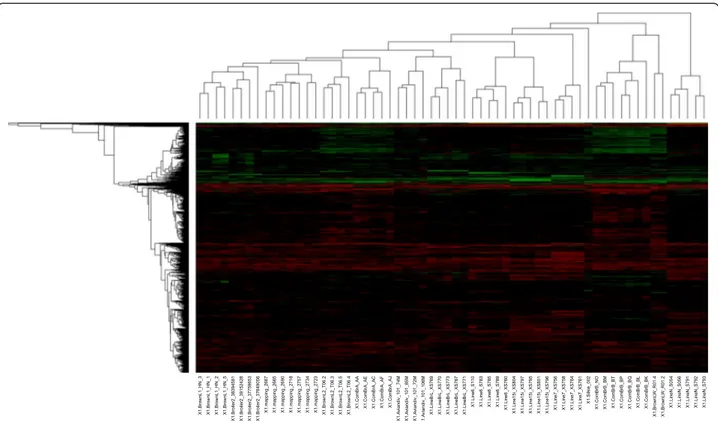
Wang et al. (2012), we still observe many more CNVs (118.8) per individual. A cluster analysis of the samples based on the CNVs detected in each of the animals results in tight clustering of all individuals from the same line (Figure 2).
CNVRs were determined by aggregating overlapping CNVs identified in all samples across the aCGH experi-ments according to the criteria defined by Redon et al.
(2006). Aggregating CNVs into CNVRs resulted in a total of 1,556 non-overlapping regions covering 60 Mb, which represent almost 5.4% of the chicken genome. An example of a CNVR in the chicken is given in Figure 3. The largest CVNR detected is located on GGAZ (CNVR 1482) and is 4.37 Mb in size. The number of CNVRs in the chicken is considerably higher than that reported by Wang et al. (2010) and Wang et al. (2012), 97 and 130
Figure 1 CNV distribution across the chicken genome. Red bars indicate copy-number losses and blue bars copy-number gains. Bar length indicates the number of occurrence for a given CNV, divided into four groups: one contains ≥ 10 animals carrying this CNV; the second is ≥ 5 and <10 animals; the third is ≥ 2 and <5 and the last group has only one animal carrying this CNV.
Crooijmans et al. BMC Genomics 2013, 14:398 Page 3 of 10
respectively. The number of CNVRs in the chicken is comparable to that reported in human [21] and almost 3 times higher than in cattle [22].
The 176- kb CNV linked to the late feathering locus [14] was detected in this dataset as CNVR 1508 on GGAZ between positions 9,971,185 and 10,140,048 with a size of 169 kb. The segregation of this CNV is shown in Figure 4. As expected, we were unable to identify the CNV in intron 1 of the SOX5 gene responsible for the pea-comb phenotype in chicken due to the small size of this CNV (3.2 kb), which is below the probe spacing on our array.
Line-specific CNVRs
Some CNVs were observed only in a single animal whereas others seem to be fixed in all individuals of one specific line. CNVs that are specific for a line or group of lines are of particular interest because these are potential candidates for genes that affect a phenotype specific for that (group of ) lines. We therefore identified those CNVs that were either fixed in at least one line (defined as fixed) or that were fixed in only a single line or breed (defined as line-specific).
Within the 15 different lines used in this study, we identified 518 CNVs, comprising a total of 214 CNVRs, which were line-specific (Additional file 2). The number of CNVRs fixed within a line ranged from 2 in the
Broiler Mapping population to 68 in the commercial White Layer. The number of line-specific CNVRs varied from 0 for the Broiler Mapping populations to 30 for the commercial White Layer line. The commercial White Leghorn line was only represented by two individuals, therefore resulting in a higher number of fixed CNVRs (68), of which 30 were line-specific. Of the fixed CNVRs, the number of line-specific CNVRs was high in the experimental lines and the Silkie breed (10 each).
The Silkie breed has a number of striking phenotypic characteristics such as black skin, white feathers and black bones. We therefore investigated whether there is a relation between some of these CNVRs and some of these specific phenotypes. For the Silkies, 27 fixed CNVRs were detected of which 10 were breed-specific (Additional file 2).
Two significant CNVRs are located on GGA20 (CNVR 812 at positions 10,722,231 to 10,844,289 and CNVR 814 at positions 11,263,937 to 11,435,137) and have already been described in detail by Dorshorst et al. (2011) after fine mapping of the phenotype fibromela-nosis (FM) in Silkies. The candidate gene involved in pigmentation, the Endothelin 3 gene (NDN3), is located within CNVR 812 [17] and, when up-regulated, is the primary driver of dermal hyperpigmentation in FM chickens. The potential function of the other eight line-specific CNVRs in Silkies is not clear. One of the three
Figure 2 Heatmap representation of copy number variation between chickens. Unsupervised clustering of CNVs with gains (green) and losses (red) yields a dendrogram that recapitulates features of the known genealogy of these animals within a line or breed.
Silkie line-specific CNVR on GGA27 (CNVR 889 at po-sitions 4,128,916 to 4,155193) harbours the gene CCR7, which stimulates melanoma migration, and the gene SMARCA4, a SWI/SNF-related matrix-associated actin-dependent regulator of chromatin. Both these genes are potential candidates for traits related to pigmentation. Further studies are needed to study the full potential of these line-specific CNVRs.
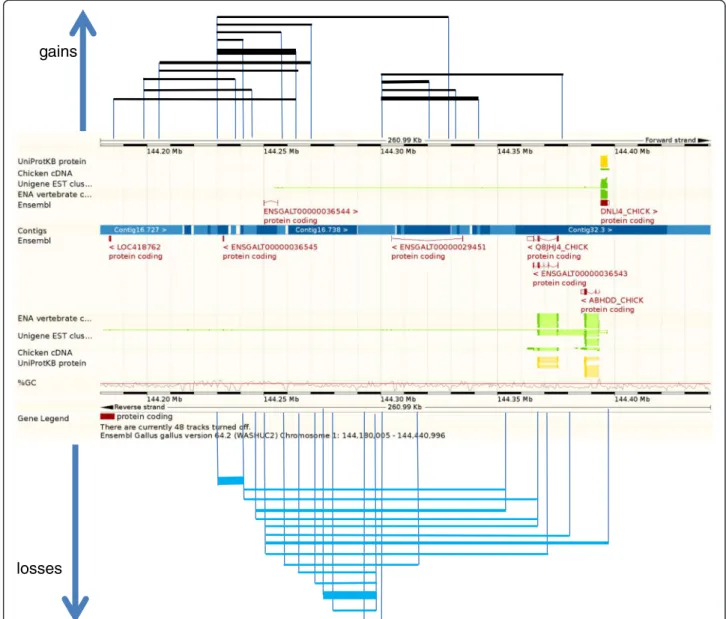
For lines 61 and 63, we detected 29 and 36 CNVRs
respectively, which are fixed in these lines, while only a single CNV and 3 CNVRs respectively are line-specific. One of the line-fixed CNVRs for line 6 (CNVR 209 on GGA1 between positions 144,249,310 and 144, 403,060) contains the gene TNFSF13B (tumor necrosis factor (ligand) superfamily, member 13b) or BAFF (B cell
activation factor). This candidate gene stimulates B cells to undergo proliferation and to counter apoptosis and was examined in more detail. To confirm this CNVR, we quantified the relative abundance of the DNA copy number for TNFSF13B using a TaqMan assay. Quantifi-cation of the ovotranferrin gene, known to be in single copy in the chicken genome, was used as an internal ref-erence. A primer probe set spanning exon 5 and intron 6 of TNFSF13B revealed a significant difference in copy number between line 61when compared to lines 7 and
N. No difference was detected using a primer probe set spanning intron 1 and exon 1. These results suggest that there is partial duplication of TNFR13B, with exon 5 duplicated in all lines tested except in lines 61 and 63.
However, the CNV does not extend as far as exon 1 of
gains
losses
Figure 3 Overview of CNVR 209 at GGA1: 144,185,960- 144,403,060. CNVR209 (217.1 kb) consists of 30 individual CNVs (see Additional file 2: Table S2) ranging from 8.8kb to 153.7kb in size across all samples. The frequency of the CNVs within this CNVR varied from 1 to 10 across the study population. Line thickness represents the number of occurrences of the CNV. Gains are indicated with black lines, losses with blue lines.
Crooijmans et al. BMC Genomics 2013, 14:398 Page 5 of 10
TNFSF13B, as indicated by the equivalent copy number across all lines at this region of the gene. Further charac-terisation of this CNV will be required to identify its boundaries accurately.
One of the three other line-specific CNVRs (CNVR521), detected in lines 61 and 63, and located at GGA18:
372390–400489, overlaps with the Myosin Heavy Chain gene 1 (MYH1).
Comparative CNV analysis
We compared the chicken CNVRs to those previously detected in turkey, duck and zebra finch (Additional file 1) [23-25]. From the 16 inter-specific CNVs detected between turkey and chicken detected by Griffin et al. (2008) using comparative CGH, 10 did not show variation in the chicken. Within the current study, 15 of these 16 specific CNVs could be verified, whereas the inter-specific CNV on chrE64 could not be validated because chrE64 was not used for probe design on the array. From the 15 inter-specific regions detected, all (100%) fall into CNVRs detected in this study. The CNV detected in the chicken Layer vs. Red Jungle Fowl on GGA2 (position 25,725,000 to 25,785,000) by Griffin et al. (2008) could not be confirmed in our study. When comparing the inter-specific zebra finch / chicken CNVs [25], 9 of the 27 CNVs (33%) did overlap with a chicken CNVR while of the inter-specific CNVs detected between duck and chicken [24], 15 of the 31 (48%) did overlap with a chicken CNVR. These results indicate that the inter-specific CNVs detected are prone to overlap with a CNVR of the avian lineage when more samples are analyzed. Fewer CNVRs
would be overlapping with inter-specific CNVs between more distant species.
Gene content of chicken CNVR
Within the 1,556 CNVRs, a total of 2,642 unique Ensembl peptides were identified based on chicken build 2.1. To examine whether genes involved in spe-cific pathways or biological processes are more prone to copy number variation, we performed a gene en-richment analysis for the genes located within the CNVRs. The chicken transcript ids were used as input into DAVID for a gene enrichment and ontology ana-lysis [26]. Terms showing significant enrichments were the GO terms “functional constituent of cytoskeleton”, “nuclear binding”, “cellular response to stress”, and “macromolecule catabolic processes”. The GO term “functional constituent of cytoskeleton” is mainly driven by the keratin superfamily. The avian keratin genes are over-represented when compared to mam-mals [1]. Phylogenetic analysis demonstrated that evo-lution of archosaurian epidermal appendages in the linage leading to birds was accompanied by duplication and divergence of the ancestral ß-keratin gene cluster. In the chicken, four subfamilies (claw, feather, feather-like and scale) of the ß-keratin genes have been named in accordance with tissue-specific expression and se-quence heterogeneity [27]. These ß-keratin gene sub-families are clustered on GGA25 whereas the genes for two other monophyletic groups of feather keratins are located on GGA27 and GGA2 respectively. We ob-served large CNVRs (CNVRs 863, 873 and 791) within all three regions in the chicken genome up to 2 Mb in size. Within these CNVRs we observed both CNV losses and gains.
Conclusions
In this study we performed aCGH screening of the chicken genome to identify CNVs in a comprehensive manner. We have identified a large number of genes af-fected by CNV, including genes involved in well-known phenotypes such as late feathering and pigmentation in Silkies. In particular large gene families such as the kera-tin gene family and the MHC show extensive variation in copy number. The CNVs in the chicken overlapping with the inter-specific CNVs (CNVs detected between different bird species) are potentially old CNVs. More-over, when the evolutionary distance between chicken and the other bird species is enlarged the older (more ancient) the CNV is. Many of these CNVs very likely affect traits of economic importance in the chicken and our global characterization of CNVRs in the chicken genome will aid in the identification of structural vari-ation in the genome underlying important phenotype differences for qualitative and quantitative traits.
mother ZW father ZZ daughter ZW k+/ K 3 copies k+/ -1 copy K / - 2 copies Figure 4 Segregation of CNVR1508 at GGAZ: 9,971,185-10,140,048. A male (ZZ) with k+/K (3 copies) was crossed with a female k+/− (1 copy) giving a female offspring K/- (2 copies).
Methods
Construction of the oligonucleotide microarray
A CGH array for whole genome analysis in chicken (UCSC galGal3 (WUSTL build 2.1, may 20006)) was designed and constructed by Agilent Technologies (http://www.genomics.agilent.com). The chicken genome CGH microarray kit 244A had a median probe spacing of 4 kb, with probes printed using the Agilent 60-mer Sure print technology.
Experimental chicken lines
The experimental lines 6 (line 61and 63), 72and 15I5are
all experimental White Leghorn lines characterized for resistance to viral-induced tumours. Line 6 was been selected for resistance to Marek’s disease (MD) and lymphoid leukosis (LL) whereas line 72is susceptible to
MD and 15I5is susceptible to MD and LL [28]. Lines 63,
72, and 15I5are kept at the Avian Disease and Oncology
Laboratory (ADOL) at East Lansing, MI, USA, while lines 61 and 72 are bred at the Pirbright Institute, Compton,
UK. Line N is a control line. Line BrL is a Brown Leghorn line selected for resistance to infectious bursal disease virus (IBDV) [29-31]. All lines have been maintained by random mating within the flocks.
Sample processing
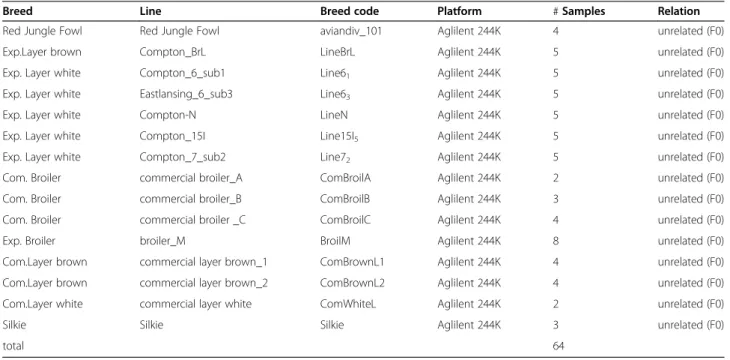
Breeds in this study include Red Jungle Fowl, one com-mercial white and two comcom-mercial brown layer lines, six experimental lines (five white and one brown) three commercial broiler and one experimental broiler line, and the Silkie breed. In total 64 animals were used (Table 1). Genomic DNA was isolated from blood with
the Puregene blood kit or the Qiagen Qiamap DNA blood kit. Blood samples were collected by veterinarians according to national legislation. No approval from the ethics committee was necessary according to local le-gislation. For the experimental lines from the Institute for Animal Health at Compton, genomic DNA was extracted from whole blood as previously described [32]. We assessed the DNA quality and quantity by OD260/280
and OD260/230 readings and on 1% agarose gels. The
re-ference sample (UCD001) used is the same individual that was used to generate the chicken genome reference sequence [1].
aCGH data analysis and CNV calling
Unamplified genomic DNA (1 μg) was labeled with Cy3 (test samples) or Cy5 (reference sample). The Agilent Oligonucleotide Array-based CGH for genomic DNA Analysis protocol (v4.0:2006) was used for the labeling of the DNA, Hybridizations, washings, and scanning of the arrays. Self-self control hybridizations were performed by labeling the reference sample with Cy3 and Cy5. Fluorescence intensities ratios were extracted using Agilent Feature Extraction software (Agilent Tech-nologies). Log2ratio profiles were then normalized using aCGH-Spline to remove dye biases and reduce experi-mental noise [33]. CNV detection was performed using a modified version of CNVfinder [32], where we opti-mized empirically significance thresholds using replicate self-self hybridizations. The CNVRs were obtained by merging overlapping CNVs according to similar criteria as described previously [21,34].
Table 1 Sample information
Breed Line Breed code Platform # Samples Relation Red Jungle Fowl Red Jungle Fowl aviandiv_101 Aglilent 244K 4 unrelated (F0) Exp.Layer brown Compton_BrL LineBrL Aglilent 244K 5 unrelated (F0) Exp. Layer white Compton_6_sub1 Line61 Aglilent 244K 5 unrelated (F0)
Exp. Layer white Eastlansing_6_sub3 Line63 Aglilent 244K 5 unrelated (F0)
Exp. Layer white Compton-N LineN Aglilent 244K 5 unrelated (F0) Exp. Layer white Compton_15I Line15I5 Aglilent 244K 5 unrelated (F0)
Exp. Layer white Compton_7_sub2 Line72 Aglilent 244K 5 unrelated (F0)
Com. Broiler commercial broiler_A ComBroilA Aglilent 244K 2 unrelated (F0) Com. Broiler commercial broiler_B ComBroilB Aglilent 244K 3 unrelated (F0) Com. Broiler commercial broiler _C ComBroilC Aglilent 244K 4 unrelated (F0) Exp. Broiler broiler_M BroilM Aglilent 244K 8 unrelated (F0) Com.Layer brown commercial layer brown_1 ComBrownL1 Aglilent 244K 4 unrelated (F0) Com.Layer brown commercial layer brown_2 ComBrownL2 Aglilent 244K 4 unrelated (F0) Com.Layer white commercial layer white ComWhiteL Aglilent 244K 2 unrelated (F0) Silkie Silkie Silkie Aglilent 244K 3 unrelated (F0)
total 64
Crooijmans et al. BMC Genomics 2013, 14:398 Page 7 of 10
Quantitative RT-PCR
Relative abundance of DNA copy number for candidate CNVs was quantified by TaqMan quantitative PCR using an adapted method previously described [35].
Primers and probes for TNFSF13B and ovotranferrin were designed using Primer Express (Applied Biosystems) (Additional file 3). For the PCR we used 1× real-time PCR mix, TNFSF13B forward primer (0.4 μM), and TNFSR13B reverse primer (0.4 μM), ovo forward primer (0.4 μM), and ovo reverse primer (0.4 μM), TNFSF13B FAM probe (0.2 μM), ovo VIC probe (0.2 μM), bovine serum albumin (10 μg per reaction). The PCR was performed using the TaqMan fast universal PCR master mix reagents (Applied Biosystems, Warrington, UK). Amplification and detection of specific products was performed using the Applied Biosystems 7500 Fast Real-Time PCR System with the fol-lowing thermocycling parameters: 50°C for 2 min, 95°C for 10 min, followed by 40 cycles of 94°C (15 sec) and 60°C (1 min). Results are expressed in terms of the threshold cycle value (Ct), the cycle at which the
change in the reporter dye passes a significance thresh-old (ΔRn).
To account for variation in sampling and DNA prepar-ation, the Ct values for TNFSF13B-specific product for
each sample were normalized using the Ct value of the
ovotransferrin product for the same sample. Normalized Ctvalues were calculated using the formula Ct+ (Nt' − Ct') × S/S', where Nt' is the mean Ctfor ovotransferrin among all samples, Ct' is the mean Ctfor ovotransferrin in
the sample and S and S' are the slopes of the regressions of the standard plots for the test TNFSF13B and ovotransferrin, respectively. This effectively achieves inter-polations on the standard plots to obtain the TNFSF13B Ctvalues that would have been obtained had all samples had the same (mean) amount of ovotransferrin DNA.
Additional validation was performed using a quantita-tive PCR approach, as described by Weksberg et al. [36], to investigate the difference CNVs. Copy number was determined for 12 markers in 12 different CNVs. Pri-mer3 webtool http://frodo.wi.mit.edu/priPri-mer3/ was used to design primers for qPCR validation. Amplicon length was limited between (50 bp – 100 bp) and regions with GC percentage between 30% and 60% were included, while avoiding runs of identical nucleotides. All other settings were left at their default. Details of the qPCR primers can be found in Additional file 4: Table S5. qPCR experiments were conducted using MESA Blue qPCR MasterMix Plus for SYBR Assay Low ROX from Eurogentec, this 2x reaction buffer was used in a total reaction volume of 12.5 μl. All reactions were amplified on 7500 Real Time PCR system (Applied Biosystems group). The copy number differences were determined by using a standard ∆Ct method that compares the mean Ct value of the target CNV fragments, determined
from different input concentrations, compared to the mean Ct value of reference sample (UCD001).
Functional gene annotation
Functional gene annotation is performed in DAVID (gene Functional Classification Tool, DAVID Bioinfor-matics Resources 6.7, NIAID/NIH at http://david.abcc. ncifcrf.gov [26]. Ensemble gene ids within CNVR were collected (Additional file 5) and used as the input file for DAVID. The EASE score and the modified Fisher Exact P-Value were given where the smaller, the more enriched. Cut off P-Value within this study was E10-4.
Additional files
Additional file 1: All CNVs detected within the 64 chicken using aCGH against the Red Jungle Fowl animal used for deriving the whole genome sequence. The first column indicated the CNV number whereas column 2 indicates the CNVR number of this CNV. Further columns indicate start and end position of the CNV on a particular chromosome followed by the overall occurrence of this CNV in the 64 animals used. Detailed CNV occurrence per line is given in the following columns. The last 4 columns give a literature review of overlapping chicken CNV found by others including the inter-specific CNVs detected in other avian species.
Additional file 2: Presents the specific CNVs either fixed or variable within a line or over lines. Yellow blocks indicate fixed CNV within a line, green blocks represent fixed CNVs in a certain group of lines whereas red blocks represent specific CNV fixed within one line. Additional file 3: Oligonucleotide primers and probes used in real-time PCR of TNFR13B.
Additional file 4: Marker information for the validation of 12 CNVs by real time PCR.
Additional file 5: Genes completely or partial overlapping with the CNVRs. For every CNVR the genes are reported with completely or partial including Ensembl gene id with start en end of this gene. In the last column potential gene name is given (according to Ensembl).
Abbreviations
CNV:Copy number variation; CNVR: Copy number variation region; SNP: Single nucleotide polymorphism; RT-PCR: Reverse transcriptase polymerase chain reaction; aCGH: Array comparative genomic hybridization; GGA: Gallus gallus; FM: Fibromelanosis; MD: Marek’s disease; LL: Lymphoid leukosis. Competing interests
The authors have declared that no competing interests exist. Authors’ contributions
RPMAC, MAMG conceived the study and prepared the manuscript. TF and RR performed the statistical analysis. MSF and PK performed analysis of the experimental lines including validation. SS performed the validation in the Silkie breed. HHC provided DNA of the reference animal and one of the experimental lines. MSF, RR, HHC, PK, SS contributed advice and data on biological issues, provided analytical support and contributed to
understanding the data. All authors read and approved the final manuscript. Acknowledgements
This work was financially supported by European Union grant FOOD-CT-2004-506416 (EADGENE), BBSRC Institute Strategic Programme Grants at the Pirbright Institute and the Roslin Institute, Hendrix Genetics, The Netherlands, Cobb-Vantress Inc, USA and The University of Delaware, College of Agriculture and Natural Resources Seed grant ANSC462123. We would like to thank Carl J. Schmidt and Mary E. Delany for their contribution of DNA from some of the lines and Bert Dibbits for the help in performing CNV validation.
Supporting data
The aCGH data from this study is submitted to the NCBI Gene Expression omnibus (http://www.ncbi.nlm.nih.gov/geo) under accession no GSE19866. The following supporting data are available with the online version of this paper.
Author details
1
Animal Breeding and Genomics Centre, Wageningen University, P.O. box 338, Wageningen 6700 AH, The Netherlands.2Genetics and Genomics group,
Compton Laboratory, The Pirbright Institute, Compton, Berkshire RG20 7NN, UK.3Wellcome Trust Genome Campus, Wellcome Trust Sanger Institute,
Hinxton, Cambridge CB10 1SA, UK.4L'institut du thorax, UMR Inserm 1087 CNRS 6291, University of Nantes, 8 quai Moncousu, BP 70721, Nantes, Cedex 1 44007, France.5Department of Animal & Food Sciences, University of Delaware,
Newark, DE 19717, USA.6Avian Disease and Oncology Laboratory, 4279 E
Mount Hope Road, East Lansing, MI 48823-5338, USA.7The Roslin Institute and R(D)SVS, University of Edinburgh, Easter Bush, Midlothian EH25 9RG, UK.
Received: 7 December 2012 Accepted: 4 June 2013 Published: 13 June 2013
References
1. International Chicken Genome Sequencing Consortium: Sequencing and comparative analysis of the chicken genome provide unique perspectives on vertebrate evolution. Nature 2004, 432:695–716. 2. International Chicken Polymorphism Map Consortium: A genetic variation
map for chicken with 2.8 million single –nucleotide polymorphisms. Nature 2004, 432:717–722.
3. Rubin CJ, Zody MC, Eriksson J, Meadows JR, Sherwood E, Webster MT, Jiang L, Ingman M, Sharpe T, Ka S, Hallböök F, Besnier F, Carlborg O, Bed'hom B, Tixier-Boichard M, Jensen P, Siegel P, Lindblad-Toh K, Andersson L: Whole-genome resequencing reveals loci under selection during chicken domestication. Nature 2010, 25:464. 587–91.
4. Zhang F, Gu W, Hurles ME, Lupski RR: Copy number variation in human health, disease, and evolution. Annu Rev Genomics Hum Genet 2009, 10:451–481.
5. Freeman J, Perry GH, Feuk L, Redon R, McCarroll SA, Altshuler DM, Aburatani H, Jones KW, Tyler-Smith C, Hurles ME, Carter NP, Scherer SW, Lee C: Copy number variation: new insights in genome diversity. Genome Res 2006, 16:949–961.
6. Hinds DA, Kloek AP, Jen M, Chen X, Frazer KA: Common deletions and SNPs are in linkage disequilibrium in the human genome. Nat Genet 2006, 38:82–85. 7. Hasin Y, Olender T, Khen M, Gonzga-Jauegui C, Kim PM, Urban AE, Snyder
M, Gerstein MB, Lancet D, Korbel JO: High-resolution copy-number variation map reflects human olfactory receptor diversity and evolution. PLoS Genet 2008, 4:e1000249. doi:10.1371/journal.pgen.1000249. 8. Bailey JA, Kidd JM, Eichler EE: Human copy number polymorphic genes.
Cytogenet. and Genome Res 2008, 123:234–243.
9. Feuk L, Carson AR, Scherer SW: Structural variation in the human genome. Nat Genet 2006, 7:85–97.
10. Feuk L, Marshall CR, Wintle RF, Scherer SW: Structural variants: changing the landscape of chromosomes and design of disease studies. Human Mol Genet 2006, 15:R57–R66.
11. Conrad DF, Hurles ME: The population genetics of structural variation. Nat Genet 2007, 39:S30–S36.
12. Conrad DF, Pinto D, Redon R, Feuk L, Gokcumen O, Zhang Y, Aerts J, Andrews TD, Barnes C, Campbell P, Fitzgerald T, Hu M, Ihm CH, Kristiansson K, MacArthur DG, MacDonald JR, Onyiah I, Wing Chun Pang A, Robson S, Stirrups K, Valsesia A, Walter K, Wei J, Wellcome Trust Case Control Consortium, Tyler-Smith C, Carter NP, Lee C, Scherer SW, Hurles ME: Origins and functional impact of copy number variation in the human genome. Nature 2010, 464:704–712.
13. Liu GE, Hou Y, Zhu B, Cardone MF, Jiang L, Cellamare A, Mitra A, Alexander L, Coutinho LL, Dell’Aquila ME, Gasbarre LC, Lacalandra G, Li RW, Matukumalli LK, Nonneman D, Regitano LCA, Smith TPL, Song J, Sonstegard TS, Van Tassell CP, Ventura M, Eichler EE, McDaneld TG, Keele JW: Analysis of copy number variations among diverse cattle breeds. Genome Res 2010, 20:693–703. 14. Elferink MG, Vallee AAA, Jungerius A, Crooijmans RPMA, Groenen MAM:
Partial duplication of the PRLR and SPEF2 genes at the late feathering locus in chicken. BMC Genomics 2008, 9:391–399.
15. Wright D, Boije H, Meadows JRS, Bed’hom B, Gourichon D, Vieaud A, Tixier-Boichard M, Rubin C-J, Imsland F, Hallböök F, Andersson L: Copy number variation in intron 1 of SOX5 causes the Pea-comb phenotype in chickens. PLoS Genet 2009, 5:e1000512.
16. Gunnarsson U, Kerje S, Bed’hom B, Sahlqvist A-S, Ekwall O, Tixier-Boichard M, Kämpe O, Andersson L: The dark brown plumage color in chickens is caused by an 8.3-kb deletion upstream of SOX10. Pigment Cell Melanoma Res 2011, 24:268–274.
17. Dorshorst B, Molin A-M, Rubin CJ, Johansson AM, Strömstedt L, Pham M-H, Chen C-F, Hallböök F, Ashwell C, Andersson L: A complex genomic rearrangement involving the endothelium 3 locus causes dermal hyperpigmentation in the chicken. PLoS Genetics 2011, 7:e1002412.
18. Wang X, Nahashon S, Feaster T, Bohannon-Stewart A, Adefope N: An initial map of chromosomal segmental copy number variations in chicken. BMC Genomics 2010, 11:351.
19. Wang Y, Gu X, Feng C, Song C, Hu X, Li N: A genome-wide survey of copy number variation regions in various chicken breeds by array comparative genomic hybridization method. Animal Genet 2012, 43:282–289.
20. Groenen MAM, Cheng HH, Bumstead N, Benkel BF, Briles WE, Burke T, Burt DW, Crittenden LB, Dodgson J, Hillel J, Lamont S, de Leon AP, Soller M, Takahshi H, Vignal A: A consensus linkage map of the chicken genome. Genome Res 2000, 10:137–147.
21. Redon R, Ishikawa S, Fitch KR, Feuk L, Perry GH, Andrews TD, Fiegler H, Shapero MH, Carson AR, Chen W, Cho EK, Dallaire S, Freeman JL, González JR, Gratacòs M, Huang J, Kalaitzopoulos D, Komura D, MacDonald JR, Marshall CR, Mei R, Montgomery L, Nishimura K, Okamura K, Shen F, Somerville MJ, Tchinda J, Valsesia A, Woodwark C, Yang F, Zhang J, Zerjal T, Zhang J, Armengol L, Conrad DF, Estivill X, Tyler-Smith C, Carter NP, Aburatani H, Lee C, Jones KW, Scherer SW, Hurles ME: Global variation in copy number in the human genome. Nature 2006, 23:444–454.
22. Hou Y, Liu GE, Bickhart DM, Matukumalli LK, Li C, Song J, Gasbarre LC, Van Tassell CP, Sonstegard TS: Genomic characteristics of cattle copy number variations. BMC Genomics 2011, 12:127.
23. Griffin DK, Robertson LB, Tempest HG, Vignal A, Fillon V, Crooijmans RPMA, Groenen MAM, Deryusheva S, Gaginskaya E, Carré W, Waddington D, Talbot R, Völker M, Masabanda JS, Burt DW: Whole genome comparative studies between chicken en turkey and their implications for avian genome evolution. BMC Genomics 2008, 9:357.
24. Skinner BM, Robertson LBW, Tempest HG, Langley EJ, Ioannou D, Fowler KE, Crooijmans RPMA, Hall AD, Griffin DK, Völker M: Comparative genomics in chicken and pekin duck using FISH mapping and microarray analysis. BMC Genomics 2009, 10:168.
25. Völker M, Backström N, Skinner BM, Langley EJ, Bunzey SK, Ellegren H, Griffin DK: Copy number variation, chromosome rearrangement and their association with recombination during avian evolution. Genome Res 2010, 20:503–511.
26. Huang DW, Sherman BT, Lempicki RA: Systematic and integrative analysis of large gene lists using DAVID bioinformatics resources. Nature Protoc 2009, 4:44–57.
27. Greenwold MJ, Sawyer RH: Genomic organization and molecular phylogenies of the beta (ß) keratin muligene family in the chicken (Gallus Gallus) and zebra finch (Taeniopygia guttata): implications for feather evolution. BMC Evolutionary Biology 2010, 10:148.
28. Pazderka F, Longenecker BM, Law GRJ, Stone HA, Ruth RF:
Histocompatability of chicken populations selected for resistance to Marek's disease. Immunogenetics 1975, 2:93–100.
29. Waters NF: Breeding for resistance and susceptibility to avian lymphomatosis. Poult Sci 1945, 24:259–269.
30. Stone HA: Use of highly inbred chickens in research. No. 1514, Washington, DC: USDA-ARS Technical Bulletin; 1975.
31. Bacon LD, Hunt HD, Cheng HH: A review of the development of chicken lines to resolve genes determining resistance to diseases. Poult Sci 2000, 79:1082–1093.
32. Bumstead N, Messer LI, Greenwood NG: Use of ev loci as a measure of inbreeding in domestic fowls. Br. Poultr Sci 1987, 28:717–725.
33. Fitzgerald TW, Larcombe LD, Le Scouarnec S, Clayton S, Rajan D, Carter NP, Redon R: aCGH.Spline-an R package for aCGH dye bias normalization. Bioinformatics 2011, 27(9):1195–1200.
Crooijmans et al. BMC Genomics 2013, 14:398 Page 9 of 10
34. Graubert TA, Cahan P, Edwin D, Selzer R, Richmond TA, Eis PS, Shannon WD, Li X, McLeod HL, Cheverud JM, Ley TJ: A high-resolution map of segmental DNA copy number variation in the mouse genome. PLoS Genet 2007, 3:e3. doi:10.1371.
35. Baigent SJ, Petherbridge LJ, Howes K, Smith LP, Currie RJ, Nair VK: Absolute quantitation of Marek's disease virus genome copy number in chicken feather and lymphocyte samples using real-time PCR. J Virol Methods 2005, 123(1):53–64.
36. Weksberg R, Hughes S, Moldovan L, Bassett AS, Chow EW, Squire JA: A method for accurate detection of genomic microdeletions using real-time quantitative PCR. BMC Genomics 2005, 6:180.
doi:10.1186/1471-2164-14-398
Cite this article as: Crooijmans et al.: Large scale variation in DNA copy number in chicken breeds. BMC Genomics 2013 14:398.
Submit your next manuscript to BioMed Central and take full advantage of:
• Convenient online submission • Thorough peer review
• No space constraints or color figure charges • Immediate publication on acceptance
• Inclusion in PubMed, CAS, Scopus and Google Scholar • Research which is freely available for redistribution
Submit your manuscript at www.biomedcentral.com/submit