HAL Id: hal-00809272
https://hal.univ-brest.fr/hal-00809272
Submitted on 8 Apr 2013HAL is a multi-disciplinary open access
archive for the deposit and dissemination of sci-entific research documents, whether they are pub-lished or not. The documents may come from teaching and research institutions in France or abroad, or from public or private research centers.
L’archive ouverte pluridisciplinaire HAL, est destinée au dépôt et à la diffusion de documents scientifiques de niveau recherche, publiés ou non, émanant des établissements d’enseignement et de recherche français ou étrangers, des laboratoires publics ou privés.
Pulse Compression with Superluminal Group Velocity in
1-D Photonic Bandgap Coplanar Waveguide
Marc Le Roy, Eric Lheurette, André Pérennec
To cite this version:
Marc Le Roy, Eric Lheurette, André Pérennec. Pulse Compression with Superluminal Group Velocity in 1-D Photonic Bandgap Coplanar Waveguide. 34th European Microwave Conference, Oct 2005, Amsterdam, France. pp.463-466, �10.1109/EUMC.2004.1610077�. �hal-00809272�
Pulse Compression with
Superluminal Group Velocity in 1-D Photonic
Bandgap Coplanar Waveguide
Marc Le Roy
1, Eric Lheurette
2, André Pérennec
11LEST (Laboratoire d’Electronique et Systèmes de Télécommunication) – UMR CNRS 6165.
UBO – ENSTBr, 6 Av. Le gorgeu, CS 93837, 29238 Brest Cedex 3, France.
2IEMN (Institut d’Electronique de Microtechnologie et Nanotechnologie) – UMR CNRS 8520 – DHS.
Cité Scientifique – Avenue Poincaré, BP 69, 59652, Villeneuve d’Ascq Cedex, France. E-mail: [email protected] ; Phone: (33) 2 98 01 65 05 ; Fax: (33) 2 98 01 63 95.
Abstract — We report on the analysis and design of a
Photonic BandGap coplanar waveguide (CPW) that jointly exhibits pulse compression and superluminal group velocity in the so-called anomalous dispersion region for a Gaussian modulated signal. The coupling of an analytical analysis method with an optimization algorithm enables the design of a coplanar PBG to reach the specified function. Measurements confirm our simulation data and the relevance of our approach. Further to these experiments, a discussion on superluminal velocity fundamentals is proposed.
I. INTRODUCTION
The development of photonic crystals or Photonic BandGap (PBG) for optical devices [1] has induced the emergence of novel periodic structures in microwave and millimeter-wave frequency ranges. Most microstrip PBG structures are designed by etching periodic holes in the ground plane [2] to get either filtering functions or specific antenna radiation patterns [3]. Many networks are built on criteria initially developed for optical applications such as Fiber Bragg Gratings (FBG) [4] often considered as 1-D PBG. FBG allows optical pulse compression both in reflection and transmission. Here, a microwave planar pseudo-periodic pattern is developed to get compression in transmission. Then, the compression technique is implemented in the forbidden bandgap where the group velocity is expected to exceed
c, the speed of light in vacuum [2]. At microwave
frequencies, the characterization of this “superluminal pulse propagation” is of prime interest: first, time advances longer than those in optical domain can be obtained and, secondly, constraints are less strict in microwave circuit technological processes.
The 1-D PBG proposed here was designed by using an analysis method originally developed for microwave filters [5] and coupled with an optimization algorithm. Such a structure can also be treated as a Gaussian stop-band filter with continuous patterns. Theses patterns are simulated through our specific analysis approach as the overall shape consists of continuous impedance variations. Moreover, this analysis method being applicable to arbitrary shape, it provides a fit of a specified function more accurate than PBG with identical
cascaded sections. The associated formalism is described in section II. Frequency and time simulations are then compared to this objective function and to measurements. The experiments confirmed a pulse maximum velocity higher than c, and a pulse shape compression in agreement with our expectations.
II. ANALYSIS FORMALISM
To analyze arbitrary line shape, we have developed [5] the Continuously Varying Transmission Line (CVTL) Method. Our initial aim was to find a mathematical expression for a continuous line shape whose S-parameters could be solved through the telegrapher’s equation. This was done by defining the line frame with a set of couple values, i.e. position and impedance. Then, the line shape was described by a cubic spline interpolation to create an impedance curve passing through these discrete points. The cubic polynomial between two consecutive points is defined as follows:
Z(x) = Z0 + Z1 x + Z2 x2 + Z3 x3 (1)
where x varies from 0 to l, and l is the line length between two points. The polynomial coefficients Z0, .., Z3
are calculated to ensure the first and second derivative continuities of the impedance variation Z(x) at the input discrete values. The lossless non-uniform line impedance variation can also be written as:
( )
( )
( )
x C x L x Z = (2) where ) ( ) ( 3 3 2 2 1 0 0 0 C Z Z x Z x Z x L x L = ⋅ ⋅ + ⋅ + ⋅ + ⋅ (3) and 3 3 2 2 1 0 0 0 ) ( x Z x Z x Z Z C L x C ⋅ + ⋅ + ⋅ + ⋅ = (4) 0 0/ 0 L CZ = is the line impedance at the input end of the non-uniform transmission line; L0 and C0 are
telegrapher’s equation approach in the frequency domain, the voltage V(x) and current I(x) in this line are expressed as: 0 ) ( ) ( 1 2 2 2 = ⋅ ⋅ ⋅ + ∂ ∂ ⋅ ∂ ∂ ⋅ − ∂ ∂ V C L x V x x Z x Z x V ω 0 ) ( ) ( 1 2 2 2 = ⋅ ⋅ ⋅ + ∂ ∂ ⋅ ∂ ∂ ⋅ + ∂ ∂ I C L x I x x Z x Z x I ω (5)
The solutions of this equation system are respectively:
( )
x D(x).p E(x).q V = + q.E'(x)) (p.D'(x) ω Z(x) v j I(x) + ⋅ ⋅ = (6)where p and q are two constants, D(x) and E(x) are two power series expansions given by:
∑
∞ = ⋅ = 0 j j j x d D(x) (7)∑
∞ = + ⋅ = 0 1 j j j x e E(x) (8)D’(x) and E’(x) are their first derivatives; v is the
propagation velocity in the line. The dj and ej values are
calculated from fifth-order recurrence relations.
The S-parameters are expressed from the current and voltage solutions for a section of line between two discrete points. By applying boundary conditions to this section, the p/q ratio, and then the scattering parameters are calculated: D' ω v D j E' j E v ω E' D E D' j) ( Z Z ) (ω S L − + ⋅ + ⋅ + ⋅ ⋅ − ⋅ − = 0 2 21 (9) D' ω v D j E' j E v ω D' ω v D j E' j E v ω ) (ω S ⋅ + ⋅ + ⋅ + − ⋅ − ⋅ − ⋅ + − = 11 (10)
S12 and S22 expressions are obtained by following
the same approach even with an asymmetric section line.
Z0 and ZL represent the characteristic impedance at the
left- and right-hand sides of this line section, respectively. So, impedance-changing formulas are used to normalize the S-parameters to the 50 Ω common reference impedance. The whole line is characterized by a simple product of the sections chain-matrices. Each of them is got from expressions (9) and (10). The hereabove concept is well suited for association with an optimization algorithm [6] to reach microwave filtering [5] or adapting functions because the whole shape can be manipulated by a set of few points (Zj and xj; j = 1, n+1;
n: number of line sections).
III. CPW PBG DESIGN AND SIMULATION
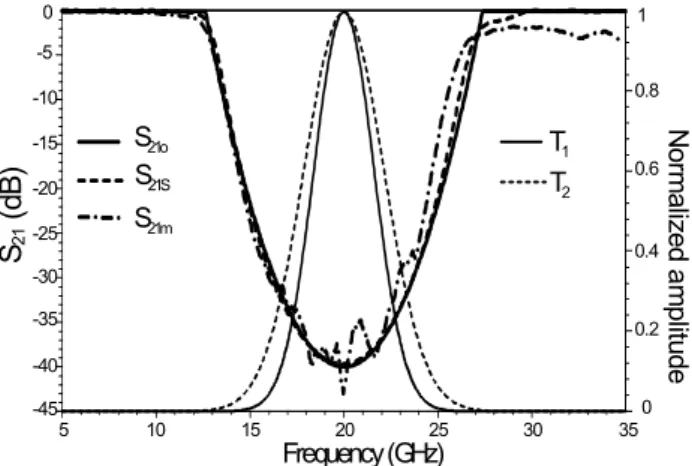
In PBG, the Bragg condition relates the central frequency of the forbidden band to the line periodicity. The number of periods and the range of impedance variations both fix the stop-band level and width. The initial parameters of the structure are based on 6.5 quasi-sinusoidal periods apodized by a specified envelope. To study pulse compression, the most useful function is the Gaussian one. Its Fourier transform is also a Gaussian where a broadening of the standard deviation in frequency-domain corresponds to a compression in time-domain. Moreover, for such a passive structure, the shape of the forbidden band is close to a ratio of two Gaussians. Here, the transfer function (indirectly the S21O parameter
magnitude (Fig. 1)) that creates the microwave pulse compression is used as the objective function for the optimization procedure. The input signal T1(f) is a
Gaussian-modulated pulse of 4.5 GHz middle-height width with a 20 GHz carrier frequency (fc):
(
)
(
)
− − = 2 . 2 exp . 2 ) ( 2 2 1 σ π πσ f fc f T (11)where σ represents the Gaussian time standard deviation. In relation (12), T2(f) is the output frequency signal; rc,
the time-compression ratio is equal to 0.75 and A is the attenuation at fc:
(
)
(
)
− − = 2 . . 2 exp . 2 ) ( 2 2 2 σ π πσ f fc rc A f T (12)The S21O parameter magnitude (Fig. 1), calculated
from the frequency ratio T2/T1, provides the objective function for the optimization procedure; it is restricted to the attenuation area by a gate function.
S21 (d B ) Frequency (GHz) 5 10 15 20 25 30 35 -5 -10 -15 -20 -25 -30 -35 -40 -45 1 0 0.8 0.6 0.4 0.2 0 N or m al iz ed a m pli tude S21o S21S T1 T2 S21m
Fig. 1. S21 parameters and frequency signals T1 and T2. S21o: objective function. S21S, S21m: simulated and measured parameters.
The optimization process is associated with the analysis method of continuous planar shape described in section II. This approach allows an exact analysis of arbitrary shape of lossless line under the quasi-TEM assumption.
25.15 mm
1 m
m
Fig. 2. Coplanar profile on alumina substrate (not to scale).
Optimization of the initial continuous patterns gives the synthesized coplanar shape depicted in Fig. 2 for an alumina substrate (εr = 9.6, h = 0.635 mm). Fig 1 shows
that the optimized simulated S21S parameter fits the
objective function.
IV. EXPERIMENTAL RESULTS
The PBG parameters were measured in frequency-domain with a vector network analyzer by using a specific TRL calibration kit to get accurate phase values. In order to allow on-wafer measurements, this kit also contained quadratic tapers alike those found at the ends of the device in fig. 2. No air bridges were required due to both the circuit symmetry and the absence of discontinuities. Fig. 1 evidences that the S21m measured
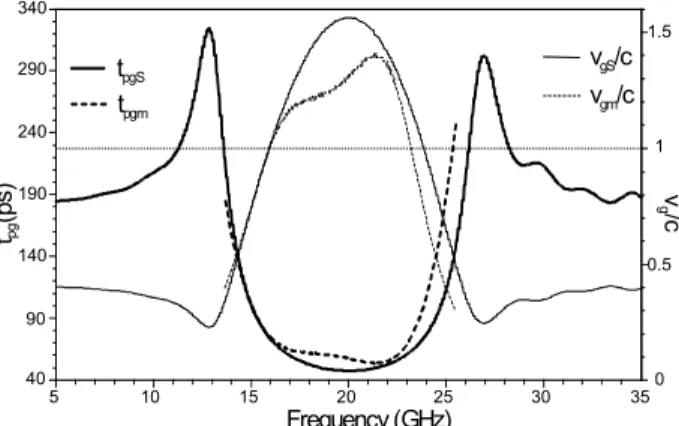
parameter is close to the simulation result. However, above 25 GHz, the frequency dispersion model used in our approach seems insufficient. In the bandgap, the noisy phase experimental points may bring unphysical group delay values through differentiation. So, a polynomial least square fit is applied to the experimental phase points before calculating group delay. From simulations and experiments, the groupdelay and -velocity (Fig. 3) both demonstrate their superluminal behavior in the rejected band.
tpg (p s) 40 90 340 140 190 240 290 Frequency (GHz) tpgS v g/c vgS/c tpgm vgm/c 5 10 15 20 25 30 35 0.5 1 1.5 0
Fig. 3. Simulated and experimental group delay and velocity.
Fig. 4 presents the ω-β diagram computed from S21 phase
and then displayed in combination with the simulated S21
magnitude plot. Measured βm and simulated βs curves are
compared to a simple microstrip line of the same length with a propagation constant βL. Following Bragg’s law,
the bandgap appears when half the wavelength matches the device period a. β takes the specific π/a value at the center of this highly dispersive region. Fig. 5 presents the theoretical envelopes of the input pulse Vin and of the
output pulse Vout shifted from the central group delay
value. The plot also shows the pulse envelope Vc issued
from the same input pulse and after propagation though the same length at c speed. The simulated and measured
transfer functions are got from their respective S21
parameters. β (rad/m) π/a 0 S21s -40 β s m 0 dB 0 5 10 15 20 25 30 35 Fr eq ue nc y ( G H z) β L Wave vector 400 800 1200 1600
Fig. 4. Dispersion diagram with the corresponding insertion loss.
The frequency product of these functions by T1(f) are
passed to iFFT to get the time-domain modulated pulses: the simulated output pulse VoutS fits in Vout envelope. This
agreement verifies the time advance from Vout to Vc and
illustrates the 1.4.c superluminal velocity of Vout pulse
maximum observed in fig. 3.
Time (ns) 2.8 2.9 3.0 3.1 3.2 3.3 N o rm a liz e d v o lt a g e 0.8 0.6 0.4 0.2 0
v
outv
inv
cv
outmv
outSFig. 5. Input and output signals and envelopes.
The pulse Voutm calculated from experimental values
showed also a good agreement with simulated and analytically estimated envelopes. A pulse compression ratio of 0.78 was found.
V. DISCUSSION
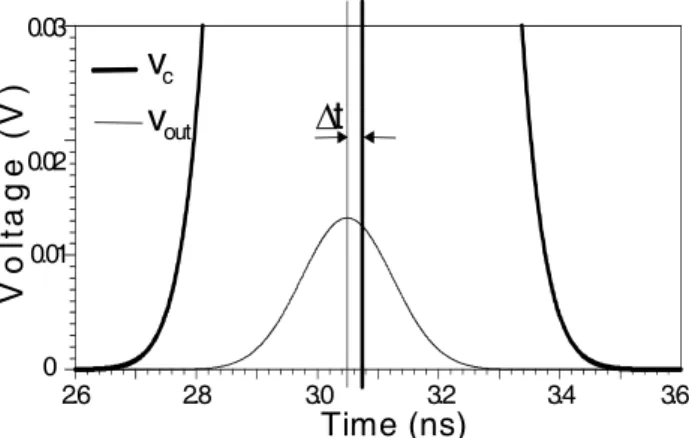
First of all, the above results are not in contradiction with the requirement of Einstein’s causality, which specifies that neither energy nor information can actually travel faster than c. This requirement was, of course, valid in previous studies dealing with superluminal group velocities in one-dimension PBG [2,8]. Here, this is evidenced by Fig. 6 where pulses are not normalized to their respective maximum contrarily to Fig. 5 and many articles [2;8-9] about “superluminal pulses”. Then, Fig. 6 clearly shows that the Vout envelope is fully included in
the Vc one, which depicts the output signal after
propagation at c through the same length as our device, without attenuation. The Vout pulse peak presents a ∆t
subluminal “front edge velocity” can be related to the “information velocity” as introduced by Sommerfeld and Brillouin [7]. Here, the group velocity can be identified as the velocity of the Gaussian pulse maximum on condition that its shape remains Gaussian.
v
cv
out Time (ns) 2.6 2.8 3.0 3.2 3.4 3.6 V o lt ag e ( V ) 0.02 0.01 0 0.03∆t
Fig. 6. Non-normalized reference and reshaped pulses. ∆t: time advance between Vout and Vc maxima.
As a matter of fact, at some wavelengths the periodic variation of the line impedance creates destructive interferences producing the forbidden gap in transmission and in time-domain attenuating the later part of the pulse. This pulse reshaping is induced by reflections analogous to those created in optical Bragg gratings. Thus, this phenomenon deals with classical interferences in an anomalous dispersion region, i.e., when the refraction index decreases with increasing frequency. A full wave analysis is not required to reveal superluminal group velocities even if this effect in 1-D PBG is often associated to evanescent modes [3,8]. Increasing the compression ratio through such passive networks implies more PBG periods and therefore a higher rejection level. Larger time advances could also be evidenced, but again with a deeper frequency gap. To resume, our results come from a compromise between rejection level and PBG length to provide pulse compression while keeping the measurement noise contributions at a reasonable level.
VI.CONCLUSION
The general nature of shapes simulated with short computation time makes this approach particularly efficient for the design of planar continuous patterns,
when it is associated with an optimization algorithm. Moreover, a simple mathematical formalism (without approximation in quasi-TEM approach) enables the complete characterization of the anomalous velocity evolution through the designed PBG structure. The pulse shape is compressed while keeping its peak velocity higher than c. Thanks to this approach, optimization of the structure group delay could be used to avoid microwave pulse dispersion-broadening; moreover, centering the pulse carrier at the bandgap edge could reduce strong attenuation. Microwave real-time spectral analysis [9] could also be performed by coplanar continuous patterns specifically designed through the above approach.
REFERENCES
[1] J.D. Joannopoulos, R.D. Meade, and. J.N. Winn, Photonics Crystal: Molding the Flow of Light, Princeton University Press, 1995.
[2] J. Tirapu, T. Lopetegi, M.A.G. Laso, M.J. Erro, F. Falcone, and M. Sorolla, “Study of the delay characteristics of 1-D photonic bandgap microstrip structures”, Microwaves and Optical Tech. Letters, vol. 23, pp. 346-349, Dec. 1999.
[3] F. R. Yang, K. P. Ma, Y. Qian, and T. Itoh, “A uniplanar compact photonic-bandgap (uc-pbg) structure and its applications for microwave circuits”, IEEE Trans. Microwaves Theory Tech., vol. 47, pp. 1509-1514, Aug. 1999.
[4] N.M. Litchinitser and D.B. Patterson, “Analysis of Fiber Bragg Gratings for Dispersion Compensation in Reflective and Transmissive Geometries,” Journal of Lightwave Tech., vol. 15, pp. 1323-1329, Aug. 1997. [5] M. Le Roy, A. Pérennec, S. Toutain, and L. C. Calvez,
“The Continuously Varying Transmission Lines Technique – Application to Filter Design,” IEEE Trans. Microwaves Theory Tech., vol. 47, pp. 1680-1688, Sept. 1999.
[6] J.J. Moré, “The Levenberg-Marquardt algorithm : implementation and theory”, Lecture notes in mathematics 630, Springer Verlag, 1978.
[7] L. Brillouin, Wave propagation and group velocity, New York, Academic, 1960.
[8] M. Mojahedi, E. Schamiloglu, F. Hegeler, and K.J. Malloy, “Time-domain detection of superluminal group velocity for single microwave pulses, Phys. Rev. E, vol. 62, pp. 5758-5766, Oct. 2000.
[9] M.A.G. Laso, T. Lopetegi, M.J. Erro, M. Castillo, D. Benito, M.J. Garde, M.A. Muriel, M. Sorolla, and M. Guglielmi, “Real-time spectrum analysis in Microstrip Technology”, IEEE Trans. Microwaves Theory Tech., vol. 51, pp. 705-717, Mar. 2003.