To link to this article : DOI :
10.1016/j.envpol.2012.02.003
URL :
http://dx.doi.org/10.1016/j.envpol.2012.02.003
O
pen
A
rchive
T
OULOUSE
A
rchive
O
uverte (
OATAO
)
OATAO is an open access repository that collects the work of Toulouse researchers and
makes it freely available over the web where possible.
This is an author-deposited version published in :
http://oatao.univ-toulouse.fr/
Eprints ID : 9374
To cite this version :
Le Jeune, Anne-Hélène and Bourdiol, Floriane
and Aldamman, Lama and Perron, Tania and Amyot, Marc and
Pinel-Alloul, Bernadette Factors affecting methylmercury
biomagnification by a widespread aquatic invertebrate predator, the
phantom midge larvae Chaoborus. (2012) Environmental Pollution,
vol. 165 . pp. 100-108. ISSN 0269-7491
Any correspondance concerning this service should be sent to the repository
administrator:
staff-oatao@listes-diff.inp-toulouse.fr
Factors affecting methylmercury biomagnification by a widespread aquatic
invertebrate predator, the phantom midge larvae Chaoborus
Anne-Hélène Le Jeune
1
, Floriane Bourdiol
2
, Lama Aldamman, Tania Perron, Marc Amyot
*
,
Bernadette Pinel-Alloul
Groupe de recherche interuniversitaire en limnologie (GRIL), Département de sciences biologiques, Université de Montréal, C.P. 6128, Succursale Centre-Ville, Pavillon Marie-Victorin, Montréal, Québec, Canada H3C 3J7
Keywords: Chaoborus Methylmercury Biomagnification Diel migration Lakes
a b s t r a c t
MeHg biomagnification by the phantom midge Chaoborus in relation to MeHg concentrations in their prey and its migratory behavior was investigated in two Canadian Precambrian Shield lakes. Three Chaoborus species with contrasted migratory behavior were collected in a fishless and a fish-inhabited lake. All species accumulated MeHg through their ontogenic development. In the lake inhabited by fish, all instars of Chaoborus punctipennis displayed a marked migratory behavior and were unable to biomagnify MeHg, whereas in the fishless lake, Chaoborus americanus and Chaoborus trivittatus biomagnified MeHg. Reduced biomagnification capacity of C. trivittatus, the coexisting species living with C. americanus, was also ascribed to a progressive vertical segregation with age. Growth dilution, amount and type of prey items or trophic position could not explain the different patterns of biomagnification. Our findings demonstrate that the most common invertebrate predator of temperate planktonic food webs can biomagnify mercury, contrarily to previous reports.
1. Introduction
Anthropogenic emission of mercury (Hg), its atmospheric
transport and its deposition have increased Hg inputs in many
aquatic ecosystems (
Driscoll et al., 2007
). Methylmercury (MeHg) is
the main metal species accumulating along aquatic food webs and
represents a major environmental threat for wildlife and human
populations (
Clarkson, 2002; Harris et al., 2007
). Several key
environmental parameters such as low pH, high DOC (
Rencz et al.,
2003; Watras et al., 1995a
) and surrounding wetland areas
(
Guentzel, 2009; St. Louis et al., 1996
) are associated with
increasing bioaccumulation of MeHg in aquatic biota. Those
parameters are favorable to MeHg production in-lake and/or in
adjacent wetlands from microbial methylation of inorganic Hg
under anoxic conditions (
Fleming et al., 2006; Gilmour et al., 1992
).
Further, the magnitude at which MeHg is accumulated and
biomagnified is strongly linked to the accumulation or dilution of
MeHg by primary producers (
Pickhardt et al., 2002
), and to the
structure of the food web (
Cabana et al., 1994; Power et al., 2002
).
For consumers, it is essential to integrate exposure to MeHg from
different feeding patterns and foraging habitats (
Eagles-Smith
et al., 2008; Power et al., 2002
) since exposure to MeHg occurs
primarily through diet.
Aquatic invertebrate predators are often important conduits of
contaminants to fish and commonly have higher MeHg
concen-trations than their prey (
Chetelat et al., 2011; Cremona et al., 2008;
Mason et al., 2000
). However, Chaoborus larvae (Insecta, Diptera),
an invertebrate predator distributed worldwide, does not seem to
respond to the classical pattern. This key predator seems to be
inefficient in accumulating and biomagnifying MeHg (
Back and
Watras, 1995; Paterson et al., 1998
).
Chaoborus larvae undergo four aquatic stages before their
metamorphosis to pupae and emergent adults. Diet of the larvae is
mainly composed of zooplankton but varies during their ontogenic
development (
Fedorenko, 1975a; Persaud and Dillon, 2010
).
Chao-borid larvae often perform diel vertical migrations in order to avoid
fish predation pressure (
Dawidowicz et al., 1990; Garcia and
Mittelbach, 2008; McQueen et al., 1999
). This migrating behavior
affects their feeding activities inducing a local vertical segregation
between food resource habitat and refuge habitat in the water
column over day and night cycles. Such behavior may also occur to
various degrees in fishless lakes and ponds for chaoborid species
* Corresponding author.
E-mail address:m.amyot@umontreal.ca(M. Amyot).
1 Present address: UMR CNRS 6023 Microorganismes, Génome et
Environne-ment, Bât. A, 24 avenue des Landais, 63177 Aubière Cedex, France.
2 Present address: INP, ENSAT, École Nationale Supérieure en Agronomie de
Toulouse, Avenue de l’Agrobiopole, Auzeville-Tolosane, BP 32607, 31326 Castanet-Tolosan Cedex, France.
cohabiting and competing with Chaoborus americanus, a
non-migrating species (
Croteau et al., 2003a; Fedorenko, 1972; Garcia
and Mittelbach, 2008
).
The aim of this study was to evaluate the effect of feeding habits
and diel vertical migration on MeHg accumulation and
bio-magnifications by Chaoborus species in a fishless lake and a
fish-inhabited lake from the boreal region. We hypothesize that (i)
chaoborids will accumulate MeHg during their ontogenic
devel-opment; (ii) MeHg levels in chaoborids will be related to the
contamination of prey in their crop, and (iii) MeHg
bio-magnification will be affected by spatial segregation between
refuge habitat and food resource habitat due to differential feeding
habits and migratory behavior.
2. Material and methods
2.1. Site description and sampling periods
The study was carried out in two small Precambrian Shield lakes. Lake Geai is a small bog lake (area: 0.99 ha, max depth: 6.5 m) with acidic and dystrophic waters (Table 1). Two large chaoborid species (C. americanus and Chaoborus trivittatus) were the dominant invertebrate predators in this fishless lake (Table S1) (Masson and Pinel-Alloul, 1998). Lake Croche is a typical dimictic boreal lake with a larger area (4.74 ha) and depth (max. depth: 12 m) (Table 1). Waters are circumneutral and the lake is classified as oligo-mesotrophic. This lake is characterized by the presence of planktivorous fish (Masson et al., 2004) and its chaoborid community is composed of the small species Chaoborus punctipennis (Table S1). Samplings of water and organisms were conducted at the site of maximum depth in each lake on three dates in early June (S1), late June (S2), and at the end of August (S3) 2009.
2.2. Water quality
At each date, we measured water temperature, dissolved oxygen, pH and conductivity (YSI 600 QS meter) to determine the vertical structure of the water column (epi-, meta- and hypolimnion strata). Triplicates of dissolved organic carbon (DOC), total phosphorus (TP) and total nitrogen (TN) were analyzed once from an integrated sample collected over the water column at the beginning of June. Sampling and analyses of water samples for DOC were conducted according to the standard methods described inGarcia and Carignan (1999).
2.3. Zooplankton
Samples for taxonomic analysis were collected using integrated vertical tows from one meter above the sediment to the surface with a 53mm mesh size canti-levering plankton net. Zooplankton were narcotized with carbonated water and preserved in buffered 4% formaldehyde. Zooplankters in subsamples (5e20 mL) were identified to species level to calculate densities (individuals m!3). Rotifer and
crustacean biomass (mg of dry weight m!3) was estimated based on published
lengtheweight regressions ofMalley et al. (1989)and weight biomass from previous studies (Pinel-Alloul, unpublished data).
2.4. Chaoborus
We used an image-based keywww.cfb.unh.edu/cfbkey/html/index.htmland taxonomic keys ofSaether (1972)to identify Chaoborus species and instars. The instars were determined according to the length of their head capsule. Body length of each larva was also measured.
Chaoborus vertical diel migration was studied at each sampling date by col-lecting the larvae in epi- and hypolimnetic strata during daytime (11:00 AM) and after nightfall (11:00 PM) with a cantilevering net (53mm mesh size) equipped with a net closer trigger line. Organisms were anesthetized (carbonated water) and preserved with buffered formaldehyde (7% final concentration). The diel migration study was completed in mid-June 2010 by sampling larvae in the water column and in the upper sediment layers at noon and after nightfall in both lakes. Collections of Chaoborus in the water column were made every 1 m from the surface to 1 m above the sediment with a Plexiglas plankton trap of 0.125 m3equipped with a 53mm
mesh size plankton net. An Ekman grab (16 " 16 " 16 cm) was used to collect the Chaoborus larvae from the upper sediment. Sediments were then sieved through 1 mm, 700mm and 500mm mesh size screens. Larvae collected in the water and sediment samples were anaesthetized and then fixed with buffered 7% formalde-hyde (final concentration). Daytime and nighttime densities (individuals m!3) of
each species and instars were estimated.
The average depths of the vertical distribution of the Chaoborus species were calculated according to weight mean depth (WMD) with the equation ofFrost and Bollens (1992):
WMD ¼Pðni" zi" diÞ
Pn
i" zi
where niis the density (individuals m!3) of larvae in the sample i, diis the midpoint
of the water strata and ziis the thickness of the strata. WMD was calculated at each
sampling date (S1, S2, S3 and mid-June 2010) according to the thickness of each stratum and also based on larvae collected at each meter interval from the surface to the sediment in mid-June 2010. Depths were calculated from the water surface (which had a depth of 0 m) with increasing positive values toward the sediments.
2.5. Chaoborus crop contents
Because feeding activities occurred mainly at night, chaoborids collected at night were used for gut contents analysis at S1, S2, S3 sampling dates. Crop contents of larvae collected in mid-June 2010 were also analyzed to characterize feeding activities in relation to their spatial distribution at noon and after nightfall. Prior to fixation (7% formalin final concentration), Chaoborus larvae were anaesthetized with carbonated water. All instars were dissected to remove their crop after identifica-tion. Crop content was colored with rose Bengal and mounted on slides. Prey items were identified under a microscope ("200, "400 magnifications), counted and classified among four categories: Rotifera, Copepoda, Cladocera, and phytoplankton. The number (number crop!1) and the biomass (mg DW crop!1) of each prey category
were estimated for each crop. Phytoplankton biovolume was first estimated based on the formula ofHillebrand et al. (1999)and then converted to biomass according toVrede et al. (1999). Zooplankton biomass of each prey category was calculated as for the biomass estimated for the zooplankton community (see Section2.3).
2.6. MeHg analyses
Glassware for MeHg analysis was washed overnight with a mixture of 45% (v/v) concentrated HNO3acid and 5% HCl. Plastic wares were washed overnight with 10%
HCl. All acid-washed material was triple rinsed with ultrapure water (Milli-Q, >18 Mohm cm!1) and transported to the field in double plastic bags. Clean
tech-nique procedures for trace metals were used in the field and the laboratory. To measure MeHg in water, a 20 L high density polyethylene container was filled from vertically integrated water samples collected with a PVC tube at each sampling date (S1, S2, S3) in both lakes. Preliminary tests indicated that this sampling device neither significantly contaminated nor retained Hg during transit. The water samples corresponded to the epi- and the metalimnion strata, the two layers in which chaoborids typically feed. At the laboratory, the water was filtered with an online 0.45mm polyethersulfone filter cartridge (Polycap GW, Whatman) into acid-washed amber glass bottles. All aqueous Hg samples were preserved with HCl (0.8% final concentration; Omnitrace Ultra, VWR) at 4&C until analysis. Water samples for
MeHg were acid-distilled to remove matrix interferences, then derivatized by aqueous-phase ethylation, purged on Tenax (Tenax Corporation, Baltimore, MD, USA) and separated by gas chromatography (GC) before determination with a Tekran 2500 cold vapor atomic fluorescence spectrophotometer (CVAFS, Tekran Instru-ments Corporation). Procedural blanks contained 2 ' 1 pg MeHg. Analytical detec-tion limits, estimated as three times the standard deviadetec-tion of 10 blanks was 0.02 ng L!1for MeHg.
Microbial communities (phytoplankton and bacteria) which corresponded in this study to suspended particulate matter (0.7mm < SPM > 53mm), were collected on a pre-combusted glass membrane filter (GF/F, Whatman, and 0.7mm of porosity). Prior to the final filtration with a Teflon apparatus, a subsample of water was pre-filtered onto a 53mm mesh size net in order to remove the zooplankton.
To measure MeHg in invertebrates, small zooplankton were collected with cantilevering plankton net of 53mm mesh size on vertical hauls at each sampling date (S1, S2, S3). Chaoborus larvae and large-size zooplankton were collected with a 210mm plankton net and poured into clean glass containers. At the laboratory, samples were sieved through 600, 500, 210 and 53mm Nitex mesh size and each size fraction was rinsed with ultrapure water (Milli-Q, >18 Mohm cm!1). Small
zooplankton (mainly rotifers and nauplii of calanoids and copepods) retained on the 53mm mesh size were collected as bulk into clean polypropylene vials and kept at !20&C until lyophilization. The dominant species of macro-zooplankton collected at
the time of the sampling were sorted live under a binocular microscope. Between 200 and 800 individuals of each dominant zooplankton species or group were sorted at least in triplicate, collected into clean vials and frozen at !20&C. Mature stages of
copepods were mainly selected. Chaoborid larvae were separated live according to their body length into two to three size categories depending on community composition and sorted by species for the third and fourth intars. C. trivittatus pupae and larvae going through metamorphosis to pupae were also collected in late August (S3). From 25 to 100 individuals were handpicked into clean vials in triplicates for each category and frozen at !20&C until lyophilization.
Zooplankton, chaoborids and GF/F filters with suspended particulate matter were dried, ground and weighed prior to analysis. Typically around 0.8e2.5 mg of material was then digested in 2.5 mL of 4 M HNO3at 55&C for 16 h. The digestate
was derivatized by aqueous-phase ethylation using NaBEt4, and measured by GC-CVAFS (Tekran Instruments Corporation) based on the method ofBloom (1989).
Procedural blanks contained 1 '1 pg MeHg. Certified reference material (TORT-2) was analyzed every 10 samples, and recoveries averaged 148 ' 15 ng g!1(n ¼ 24)
corresponding to 97 ' 10% of the certified value.
2.7. MeHg accumulation through ontogenic development and biomagnification of MeHg
Temporal changes in MeHg in chaoborid larvae through their growing season were calculated as the ratio between MeHg levels in instar IV collected in late August (S3) and instar III collected in late June (S2). For C. trivittatus, MeHg levels measured in pupae were divided by those in C. trivittatus IV collected at the same date in late August.
The biomagnification factor (BMF) of the larvae was calculated as: the ratio between the mean MeHg concentration in Chaoborus species and instar, and the estimated MeHg contamination of crop at each sampling date, respectively. The following equation was used:
BMFi¼½MeHg)Chaoborus i
½MeHg)Crop i (1)
where BMFiis the biomagnification factor of the larvae (i), [MeHg]Chaoborus iis the
mean MeHg concentration in Chaoborus species or instar at the date of the sampling of the larvae (i), and [MeHg]Crop iis its estimated MeHg concentration of the crop i.
The MeHg concentration of the crop was estimated as follow:
½MeHg)Crop i¼
P"Biomass of prey " ½MeHg)
prey
# Total Biomass of the cropi
(2) Total crop biomass was determined from the sum of the biomass of each prey category in the crop. [MeHg]preyrefers to the concentration measured in each prey
category on each sampling date. Mean MeHg concentrations measured in the different taxa of Copepoda and Cladocera collected in the water column at S1, S2, and at S3 sampling dates were used as a proxy for MeHg concentration in the Copepod category and in the Cladocera category found in gut contents. Because it was not technically possible to hand-pick phytoplankton nor rotifers, their MeHg concentrations were related to the ones measured in the particulate matter size fractions of 0.7e53mm and 53e210mm, respectively.
2.8. d15N isotope analyses
Samples of chaoborids were freeze-dried and ground. For nitrogen isotope analysis, samples were weighed into tin cups prior to combustion in a stable isotope mass spectrometer (Isoprime100 DI). Trophic position was calculated according to the formula ofCabana and Rasmussen (1996). No evidence of different trophic levels between the different Chaoborus species was found (Table S4).
2.9. Statistical analyses
Because of unequal sample sizes, variation in the occurrence and diversity of sorted species (zooplankton, Chaoborus instars and pupae), and lack of normality of the crop content data, a nonparametric test was used. For MeHg concentrations in organisms, crop content variables (number and biomass of prey, estimated MeHg concentrations of the crop), MeHg accumulation through ontogenic development and biomagnification factor (log10BMF), the Wilcoxon test was applied to compare
species and instars between or within lakes. A simple linear regression was used to explore the relationship between the log10mean BMF (biomagnification factor) and
the amplitude of migration (ratio of weighted mean depths: WMDnoon/WMDnight).
The ShapiroeWilk test was used to check the normality of the data. Significance was accepted at an alpha level of p ¼ 0.05.
3. Results and discussion
3.1. MeHg levels in water and planktonic food webs
Aqueous MeHg concentrations were an order of magnitude
higher in Lake Geai, compared to Lake Croche (
Table 1
), but within
the range of concentrations previously recorded in North America
(
Gorski et al., 2003; Roy et al., 2009; Watras et al., 1995b
). As both
lakes are geographically close and within similarly forested
catch-ments with no major direct tributaries, they should be exposed to
similar atmospheric deposition of Hg. It is likely that the difference
in aqueous MeHg levels is related to differences in water chemistry.
Lake Geai is characterized by an acid pH and twice as much
dis-solved organic carbon (DOC) when compared to Lake Croche
(
Table 1
). As a consequence, MeHg concentrations measured in
various components of the plankton food web in Lake Geai were
higher than in Lake Croche (
Table 2
). MeHg concentrations were
twice as high in small particulate matter (0.7
m
m < SPM < 53
m
m)
and 1.5
e3 times higher in Copepoda and Cladocera, respectively.
Low pH is known to increase bacterial bioavailability of Hg (II)
(
Kelly et al., 2003
), whereas high DOC is related to its increased
mobility (
Garcia and Carignan, 1999; Watras et al., 1998
). Moreover,
the geomorphologic characteristics of Lake Geai are favorable to
anoxia in deep water layers. Anoxic layers represented at least two
third of the water column in mid-spring in Lake Geai but never
exceeded one-half of the water column in Lake Croche over the
summer season (
Table 1
). It is well established that microbial MeHg
production generally occurs under anoxic and suboxic conditions
(
Morel et al., 1998
).
3.2. Diel vertical migration of Chaoborus larvae
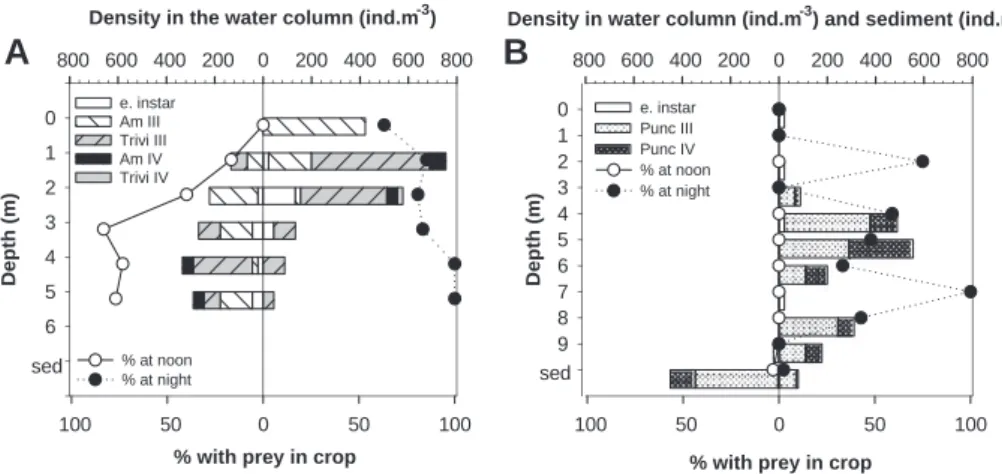
At night, the highest densities of chaoborids were always
recorded in the epi- and metalimnion in both lakes (
Fig. 1
,
Table S2,
supplement information
). During daytime, Chaoborus species in
Lake Geai stayed in the upper limnetic water layers (1e4 m)
whereas in Lake Croche, they moved to the deepest water layers
(6
e10 m) and up to 99% of the instars were found in the sediments,
during the day (
Figs. 1 and 2
).
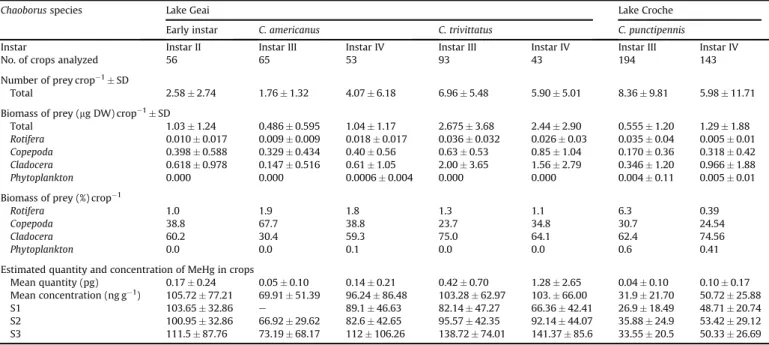
Significant differences between day and night WMDs were
detected for the coexisting instar IV of C. trivittatus in Lake Geai and
for instars III and IV of C. punctipennis in Lake Croche (
Fig. 1
).
Daytime WMD increased significantly (p < 0.05) with the age for
C. trivittatus (
Fig. 1
) whereas C. americanus stayed in upper limnetic
strata through ontogenic development.
Higher daytime WMDs in fish-inhabited Lake Croche than in
fishless Lake Geai are consistent with earlier reports of fish
avoid-ance behavior in these larvae (
Garcia and Mittelbach, 2008
). Deeper
WMDs with age for C. punctipennis in Lake Croche are due to
increased body length, which results in increased vulnerability
toward fish predators (
Lagergren et al., 2008; Voss and Mumm,
1999
). In Lake Geai, absence of predation pressure and the strong
constraint imposed by anoxia below a depth of 3 m (
Table 1
) may
explain why both sympatric Chaoborus species always inhabited
the pelagic strata (
Figs. 1 and 2
). However, a diel migration was still
detected in this lake, with C. trivittatus IV occupying deeper water
layers during the day (
Fig. 1
). Greater spatial segregation with age
between sympatric species in fishless lakes likely reduced
inter-specific predation pressure on food resource and allowed
C. americanus and C. trivittatus to coexist (
Fedorenko, 1975b
).
3.3. Feeding activity and diet of Chaoborus
Diel vertical migration affected feeding activities of chaoborids
differently in the two lakes (
Fig. 2
). Chaoborids in Lake Geai
continued to feed during the day with 16
e83% of the larvae having
prey in their crop (
Fig. 2
, A). However, feeding activities were still
higher at night than during daytime with at least 63% of individuals
with prey in their crop. In contrast, less than 3% of the individuals
collected at noon had food in their crop in Lake Croche. The ascent
of the larvae at night in the epi- and metalimnion was associated
with an increase of individuals with prey in their crop, with values
ranging from 0% to 100% (
Fig. 2
, B).
Prey biomass in crops ranged from 0.5
m
g to 2.7
m
g DW.
C. trivittatus III and IV significantly fed (p < 0.05) on a greater
biomass of prey than the other instars, with approximately 2.5
m
g of
dry weight per crop (
Table 3
). Day and night feeding activities
confirmed that the amount of food in crops of C. trivittatus was at
least twice as high as for the one reported for C. americanus of
similar body size (
Fig. 3
,
Table 3
and
Table S1
). No significant
differences of biomass in crop were observed between instars of
C. americanus (except for C. americanus III) in Lake Geai and of
C. punctipennis in Lake Croche (
Table 3
) in spite of the smaller body
size of C. punctipennis (
Table S1
).
In both lakes, crustaceans were the dominant prey in terms of
biomass for all instars and species of Chaoborus. Cladocerans and
copepods represented 30e75%
and 23e68%
of crop biomass,
respectively. Even though Lake Geai was less diverse in terms of
large crustacean species compared to Lake Croche (
Table S3,
supplement information
), similar prey types were recorded in
chaoborid crops. Chaoborids were somewhat selective in their diet,
since the distribution of cladoceran biomass in crop did not fully
reflect the crustacean community structure in the water column
(
Table S3
). Indeed, in Lake Geai copepods generally dominated
zooplankton biomass whereas in the circumneutral Lake Croche
cladocerans generally prevailed. Chaoborid diet also included
phytoplankton and rotifers, but those groups represented less than
2% of crop biomass, except for C. punctipennis, for which rotifers
reached 6.3% (
Table 3
). The relative homogeneity of diet among
chaoborid species was further corroborated by isotopic
d
15N
signatures of the fourth instar of each chaoborid species (
Table S4,
supplement information
). All species occupied a similar trophic
position that ranged between 2.51 ' 0.05 in Lake Geai and
2.87 ' 0.18 in Lake Croche.
Our results indicate that chaoborids performing important
vertical migration in the presence of fish concentrate their feeding
activities during nighttime in the epilimnion. In the fishless lake,
Lake Geai, chaoborids tended to eat during the whole day, although
they still ate more at night, a pattern consistent with studies of
Fedorenko (1972)
and
Croteau et al. (2003a)
. Migrating chaoborids
of large and small sizes (C. trivittatus and C. punctipennis) had higher
crop biomass at night than non-migrating species (C. americanus),
probably to compensate for their daytime starvation.
3.4. MeHg concentrations in crops and in zooplankton
Mean MeHg concentrations in Chaoborus crops ([MeHg]
crop)
ranged from 32 to 51 ng g
!1for the different instars of
C. punctipennis in Lake Croche, and were consistently lower than for
C. americanus and C. trivittatus in Lake Geai, where they ranged
from 70 to 106 ng g
!1(
Table 3
). Cladocerans were the most
contaminated planktonic group, with MeHg levels ranging from 83
to 85 ng g
!1in Lake Croche and 142
e243 ng g
!1in Lake Geai
(
Table 2
). Since they also constituted the main component of crop
biomass for all instars in both lakes (except for C. americanus III),
they represent the main conduit of MeHg contamination for
Chaoborus in these systems. Indeed the least contaminated
chao-borid crop in Lake Geai was associated with C. americanus III,
because it contained 68% of copepods (per weight) and 30% of
cladocerans. Similarly, in Lake Croche, C. punctipennis III ingested
less biomass of prey and fed on less biomass of cladocerans than the
IV instar (
Table 3
). As a result, [MeHg]
cropwas significantly
(p < 0.05) higher in the older instar.
The second largest component of crop biomass, the copepods,
had MeHg levels corresponding to 38
e52% of MeHg levels of
cladocerans (
Table 2
). MeHg content of phytoplankton (SPM) and
rotifers had a limited impact on the overall concentration of MeHg
in Chaoborus crops because of their limited contribution to the total
biomass of prey.
Cladocerans have been identified as important planktonic
conveyor of MeHg (
Back and Watras, 1995
). Since MeHg levels vary
in prey items and between seasons, and since prey selectivity does
not tightly reflect prey composition, our study suggests that prey
contamination cannot be simply derived from MeHg levels in bulk
zooplankton (
Croteau et al., 2003b
). The relative contribution of
prey types in the crop must be taken into account.
Table 1
Location, area, maximum depth, limit of anoxic layer, water chemistry, and dissolved MeHg concentrations in Lake Croche and Lake Geai. Lake Area (ha) Zmax(m) Upper limit (m) of anoxic water layers pH DOC
(mg L!1) TP (mg L!1) TN (mg L!1) DMeHg (ng L!1) S1 S2 S3 Geai 45&5904600N 73&5903500W 0.99 6.5 3 3 2 5.45 7.8 ' 0.53 22.58 ' 0.59 537.2 ' 17.7 0.48 ' 0.2 Croche 45&5903000N 74&0005000W 4.74 12 10 8.5 6.5 6.7 3.42 ' 0.18 5.97 ' 0.94 287.9 ' 32.5 0.04 ' 0.02
ha, hectare; S1 (early June), S2 (late June), S3 (late August), sampling dates; m, meter depth; DOC, dissolved organic carbon; TP, total phosphorus; TN, total nitrogen; DMeHg, dissolved methylmercury; 'SD.
Table 2
MeHg (ng g!1) concentrations in suspended particulate matter (phytoplankton) in size class 0.7e53mm, in rotifers (SPM in size class 53e210mm) and in sorted zooplankton
species at June (S1 and S2) and late August (S3) sampling dates. Number in bold are mean concentrations for major prey types. Lake Geai* Lake Croche**
June (S1, S2) Late August (S3) June (S1, S2) Late August (S3) Phytoplankton (0.7mm < SPM < 53mm) 60.75 ' 20.17 62.17 ' 3.55 29.87 ' 13.56 33.12 ' 3.87 Rotifera (53mm < SPM < 210mm) 64.16 ' 3.16 20.92 ' 7.83a,g 18.10 ' 4.48 20.88 ' 2.78d Copepoda, cyclopoida _ 123.05 ' 24.83b 60.33 ' 5.60 47.08 ' 7.87e Copepoda, calanoida 54.29 ' 9.08 128.97 ' 24.17b,h 36.82 ' 20.67 39.11 ' 20.64e Aglaodiaptomus leptopus 54.29 ' 9.08 128.97 ' 24.17 _ _ Leptodiaptomus minutus _ _ 61.50 ' 4.46 51.32 ' 22.62 Epischura lacustris _ _ 22.01 ' 2.54 26.89 ' 10.29 Cladocera 141.85 ' 22.82 243.26 ' 58.77c,i 85.35 ' 25.22 83.02 ' 18.61f Diaphanosoma sp. 156.77 ' 11.40 _ _ _ Daphnia sp. 119.48 ' 12.46 _ 84.55 ' 21.18 85.15 ' 17.31 Holopedium gibberum _ 253.26 ' 58.77 114.12 ' 15.44 101.35 ' 18.15 (*, **) indicate a significant difference (p < 0.05) of MeHg concentrations in prey resources between lakes. (a, b, c, d, e, f) different letters indicate a significant difference (p < 0.05) of MeHg concentrations between zooplanktonic groups within a lake. (g, h, i) different letters indicate a significant difference (p < 0.05) of MeHg concentrations between June and late August within a taxonomic group of the lake.
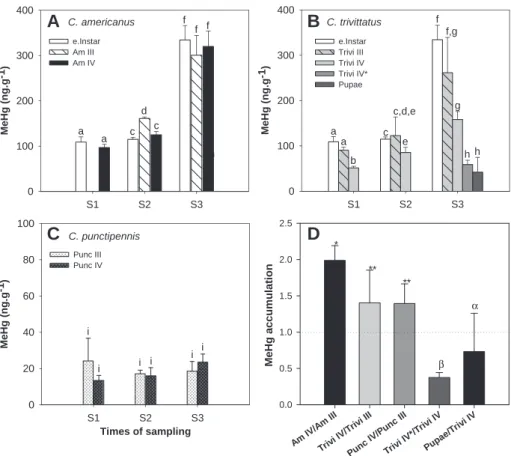
3.5. MeHg contamination of Chaoborus species
MeHg concentrations in C. americanus and C. trivittatus instars
([MeHg]
Chaoborus) in Lake Geai were 3.0e16.6 times higher than in
C. punctipennis instars in Lake Croche (
Fig. 4
A
eC). [MeHg]
Chaoborusin Lake Geai chaoborids presented a marked seasonal pattern
between spring (S1, S2) and summer (S3). MeHg concentrations
increased, exceeding 300 ng g
!1by the end of August whereas
levels remained in the range of 20 ng g
!1for C. punctipennis in Lake
Croche. Instars of C. americanus and of C. punctipennis of different
ages but sampled on the same date did not present significant
difference of MeHg concentration (except C. americanus III at
spring, S2). In contrast, C. trivittatus IV always had a lower (p < 0.05)
level of MeHg than the early instars sampled on the same date.
Instar IV (Trivi IV*) undergoing metamorphosis to pupal stage was
also a major stage of MeHg depuration for C. trivittatus, with a loss
in MeHg concentration of 73%.
We estimated the ability of Chaoborus larvae to accumulate
MeHg during the growing season by the ratio of [MeHg]
instars IVmeasured in late August to [MeHg]
instars IIIin late spring for each
species. These ratios were of 2.04 ' 0.18 for C. americanus,
1.47 ' 0.45 for C. trivittatus and 1.39 ' 0.27 for C. punctipennis,
respectively (
Fig. 4
D). C. americanus accumulated significantly
(p < 0.05) more MeHg during the growing season than the other
species. Ratios higher than 1 indicate that all instars accumulated
MeHg more rapidly than they accumulated biomass from somatic
growth, during the growing season.
As chaoborid species in both lakes shared similar trophic
posi-tions (
Table S4
), food chain length could not explain the greater
contamination of the chaoborid larvae in Lake Geai. Higher
concentration of MeHg at each level of the planktonic food web in
this lake was most likely linked to higher aqueous concentration of
MeHg. In fact, MeHg levels in instars from Lake Geai followed the
same pattern as MeHg in their prey during summer. All chaoborid
Density in the water column (ind.m-3)
-800 -600 -400 -200 0 200 400 600 800 Depth (m) 0
A
B
1 2 3 4 5 6% with prey in crop
-100 -50 0 50 100
Density in water column (ind.m-3) and sediment (ind.m-2)
-800 -600 -400 -200 0 200 400 600 800 Depth (m) 0 1 2 3 4 5 6 7 8 9
% with prey in crop
-100 -50 0 50 100 e. instar Punc III Punc IV % at noon % at night sed e. instar Am III Trivi III Am IV Trivi IV % at noon % at night sed
Fig. 2. Lines indicate the percentages of Chaoborus recorded in mid-June 2010 with at least one prey item in their crop at noon (open circles) and at night (black circles) at each 1-m interval in the water column and in sediment in Lake Geai (A) and in Lake Croche (B). Horizontal bars represent the densities in the water column (m!3) and in the sediment (m!2)
for each species and instar collected at noon (left side) and at night (right side). Legend: e. Instar (Instars I and II), early instar; III, Instar III; IV, Instar IV; Am, C. americanus; Trivi, C. trivittatus; Punc, C. punctipennis.
e. Instar Punc III Punc IV
D
e
p
th
(
m
)
0
2
4
6
8
10
12
e. Instar Am III Trivi III Am IV Trivi IV
D
e
p
th
(
m
)
0
A
B
2
4
6
8
*
*
*
WMD (m) at noon
WMD (m) at night
sediment
Fig. 1. Averaged weight mean depth (WMD) of Chaoborus species and instars at noon (open symbols) and at night (closed symbols) in the water column without sediment calculated for each sampling date (S1, S2, S3) (circles) and in the water column including sediment (diamonds) during the sampling of mid-June 2010 in Lake Geai (A) and in Lake Croche (B). WMD (daytime and at nighttime) was calculated with the equation ofFrost and Bollens (1992). Standard deviation is shown and (*) indicates a significant difference (p < 0.05) between WMD at noon and at night for a given species or instar. Legend: e. Instar, early instar (instars I and II); III, Instar III; IV, Instar IV; Am, C. americanus; Trivi, C. trivittatus; Punc, C. punctipennis.
species accumulated MeHg through their growth and
concentra-tions recorded in Lake Geai were higher by about 45
e16.7 times
than those previously reported for Chaoborus species (
Back and
Watras, 1995
).
Metamorphosis to pupal stage was a major stage of MeHg
depuration (
Fig. 4
D). These results contrast with the trends
reported for some others dipterans for which an increase in the
concentration of MeHg was observed between larvae and prepupae
(
Sarica et al., 2005
) or between larvae and adults (
Bartrons et al.,
2007; Chételat et al., 2008
). Differences in feeding regime or
growth development between taxa could explain part of these
discrepancies. Alternately, physiological differences in metal
distribution could also be involved, since metamorphosis to pupae
induces major histolysis and biosynthesis of tissues (
Arrese and
Soulages, 2010; Boggs, 2009
).
3.6. MeHg biomagnification by chaoborids
C. americanus and C. trivittatus in Lake Geai biomagnified MeHg.
MeHg concentration in C. americanus (III and IV) and C. trivittatus
(III and IV) were in the range of 3.7e5.8 times and of 1.4e2.5 times
higher than in their crop, respectively. In contrast, MeHg levels in
C. punctipennis represented between 40% and 90% of those of their
crop (
Fig. 5
). Early and third instars had higher mean BMFs than
fourth instars (
Fig. 5
); this pattern was significant (p < 0.05) for
C. trivittatus IV and C. punctipennis IV but not for C. americanus IV. In
addition, a general relationship was observed in which the ratio of
weighted mean depths of chaoborids between day and night was
inversely related to the biomagnification factor (R
2adjusted ¼ 0.37,
F ¼ 12.18, p < 0.0026, n ¼ 20). This trend suggests that chaoborids
which migrated the least were the best MeHg biomagnifiers.
e. In star (sed ) Pun c III (sed ) Pun c IV (sed ) e. In star Pun c III Pun c IV 0 5 10 15 20 e. In star Am III Am IV Triv i III Triv i IV
Mean number of prey items in crop
Mean number of prey items in crop
0 5 10 15 20
A
B
(12) (10) (16) (46) (6) (9) (34) (71) (3) (0)(0) (3) (5) (1) (0) (1) (1) (87) (32)Fig. 3. Mean number of prey items ('SD) counted in each crop containing food of Chaoborus instars and species collected in mid-June 2010 in Lake Geai (A) and in Lake Croche (B) at day (white bars) and night (black bars). The number of crops with prey is indicated in parenthesis. Legend: e. Instar (Instars I and II), early instar; III, Instar III; IV, Instar IV; Am, C. americanus; Trivi, C. trivittatus; Punc, C. punctipennis; (sed), sediment.
Table 3
Diet of Chaoborus species based on the analysis of crop contents collected at S1, S2 and S3 sampling dates. Total number of crops analyzed with content, number of prey per crop, total biomass of prey per crop, and biomass and percentage of each prey type category (Rotifera, Copepoda, Cladocera, and Phytoplankton) recorded for each instar and chaoborid species are presented. Mean quantity (pg DW) of prey and mean concentrations (ng DW g!1) of MeHg in crops over the study and at each sampling date are shown.
Chaoborus species Lake Geai Lake Croche
Early instar C. americanus C. trivittatus C. punctipennis
Instar Instar II Instar III Instar IV Instar III Instar IV Instar III Instar IV
No. of crops analyzed 56 65 53 93 43 194 143
Number of prey crop!1' SD
Total 2.58 ' 2.74 1.76 ' 1.32 4.07 ' 6.18 6.96 ' 5.48 5.90 ' 5.01 8.36 ' 9.81 5.98 ' 11.71 Biomass of prey (mg DW) crop!1' SD
Total 1.03 ' 1.24 0.486 ' 0.595 1.04 ' 1.17 2.675 ' 3.68 2.44 ' 2.90 0.555 ' 1.20 1.29 ' 1.88 Rotifera 0.010 ' 0.017 0.009 ' 0.009 0.018 ' 0.017 0.036 ' 0.032 0.026 ' 0.03 0.035 ' 0.04 0.005 ' 0.01 Copepoda 0.398 ' 0.588 0.329 ' 0.434 0.40 ' 0.56 0.63 ' 0.53 0.85 ' 1.04 0.170 ' 0.36 0.318 ' 0.42 Cladocera 0.618 ' 0.978 0.147 ' 0.516 0.61 ' 1.05 2.00 ' 3.65 1.56 ' 2.79 0.346 ' 1.20 0.966 ' 1.88 Phytoplankton 0.000 0.000 0.0006 ' 0.004 0.000 0.000 0.004 ' 0.11 0.005 ' 0.01 Biomass of prey (%) crop!1
Rotifera 1.0 1.9 1.8 1.3 1.1 6.3 0.39
Copepoda 38.8 67.7 38.8 23.7 34.8 30.7 24.54
Cladocera 60.2 30.4 59.3 75.0 64.1 62.4 74.56
Phytoplankton 0.0 0.0 0.1 0.0 0.0 0.6 0.41
Estimated quantity and concentration of MeHg in crops
Mean quantity (pg) 0.17 ' 0.24 0.05 ' 0.10 0.14 ' 0.21 0.42 ' 0.70 1.28 ' 2.65 0.04 ' 0.10 0.10 ' 0.17 Mean concentration (ng g!1) 105.72 ' 77.21 69.91 ' 51.39 96.24 ' 86.48 103.28 ' 62.97 103. ' 66.00 31.9 ' 21.70 50.72 ' 25.88
S1 103.65 ' 32.86 e 89.1 ' 46.63 82.14 ' 47.27 66.36 ' 42.41 26.9 ' 18.49 48.71 ' 20.74 S2 100.95 ' 32.86 66.92 ' 29.62 82.6 ' 42.65 95.57 ' 42.35 92.14 ' 44.07 35.88 ' 24.9 53.42 ' 29.12 S3 111.5 ' 87.76 73.19 ' 68.17 112 ' 106.26 138.72 ' 74.01 141.37 ' 85.6 33.55 ' 20.5 50.33 ' 26.69 NB, number; DW, dry weight; S1, S2, S3, sampling dates.
Decrease in BMF during ontogenic development was
unex-pected, since accumulation increases as a function of age in many
aquatic species (
McIntyre and Beauchamp, 2007
). This ontogenic
BMF decrease was particularly significant in the case of
C. punctipennis (
Fig. 5
) and may be related to an increase in diel
migration with age. C. punctipennis was also the worst biomagnifier
among all studied species, likely because it lived in fish-inhabited
Lake Croche and therefore performed the longest vertical
migra-tions (
Fig. 1
). Similarly, spatial vertical segregation with age reduced
biomagnification capacities of C. trivittatus in the fishless Lake Geai,
as opposed to C. americanus, although both species were able to
feed over day and night (
Figs. 2 and 3
). Surprisingly, C. americanus
which accumulated the most MeHg ingested the lowest quantities
of prey relative to its size (
Table 3
,
Table S1
).
Previous studies have also shown that diel vertical migration
affects the feeding activities of chaoborids (
Croteau et al., 2003b;
Fedorenko, 1975b; McQueen et al., 1999
). Maintenance of higher
feeding rate of C. trivittatus has been proposed as an energetic
bonus in order to compensate for food depletion and lower
metabolism in cold water in hypolimnion during the day
(
Fedorenko, 1972
). In the case of Cd contamination in an
experi-mental context, higher ingestion rates decreased Cd assimilation
efficiency of C. punctipennis, probably due to shorter residence time
of food in the gut (
Munger and Hare, 2000
). In addition, with
a same daily ingestion rate of food,
Croteau et al. (2002)
observed
that low temperatures (5
&C) can also affect Cd assimilation
effi-ciency of food of the small size C. punctipennis but not of
C. americanus.
Am IV/A mIII Trivi I V/Tr ivi III Punc IV/P unc III Triv i IV* /Triv i IV Pupa e/Tr ivi IV MeHg accumulation 0.0 0.5 1.0 1.5 2.0 2.5 S1 S2 S3 M e H g ( n g .g -1) 0 100 200 300 400A
B
D
C
e.Instar Am III Am IV Times of sampling S1 S2 S3 M e H g (n g .g -1) 0 20 40 60 80 100 Punc III Punc IV a a c d c e f f h C. americanus C. punctipennis f i i i i i i * ** ** α β S1 S2 S3 M e H g ( n g .g -1) 0 100 200 300 400 e.Instar Trivi III Trivi IV Trivi IV* Pupae c,d,e C. trivittatus a a b e f f,g g h h cFig. 4. Mean concentrations ('SD) of MeHg (ng g!1) in instars of each Chaoborus species in Lake Geai (A, B) and in Lake Croche (C) at each sampling date (S1, S2, S3). Different letters
(a, b, c, d, e, f, g, h, i) indicate a significant difference (p < 0.05) among species and instars within and between lakes. (D) MeHg accumulation through ontogenetic development of each species calculated based on the ratio between fourth instar collected in late August and the third instar collected at the end of June ([MeHg]instarIVS3/[MeHg]instarIIIS2).
Different numbers of stars indicate a significant difference (p < 0.05) between species. MeHg accumulation between different metamorphic stages collected in late August is also provided for C. trivittatus.aandbindicate a significant difference (p < 0.05) between metamorphic stages. Legend: e. Instar, early instar; III, Instar III; IV, Instar IV; Am, C. amer-icanus; Trivi, C. trivittatus; Punc, C. punctipennis; Trivi IV*, instar of C. trivittatus IV* passing through pupal stage; Pupae, pupal stage.
C ha obor us : Log 1 0 (BMF ) -1.0 -0.5 0.0 0.5 1.0 1.5 a a a a, b b c d Croche Geai Punc IV Punc III Trivi IV Trivi III Am IV Am III e. Instar
Fig. 5. Range of Log10biomagnification factors (BMFs) of Chaoborus larvae in Lake Geai
and in Lake Croche over S1, S2, S3 sampling dates. From each crop analyzed (summarized inTable 3), each BMF was calculated based on the log of the ratio between the mean concentration of MeHg measured in each Chaoborus species and instars and the specific concentration of MeHg estimated in each crop contents collected at the same date. Top and bottom horizontal lines of the box indicate the 75th and 25th percentiles. The horizontal line in the box represents median. Closed circles indicate extreme data. Different letters show significant differences (p < 0.05) in log10
(BMF) between instars. Legend: e. Instar, early instar; III, Instar III; IV, Instar IV; Am, C. americanus; Trivi, C. trivittatus; Punc, C. punctipennis.
We propose that the onset of diel vertical migration causes
segregation between refuge habitat and resource habitat, restrain
dwelling chaoborids to cooler temperatures which affects their
feeding activities. Both higher ingested amounts of prey at night in
upper limnetic strata and cooler temperature during the day in
lower limnetic strata could reduce assimilation efficiency of MeHg.
This study is the first to report that Chaoborus species are able to
biomagnify MeHg along food webs (
Fig. 5
). Differences in
bio-magnification potential between species could neither be linked to
a shift in diet nor to a variation of trophic position in or among
lakes: species and instars fed on similar prey category (
Table 3
) and
occupied a similar trophic level according to
d
15N stable isotope
analysis (
Table S4
). Rather, our data (
Figs. 1 and 5
and
Table 3
)
support the concept that biomagnification capacities of Chaoborus
species are affected by the magnitude of diel vertical migration.
Behavioral processes which can affect feeding activities and/or food
assimilation are still poorly investigated in lower trophic level of
pelagic food web. Our findings emphasized that they should not be
underestimated in order to improve our understanding of transfers
and pathways of MeHg at the base of pelagic food webs.
Acknowledgments
We thank the two anonymous reviewers for their informed
comments that help to improve the manuscript. This study was
funded by CRSNG to MA and BPA. We are grateful for the
Govern-ment of Canada Post-Doctoral Research Fellowships (PDRF) to AHLJ.
We thank the staff of the Station Biologique des Laurentides for
their technical assistance, and also J. Mercier, C. Girard, Marie-Eve
Perron, S. Fauteux, J. Nzieleu, P.A. Bouyou for their support in
field sampling. Special thanks to G. Méthot and D. Belanger for their
assistance in field and at the laboratory.
Appendix A. Supplementary material
Supplementary material associated with this article can be
found, in the online version, at
doi:10.1016/j.envpol.2012.02.003
.
References
Arrese, E.L., Soulages, J.L., 2010. Insect fat body: energy, metabolism, and regulation. Annual Review of Entomology 55, 207e225.
Back, R.C., Watras, C.J., 1995. Mercury in Zooplankton of Northern Wisconsin Lakes e Taxonomics and Site-specifics Trends. Kluwer Academic Publ. pp. 931e938.
Bartrons, M., Grimalt, J.O., Catalan, J., 2007. Concentration changes of organochlo-rine compounds and polybromodiphenyl ethers during metamorphosis of aquatic insects. Environmental Science & Technology 41, 6137e6141. Bloom, N., 1989. Determination of picogram levels of methylmercury by aqueous
phase ethylation, followed by cryogenic gas-chromatography with cold vapor atomic fluorescence detection. Canadian Journal of Fisheries and Aquatic Sciences 46, 1131e1140.
Boggs, C.L., 2009. Understanding insect life histories and senescence through a resource allocation lens. Functional Ecology 23, 27e37.
Cabana, G., Rasmussen, J.B., 1996. Comparison of aquatic food chains using nitrogen isotopes. Proceedings of the National Academy of Sciences of the United States of America 93, 10844e10847.
Cabana, G., Tremblay, A., Kalff, J., Rasmussen, J.B., 1994. Pelagic food-chain structure in Ontario lakese a determinant of mercury levels in lake trout (Salvelinus namaycush). Canadian Journal of Fisheries and Aquatic Sciences 51, 381e389. Chételat, J., Amyot, M., Cloutier, L., Poulain, A., 2008. Metamorphosis in
chirono-mids, more than mercury supply, controls methylmercury transfer to fish in high Arctic lakes. Environmental Science & Technology 42, 9110e9115. Chetelat, J., Amyot, M., Garcia, E., 2011. Habitat-specific bioaccumulation of
meth-ylmercury in invertebrates of small mid-latitude lakes in North America. Environmental Pollution 159, 10e17.
Clarkson, T.W., 2002. The three modern faces of mercury. Environmental Health Perspectives 110, 11e23.
Cremona, F., Planas, D., Lucotte, M., 2008. Assessing the importance of macro-invertebrate trophic dead ends in the lower transfer of methylmercury in littoral food webs. Canadian Journal of Fisheries and Aquatic Sciences 65, 2043e2052.
Croteau, M.N., Hare, L., Tessier, A., 2002. Influence of temperature on Cd accumu-lation by species of the biomonitor Chaoborus. Limnology and Oceanography 47, 505e514.
Croteau, M.N., Hare, L., Marcoux, P., 2003a. Feeding patterns of migratory and non-migratory fourth instar larvae of two coexisting Chaoborus species in an acidic and metal contaminated lake: importance of prey ingestion rate in predicting metal bioaccumulation. Archiv Fur Hydrobiologie 158, 57e74.
Croteau, M.N., Hare, L., Tessier, A., 2003b. Difficulties in relating Cd concentrations in the predatory insect Chaoborus to those of its prey in nature. Canadian Journal of Fisheries and Aquatic Sciences 60, 800e808.
Dawidowicz, P., Pijanowska, J., Ciechomski, K., 1990. Vertical migration of Chaobo-rus larvae is induced by the presence of fish. Limnology and Oceanography 35, 1631e1637.
Driscoll, C.T., Han, Y.J., Chen, C.Y., Evers, D.C., Lambert, K.F., Holsen, T.M., Kamman, N.C., Munson, R.K., 2007. Mercury contamination in forest and freshwater ecosystems in the Northeastern United States. Bioscience 57, 17e28. Eagles-Smith, C.A., Suchameck, T.H., Colwell, A.E., Anderson, N.L., 2008. Mercury trophic transfer in a eutrophic lake: the importance of habitat-specific foraging. Ecological Applications 18, A196eA212.
Fedorenko, A.Y., 1972. Feeding characteristics and predation impact of Chaoboms (Diptera, Chaoboridae) larvae in a small lake. Limnology and Oceanography 20, 250e258.
Fedorenko, A.Y., 1975a. Instar and species-specific diets in two species of Chaoborus. Limnology and Oceanography 20, 238e249.
Fedorenko, A.Y., 1975b. Instar and species-specific diets in two species of Chaobo-rus. Limnology and Oceanography 20, 238e245.
Fleming, E.J., Mack, E.E., Green, P.G., Nelson, D.C., 2006. Mercury methylation from unexpected sources: molybdate-inhibited freshwater sediments and an iron-reducing bacterium. Applied and Environmental Microbiology 72, 457e464. Frost, B.W., Bollens, S.M., 1992. Variability of diel vertical migration in the marine
planktonic copepod Pseudocalanus newmani in relation to its predators. Cana-dian Journal of Fisheries and Aquatic Sciences 49, 1137e1141.
Garcia, E., Carignan, R., 1999. Impact of wildfire and clear-cutting in the boreal forest on methyl mercury in zooplankton. Canadian Journal of Fisheries and Aquatic Sciences 56, 339e345.
Garcia, E.A., Mittelbach, G.G., 2008. Regional coexistence and local dominance in Chaoborus: species sorting along a predation gradient. Ecology 89, 1703e1713. Gilmour, C.C., Henry, E.A., Mitchell, R., 1992. Sulfate stimulation of mercury meth-ylation in fresh-water sediments. Environmental Science & Technology 26, 2281e2287.
Gorski, P.R., Cleckner, L.B., Hurley, J.P., Sierszen, M.E., Armstrong, D.E., 2003. Factors Affecting Enhanced Mercury Bioaccumulation in Inland Lakes of Isle Royale National Park. Elsevier Science Bv., USA, pp. 327e348.
Guentzel, J.L., 2009. Wetland influences on mercury transport and bioaccumulation in South Carolina. The Science of the Total Environment 407, 1344e1353. Harris, R.C., Rudd, J.W.M., Amyot, M., Babiarz, C.L., Beaty, K.G., Blanchfield, P.J.,
Bodaly, R.A., Branfireun, B.A., Gilmour, C.C., Graydon, J.A., Heyes, A., Hintelmann, H., Hurley, J.P., Kelly, C.A., Krabbenhoft, D.P., Lindberg, S.E., Mason, R.P., Paterson, M.J., Podemski, C.L., Robinson, A., Sandilands, K.A., Southworth, G.R., Louis, V.L.S., Tate, M.T., 2007. Whole-ecosystem study shows rapid fish-mercury response to changes in mercury deposition. Proceedings of the National Academy of Sciences of the United States of America 104, 16586e16591.
Hillebrand, H., Durselen, C.D., Kirschtel, D., Pollingher, U., Zohary, T., 1999. Bio-volume calculation for pelagic and benthic microalgae. Journal of Phycology 35, 403e424.
Kelly, C.A., Rudd, J.W.M., Holoka, M.H., 2003. Effect of pH on mercury uptake by an aquatic bacterium: implications for Hg cycling. Environmental Science & Technology 37, 2941e2946.
Lagergren, R., Leberfinger, K., Stenson, J.A.E., 2008. Seasonal and ontogenetic variation in diel vertical migration of Chaoborus flavicans and its effect on depth-selection behavior of other zooplankton. Limnology and Oceanography 53, 1083e1092. Malley, D.F., Lawrence, S.G., Finlay, W.J., 1989. Range of variation in estimates dry
weight for planktonic Crustacea and Rotifera from temperate North American Lakes. Canadian Technical Report of Fisheries and Aquatic Sciences 1666, 49p. Mason, R.P., Laporte, J.M., Andres, S., 2000. Factors controlling the bioaccumulation of mercury, methylmercury, arsenic, selenium, and cadmium by freshwater invertebrates and fish. Archives of Environmental Contamination and Toxi-cology 38, 283e297.
Masson, S., Pinel-Alloul, B., 1998. Spatial distribution of zooplankton biomass size fractions in a bog lake: abiotic and (or) biotic regulation? Canadian Journal of Zoology-Revue Canadienne De Zoologie 76, 805e823.
Masson, S., Pinel-Alloul, B., Dutilleul, P., 2004. Spatial heterogeneity of zooplankton biomass and size structure in southern Quebec lakes: variation among lakes and within lake among epi-, meta- and hypolimnion strata. Journal of Plankton Research 26, 1441e1458.
McIntyre, J.K., Beauchamp, D.A., 2007. Age and trophic position dominate bio-accumulation of mercury and organochlorines in the food web of Lake Wash-ington. The Science of the Total Environment 372, 571e584.
McQueen, D.J., Ramcharan, C.W., Demers, E., Yan, N.D., Conforti, L.M., Perez-Fuentetaja, A., 1999. Chaoborus behavioural responses to changes in fish density. Archiv Fur Hydrobiologie 145, 165e179.
Morel, F.M.M., Kraepiel, A.M.L., Amyot, M., 1998. The chemical cycle and bio-accumulation of mercury. Annual Review of Ecology and Systematics 29, 543e566.
Munger, C., Hare, L., 2000. Influence of ingestion rate and food types on cadmium accumulation by the aquatic insect Chaoborus. Canadian Journal of Fisheries and Aquatic Sciences 57, 327e332.
Paterson, M.J., Rudd, J.W.M., St Louis, V., 1998. Increases in total and methylmercury in zooplankton following flooding of a peatland reservoir. Environmental Science & Technology 32, 3868e3874.
Persaud, A.D., Dillon, P.J., 2010. Ontogenetic differences in isotopic signatures and crop contents of Chaoborus. Journal of Plankton Research 32, 57e67. Pickhardt, P.C., Folt, C.L., Chen, C.Y., Klaue, B., Blum, J.D., 2002. Algal blooms reduce
the uptake of toxic methylmercury in freshwater food webs. Proceedings of the National Academy of Sciences of the United States of America 99, 4419e4423. Power, M., Klein, G.M., Guiguer, K., Kwan, M.K.H., 2002. Mercury accumulation in the fish community of a sub-Arctic lake in relation to trophic position and carbon sources. Journal of Applied Ecology 39, 819e830.
Rencz, A.N., O’Driscoll, N.J., Hall, G.E.M., Peron, T., Telmer, K., Burgess, N.M., 2003. Spatial variation and correlations of mercury levels in the terrestrial and aquatic components of a wetland dominated ecosystem: Kejimkujik Park, Nova Scotia, Canada. Water Air and Soil Pollution 143, 271e288.
Roy, V., Amyot, M., Carignan, R., 2009. Beaver ponds increase methylmercury concentrations in Canadian shield streams along vegetation and pond-age gradients. Environmental Science & Technology 43, 5605e5611.
Saether, O.A., 1972. Das Zooplankton der Binnengewässer. E. Schweizer-bart’scheVerlagsbuchhandlung Stuttgart, pp. 257e304.
St. Louis, V.L., Rudd, J.W.M., Kelly, C.A., Beaty, K.G., Flett, R.J., Roulet, N.T., 1996. Production and loss of methylmercury and loss of total mercury from boreal forest catchments containing different types of wetlands. Environmental Science & Technology 30, 2719e2729.
Sarica, J., Amyot, M., Bey, J., Hare, L., 2005. Fate of mercury accumulated by blowflies feeding on fish carcasses. Environmental Toxicology and Chemistry 24, 526e529.
Voss, S., Mumm, H., 1999. Where to stay by night and day: size-specific and seasonal differences in horizontal and vertical distribution of Chaoborus flavi-cans larvae. Freshwater Biology 42, 201e213.
Vrede, K., Vrede, T., Isaksson, A., Karlsson, A., 1999. Effects of nutrients (phos-phorous, nitrogen, and carbon) and zooplankton on bacterioplankton and phytoplankton e a seasonal study. Limnology and Oceanography 44, 1616e1624.
Watras, C.J., Back, R.C., Halvorsen, S., Hudson, R.J.M., Morrison, K.A., Wente, S.P., 1998. Bioaccumulation of mercury in pelagic freshwater food webs. The Science of the Total Environment 219, 183e208.
Watras, C.J., Morrison, K.A., Bloom, N.S., 1995a. Chemical correlates of Hg and Methyl-hg in Northern Wisconsin lake waters under ice-cover. Water Air and Soil Pollution 84, 253e267.
Watras, C.J., Morrison, K.A., Host, J.S., Bloom, N.S., 1995b. Concentration of mercury species in relationship to other site-specific factors in the surface waters of Northern Wisconsin Lakes. Limnology and Oceanography 40, 556e565.