O
pen
A
rchive
T
OULOUSE
A
rchive
O
uverte (
OATAO
)
OATAO is an open access repository that collects the work of Toulouse researchers and
makes it freely available over the web where possible.
This is an author-deposited version published in :
http://oatao.univ-toulouse.fr/
Eprints ID : 10454
To link to this article : DOI:10.1016/j.chroma.2012.07.065
URL : http://dx.doi.org/10.1016/j.chroma.2012.07.065
To cite this version : Foan, Louise and Simon, Valérie. Optimization of pressurized liquid extraction
using a multivariate chemometric approach and comparison of solid phase extraction cleanup steps
for the determination of polycyclic aromatic hydrocarbons in mosses. (2012) Journal of
Chromatography A, vol. 1256 . pp. 22-31. ISSN 0021-9673
Any correspondance concerning this service should be sent to the repository
administrator: [email protected]
Optimization of pressurized liquid extraction using a multivariate chemometric
approach and comparison of solid-phase extraction cleanup steps for the
determination of polycyclic aromatic hydrocarbons in masses
a Université de Toulouse,INPT, LO\ (Laboratoire de Chimie Agro-lndustrielle), ENSIACEf, 4 Allée Emile Manso, F-31030 Toulouse, Franceb INRA; LO\ (Laboratoire de Chimie Agro-Industrielle), F-31030 Toulouse, France
ABSTRACT
Keywords:
Polycyclic aromatic hydrocarbon Moss
Pressurized liquid extraction Solid phase extraction
High performance liquid chromatography Biomonitoring
A factorial design was used to optimize the extraction ofpolycyclic aromatic hydrocarbons (PAHs) from mosses, plants used as biomonitors of air pollution. The analytical procedure consists of pressurized liquid extraction (PLE) followed by solid-phase extraction (SPE) cleanup, in association with analy-sis by high performance liquid chromatography coupled with fluorescence detection (HPLC-FLD). For method development, homogeneous samples were prepared with large quantities of the mosses Isothe-dum myosuroides Brid. and Hypnum cupressiforme Hedw., collected from a Spanish Nature Reserve. A factorial design was used to identify the optimal PLE operational conditions: 2 static cycles of 5 min at
sooc.
The analytical procedure performed with PLE showed similar recoveries (~70%) and total PAH concentrations ( ~200 ng g-1 ) as found using Soxtec extraction, with the ad van tage of reducing solvent consumption by 3 (30 mL against 100 mL per sample ), and taking a fifth of the time (24 samples extracted automatically in 8 h against 2 samples in 3.5 h). The performance of SPE normal phases {NH2, Florisi!®, silica and activated aluminium) generally used for organic matrix cleanup was also compared. FlorisiJ® appeared to be the most selective phase and ensured the highest PAH recoveries. The optimal analytical procedure was validated with a reference material and applied to moss samples from a remote Spanish site in order to determine spatial and inter-species variability.1. Introduction
Polycyclic aromatic hydrocarbons (PAHs) are products of ther-mal decomposition, formed during incomplete combustion of organic materials and geochemical formation of fossil fuels. The main anthropogenic sources are power plants, domestic heating, waste incineration, industrial processes and, most importantly, motor vehicle exhaust emissions [1-3]. PAHs are considered to be persistent organic pollutants (POPs) due to their slow rates of degradation, toxicity and potential for both long-range transport and bioaccumulation in living organisms [4]. Carcinogenic, muta-genie and immunotoxic effects of PAHs, detrimental to human health, have frequently been reported [1,5]. Regulation of PAH emissions and reliable monitoring of PAH concentrations in ambi-ent air is thus ofparamount importance for public health.
• Corresponding author at: Université de Toulouse, INPT, LCA (Laboratoire de Chimie Agro-Industrielle), ENSIACET, 4 Allée Emile Monso, F-31030 Toulouse, France. Tel.: +33 534 323 552; fax: +33 534 323 597.
E-mail address: [email protected] (V. Simon).
Atmospheric PAH levels are monitored by collecting atmo-spheric particles and gases with high or low volume sam piers, and PAH deposition is evaluated by sampling bulk deposition and/or wet deposition in collectors [ 4,6, 7]. However, the sampling deviees have severa! drawbacks such as low sample representativeness, analytical difficulties (trace levels), cost and maintenance of equip-ment. Conversely, monitoring using biological samples appears to be a low cost alternative that can be easily developed globally. For this reason, plants are widely used as airborne pollution biomon-itors in urban and rural environments [8]. The most common are herbaceous species [9], deciduous tree leaves [10], persistent tree leaves [11], coniferous needles [4,12], tree bark [13],lichens [14,15]
and mosses [4,15,16].
Bryophytes in particular have been used over the past decade as biomonitors for the assessment of airborne pollutant deposi-tion: heavy metals [17], radionuclides [18], nitrogen [19], natural abundance of C, N and S isotopes [20,21] and POPs [16,22-24].
As they do not have any root system or cuticle, mosses obtain most oftheir nutrients from the atmosphere. Moreover, their high cationic exchange capacity and surface to volume ratio favours the accumulation of large amounts of pollutants [25]. The Inter-national Cooperative Programme on Effects of Air Pollution on
Natural Vegetation and Crops (!CP-Vegetation), established under the United Nations Economie Commission for Europe (UNECE) Convention on Long-Range Transboundary Air Pollution (LRTAP), has monitored heavy metal deposition in Europe with masses since 1990 [17]. A pilot study was initiated by !CP-Vegetation in 2010 to monitor POPs, particularly PAHs, at a European scale. Therefore, development of a fast and efficient analytical procedure for determining PAHs in masses is necessary.
PAH determination in masses is currently undertaken by sol vent extraction followed by a cleanup step, associated with chromato-graphie analysis. Traditional extraction procedures using Soxhlet
[26-28] or Soxtec apparatus [15,29] do not provide enough energy to release the analytes rapidly and therefore require long extrac-tion times (3.5-24h) and large amounts of organic solvents (100-200mL). Thus, sonication extraction [25,30], microwave-assisted sol vent extraction [ 31] and pressurized liquid extraction (PLE) [32-34], have been proposed as alternatives, with extrac-tion taking on average 30 min with 20-30 mL of solvent. However, sonication extraction has the drawback of not being automated and, even though the microwave apparatus extracts 40 samples simultaneously, an extra filtration step is necessary to separate the matrix residues from the solvent. By comparison, PLE can perform 24 sequential extractions, with no further treatment.
With PLE also called accelerated solvent extraction (ASE) -extractions can be performed at high temperatures, since the sol-vents remain in a liquid state under the high pressures applied, ensuring high analyte recoveries [35]. Static extraction tempera-ture, time and number of cycles appear to be critical experimental parameters [36-38]. Indeed, temperature hasan effect on the sol-ventviscosity and thereby its ability to wet the matrix and solubilise the target analytes, and certain sample matrices can retain ana-lytes within pores or other structures, thus increasing extraction time allows these compounds to diffuse into the extraction sol-vent. Finally, the use of static cycles was developed to introduce fresh solvent during the extraction process, which helps main-tain favourable extraction equilibrium, without diluting the sample (sin ce the flush volume is the same whatever the number of cycles). The effect of pressure is to main tain the solvents as liquids above their atmospheric boiling point, and the pressures used in PLE are weil above the thresholds required to main tain the solvents in the liquid phase. Changing the pressure has very little impact on ana-lyte recovery, so it seems unnecessary to optimize this parameter.
Severa! optimization procedures for PAH extraction by PLE on plantbiomonitors such as masses [34] and pine needles [39,40] are available in the literature, and the univariate approach was used in the se studies: one parameter was optimized while the others were set at a convenient value. However, operational parameters may interact, making it necessary to use a multivariate chemometric approach for developing the analytical method.
Selectivity is a necessary condition for obtaining reliable chro-matographie results [41]. Therefore, solid-phase extraction (SPE) cleanup is usually employed to separate co-extracted matrix com-pounds from the target analytes as they may interfere during final determination [40,42]. Moreover, the isolation of target com-pounds from plant co-extracts, appears to be highly important when analyzing PAHs by high performance liquid chromatogra-phy coupled to fluorescence detection {HPLC-FLD) [39]. To date, no study covering comparison of SPE cleanup steps of moss extracts has been published.
In arder to facilita te the use of masses as bioindicators of organic airborne pollution, this study offers a fast, law solvent consuming and effective analytical procedure for PAH determination in these plants. PLE operating conditions were optimized with a factorial design and PAH recoveries were compared with those obtained by Soxtec extraction, whose efficiency was demonstrated in a previous study [29]. Moss extracts obtained under optimal PLE conditions
were subsequently submitted to severa! normal phase SPE, in arder to reveal the most efficient cleanup, i.e. the one offering the highest recoveries and the best selectivity. Finally, after verifying the accu-racy of the optimal analytical procedure using reference material, the method was applied to moss sam pies from a mountainous area in Spain to determine spatial and inter-species variability on the site.
2. Experimental
2.1. Materials and reagents 2.1.1. Moss samples
To develop the analytical procedure, Pleurocarpous masses Isothedum myosuroides Brid. and Hypnum cupressiforme Hedw. were collected in the Bertiz Nature Reserve (Navarra, Spain) between 2008 and 201 O. The former was used for optimizing the extraction procedure and the latter for finding the most efficient cleanup. Two different species were used, because large amounts of material were needed to develop the analytical procedure, and the Nature Reserve authorities limit the quantity of masses sampled, for conservation reasons. Ali analyses were performed on homoge-neous material (cf. Section 2.2) prepared with composite samples. Approximately 0.5 m2 of each species was collected, giving 50 and
25 g (dry weight) of 1. myosuroides Brid. and H. cupressiforme Hedw. respectively.
After validation, the optimal parameters were applied to moss samples collected in june 2010 from a law-alpine site in the Aralar Range {Navarra, Spain). The aim of the study was to validate the use orthe moss species Hylocomium splendens (Hedw.) Schimp. for monitoring atmospheric deposition ofPAHs in a rural environment. Initially, spatial variability in sampling was evaluated by collect-ing 9 samples from the same site (~0.02m2 per sample), and the PAH levels were compared with those of H. cupressiforme Hedw., because the latter had been used in a previous study for monitor-ing atmospheric deposition of PAHs in Navarra [29]. To this end, samples of H. cupressiforme (~0.04m2 per sample) were taken at
the same site as H. splendens. Masses were collected under the surveillance of the Navarra authorities, and due to its scarcity in the Aralar Range, a maximum of only 3 sam pies of H. cupressiforme was allowed.
2.1.2. Chemicals and standards
A standard mix containing acenaphthene {ACE), fluorene {FLR), phenanthrene {PHE), anthracene {ANT), fluoranthene (FTN), pyrene {PYR), benz(a)anthracene (B(a)A), chrysene {CHR), benzo(b)fluoranthene (B(b)F), benzo(k)fluoranthene (B(k)F), benzo(a)pyrene (B(a)P), dibenz(a,h)anthracene (D(ah)A), and benzo(ghi)perylene (B(ghi)P) at 101J.gmL-1 of acetonitrile, was
used for calibration {Mix 16 HAP, LGC Standards, Teddington, UK). Deuterated PAHs were used as surrogate standards (anthracene d10 and benzo(a)pyrene d12 at 101J.gmL-1 in acetonitrile) and as
internai standard (fluoranthene d10 at 100 1-Lg mL -1 in acetonitrile)
{LGC Standards, Teddington, UK).
A reference material IAEA-140-0C (35 g) {ANALAB, Bischheim, France), consisting of a common brown seaweed (Fucus sp.) and characterized for the mass fractions of certain organic contami-nants, was used to evalua te the accuracy of the analytical method. The International Atomic Energy Agency supplies reference values for organochlorine pesticides, PCB congeners, petroleum hydro-carbons and PAHs for this material, based on an international inter-laboratory comparison [43].
Ali solvents were HPLC grade: acetonitrile, cyclohexane, dichloromethane (DCM) and n-hexane were provided by Scharlau
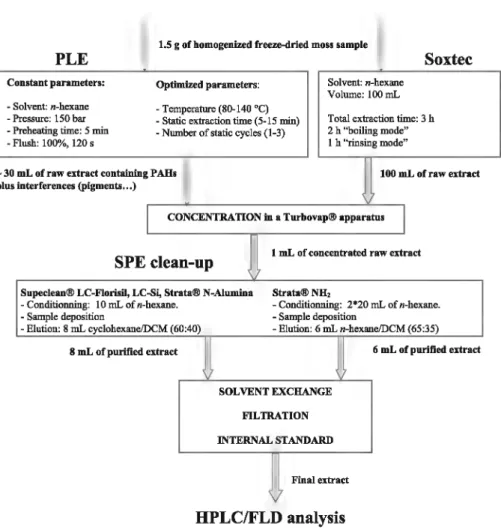
1.5 g of homogenized freeze-dried moss sample
PLE
Constant parameters: Optimized parameters: Solvent: n-hexane Volume: 100 mL
Soxtec
- Solvent: n-hexane - Pressure: 150 bar
-Temperature (80-140 oq
Total extraction time: 3 h 2 h "holling mode" - Static extraction time (5-15 min)
- Preheating time: 5 min - Number of static cycles (1-3)
1 h ''rinsing mode" -Flush: 100"/o, 120 s
- 30 mL of raw extract containing P AHs plus interferences (pigments .•• )
SPE clean-up
Supeclean® LC-Florisil, LC-Si, Strata® N-Alumina - Conditionning: 10 mL of n-hexane.
- Sample deposition
- Elution: 8 mL cyclohexane/DCM (60:40) 8 mL of purified extract
100 mL ofraw extract
1 mL of concentrated raw extract
Strata®NH2 - Conditionning: 2*20 mL of n-hexane. - Sarnple deposition - Elution: 6 mL n-hexane/DCM (65:35) 6 mL of purified extract SOLVENTEXCHANGE FILTRATION INTERNAL STANDARD Final extract
HPLCIFLD analysis
Fig. 1. Diagram illustrating ali operations of the analytical procedure to optimize PAH determination in masses.
(Sentmenat, Spain) and Milli-Q water by Millipore (Billerica, MA, USA).
2.2. Sample preparation
Any litterfan (dead leaves, twigs ... ) attached to the moss sam-pies was removed with stainless steel tweezers. The green and green-brown shoots from the last three years growth were with-drawn using stainless steel tweezers and scissors. Brown parts were not included in the samples, even if the remaining green parts rep-resented Jess than three years of growth.
The unwashed samples were freeze-dried - recommended to minimize Joss of volatile compounds during preparation [44,45] -with an Alpha 2-4 LD apparatus for 24 h {Martin Christ, Osterode am Harz, Germany). To obtain homogeneous samples, the lyophilized mosses were ground to a fine powder in a stainless steel mill (par-ticle size < 0.5 mm).
2.3. Solvent extraction and SPE cleanup
First, PLE was optimized and compared with previously vali-dated Soxtec extraction [29]. Then, during a second phase, different sorbent phases were compared for the SPE cleanup. The analytical procedure is shown in Fig. 1.
2.3.1. Pressurized liquid extraction
PLE extractions were performed with an ASE 200 apparatus (DIONEX, Sunnyvale, CA, USA). Homogenized moss sam pies of 1.5 g were extracted in 11 mL stainless steel cens with O. 75 g of anhy-drous sodium sulfate and 0.75g ofFlorisiJ® (activated magnesium
silicate) from U.S. Si! ica Company (Berkeley Springs, USA). The sor-bents were layered at the out! et of the extraction cens. Anhydrous sodium sulfate was used to ensure total dryness ofthe cen content to avoid problems of water immiscibility with non polar solvents. FlorisiJ® was used to retain co-extracted polar compounds which could interfere with PAHs during analysis. In-line selective removal of interferences avoids drastic post-extraction cleanup steps [46]. Each sam pie was spiked with 50 ng of surrogate standards ANT d10
and B(a)P d12 , chosen to estimate the recoveries of the light PAH
fraction (ACE to PYR) and heavy PAH fraction (B(a)A to B(ghi)P), respectively.
Extractions were carried out with n-hexane at a pressure of 150 bar. The cens were preheated for 5 min to reach thermal equi-librium, then were submitted to one or severa! static extraction cycles. After each cycle, the cens were flushed with a volume offresh solvent corresponding to 100% of the cen volume divided by the number of cycles. Finany, at the end of the extraction process, the cens were purged with purified nitrogen for 120 s. The solvent and fixed operational parameters were chosen in the light of a previous study [34] that demonstrated their efficiency for PLE extraction of PAHs from mosses.
Nonpolarfpolar solvent mixtures such as DCM/acetone or
n-hexanefacetone have shown high PAH recoveries in previous PLE studies performed on environmental samples [39,47]. However, high co-extraction of matrix polar compounds such as pigments and lipids was also observed. Hence, with polar solvents, a more drastic cleanup procedure is necessary to ensure interference free chromatographie analysis. Th us the choice of a non-polar solvent, such as n-hexane, for PLE extraction seems preferable to obtain lighter extracts containing low matrix residue content. This solvent
Tablel
Central factorial design used for the PLE optimization ofPAH extraction from masses.
Experiment no. Temperature, Static time, Numberof
T{OC) t,(min) cycles,N
1 80 5 1 2 80 5 3 3 80 15 3 4 80 15 5 140 5 1 6 140 5 3 7 140 15 1 8 140 15 3 9 80 5 1 10 80 5 3 11 80 15 3 12 80 15 1 13 140 5 1 14 140 5 3 15 140 15 1 16 140 15 3 17 110 10 2 18 110 10 2
also has the advantage ofbeing highly volatile, ensuring a fast con-centration step, and is compatible with the normal cleanup phases.
The PLE experimental design was developed to identify the optimal values of static extraction temperature, static time and number of static cycles. Severa! studies concerning PLE applied to bioindicators for PAH determination use operating temperatures from 80 to 140°C, static extraction times of 5-15min and a maximum of 3 cycles [33,34,39]. These limits were assigned to each variable for the experimental design (Table 1 ).
Before SPE cleanup, the extracts were concentrated to 1 mL with purified N2 (Alpha 1, Air Liquide, Paris, France) in a Turbovap II
apparatus (Caliper Life Sciences, Hopkinton, MA, USA). 2.3.2. Soxtec extraction
The extractions were performed with a Soxtec System HT2 (Tecator, France). 1.5 g moss samples spiked with 50 ng of surrogate standards were extracted in cellulose thimbles with O. 75 g of anhy-drous sodium sulfate and 0.75 g of Florisil® (U.S. Silica Company, Berkeley Springs, USA).
Extractions were carried out with 100 mL ofn-hexane. The thim-bles were first immersed in the boiling solvent for 2 h and then raised above the solvent to be rinsed for 1 h by the condensing solvent.
Before SPE cleanup, the extracts were concentrated to 1 mL with purified N2 (Alpha 1, Air Liquide, Paris, France) in a Turbovap II
apparatus (Caliper Life Sciences, Hopkinton, MA, USA). 2.3.3. SPE cleanup procedure
During the PLE optimization and validation, cleanup was per-formed with Florisil® SPE cartridges (Supelclean LC-Florisil SPE 1 g/6 mL from Su peleo Analytical, Sigma-Aldrich, St. Louis, MO, USA). The use of these cartridges and their elution protocol has been validated previously [29].
During the second stage of the study, cleanup using severa! nor-mal phase SPE cartridges was tested: Supelclean LC-Florisil SPE 1 gf6mL and Supelclean LC-Si SPE 1 gf6mL from Supelco Analyt-ical (Sigma-Aldrich, St. Louis, MO, USA); Strata NH2 1 g/6 mL and
Strata Alumina-N 120 J..Lm, 120A, 1 g/6 mL from Phenomenex (Le Pecq, France). Cartridges of the same volume were chosen, with equal sorbent mass.
The SPE was performed using a Supelco manifold (Sigma-Aldrich, St. Louis, MO, USA). The LC-Florisil, LC-Si and N-Alumina cartridges were conditioned with 10 mL of n-hexane, the NH2 cartridges with 2x 20 mL of n-hexane. After sample
depo-sition, PAH elution was performed with 8 mL of cyclohexane/DCM
(60:40, vfv) for the first three cartridges containing polar adsorp-tion media and with 6 mLofn-hexane/DCM (65:35, vfv) forthe NH2
bonded cartridges. The elution protocols were based on previous studies ofSPE cleanups on pine needles, lichens and moss extracts for PAH analysis [29,40,48], which systematically used a mixture of nonpolar solvent, n-hexane or cyclohexane, and a slightly polar solvent, dichloromethane. The polarity of these mixtures ensures efficient PAH elution, as polar co-extracted matrix compounds stay adsorbed on the normal phase sorbents. For example, Blasco et al. carried out lichen extract cleanup with NH2 bonded cartridges
and measured 95% of PAH recovery and 98% of matrix compounds elimination with n-hexane/DCM elution [48].
The extracts were concentrated to 0.1 mL under a gentle stream of nitrogen (Alpha 1, Air Liquide, Paris, France), then 1 mL of ace-tonitrile was added. Finally, extracts were fil te red with PTFE syringe filters (I.D. 13 mm, 45 J..Lm) (Xilab, Atlanticlabo-ICS, Bruges, France), and 80 ng ofinternal standard FTN d 10 was added. The extracts were stored at -20
oc.
2.4. HPLC-FLD analysis
The PAH analyses were performed with a high-performance liquid chromatography system consisting of a P680 HPLC pump and an RF 2000 fluorescence detector (Dionex, Sunnyvale, CA, USA). An 8125 low dispersion injector (Rheodyne, Rohnert Park, CA, USA) was fitted with a 20 f..LL loop. The system was equipped with a 250mmx4.6mm I.D. SupelcosillM LC-PAH C18 column (particle size 5 J..Lm) and a 20 mm x 4.6 mm I.D. precolumn (par-ticle size 5 J..Lm) (Supelco Analytical, Sigma-Aldrich, St. Louis, MO, USA). Their temperatures were controlled with an Ultimate 3000 column compartment (Dionex, Sunnyvale, CA, USA). Chromeleon 6.80 Chromatography Data System (SR10 Build 2818 (166959)) was used for data acquisition (Dionex, Sunnyvale, CA, USA).
Elution was carried out with a binary solvent gradient ofwater and acetonitrile (ACN) at a flow rate of 1.5 mLmin-1• The gradient
elution program was as follows: initial conditions with 60% ACN maintained for 5 min, followed by a 25 min linear ramp to 1 00% ACN and finally a 10min plateau at 100% ACN. The column tem-perature was set at 30
oc.
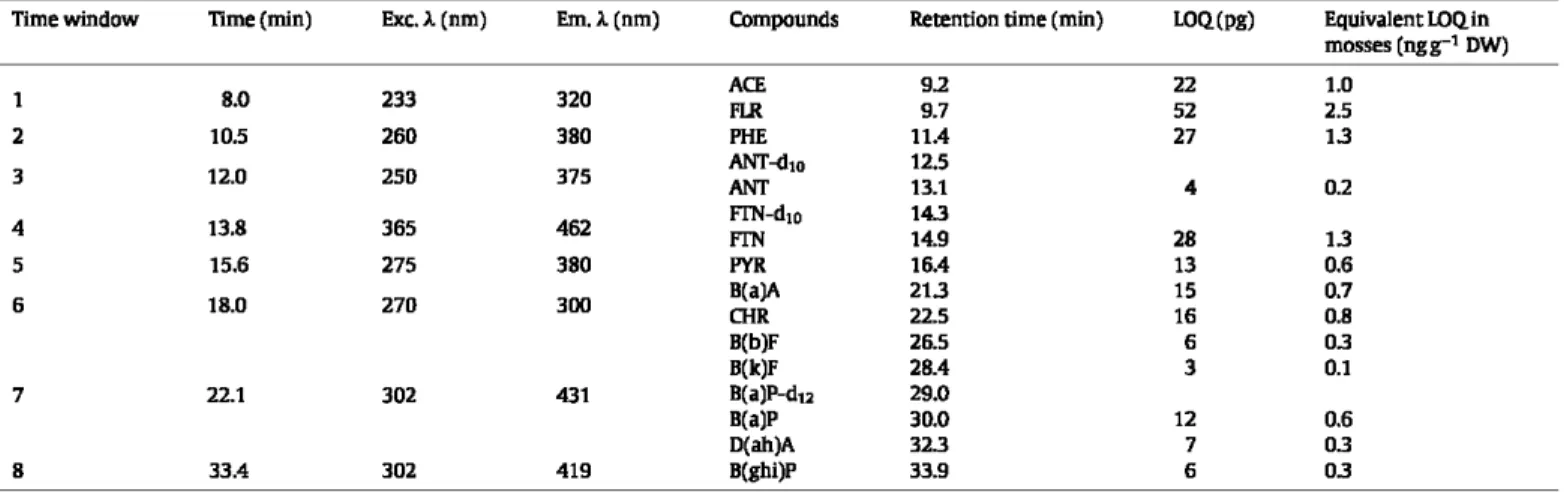
Detection was performed with selected fluorescence wavelengths to obtain the best sensitivity and min-imal interference. The excitation/emission wavelength pairs (nm) are given in Table 2.2.5. Quality assurance (QA) and quality control (QC)
Detection (LOD) and quantification (LOQ) limits were deter-mined by studying the chromatogram obtained with a 2ngmL-1
standard solution. The LOD was calculated as equal to three times the background (S/N=3) and the LOQas 10 times the background (S/N = 10) [49]. Quantification limits are given in Table 2.
Calibration curves were prepared for six levels (0, 2, 5, 10, 50, 150 ng mL -1 ) and each calibration leve! was injected in trip-licate. The linearity range for the PAH analysis extended from LOQ to 150 ng mL -1 with regression coefficients from 0.9993 (FLR) to
0.9999 (PHE, ANT, FTN, B(a)A, CHR, B(b)F, B(k)F, D(ah)A).
Repeatability was satisfactory since the uncertainty (as defined in (1) [50]) of 10 replicate analyses orthe 2 ngmL -1 standard
solu-tion ranged from 1 to 10%.
. tx SD
Uncertamty = .Jij (1)
where t is the Student's t-value, SD is the standard deviation, and n
is the number of injections.
The optimal analytical procedure showed average surrogate recoveries of 70% forANT d10 and 68% B(a)P d12. Reproducibility
TableZ
Analytical parameters for PAH analysis by HPLC-FI.D. Excitation (Exc. À) and emission {Em. À) wavelengths were chosen as a function of the compounds analyzed. The limits of quantification (I.OQ) are expressed in mass of injected compound (pg). As a rough guide, equivalent concentrations in mosses (ngg-1 dry weight) have been calculated
(for 1.5 g of moss sample treated, and with satisfactory PAH recoveries of 70%).
Timewindow Time{min) Exc.l.(nm) Em.l.(nm) COmpounds Retention time (min) LOQ(pg) Equivalent I.OQin mosses (ngg-1 DW) 8.0 233 320 ACE 9.2 22 1.0 1 FIR 9.7 52 2.5 2 10.5 260 380 PHE 11.4 27 13 3 12.0 250 375 ANT-<Ito ANT 12.5 13.1 4 0.2 4 13.8 365 462 FIN-d1o FIN 143 14.9 28 13 5 15.6 275 380 PYR 16.4 13 0.6 6 18.0 270 300 B(a)A ŒIR 213 22.5 15 16 0.7 0.8 B(b)F 26.5 6 03 B(k)F 28.4 3 0.1 7 22.1 302 431 B(a)P-d12 29.0 B(a)P D(ah)A 8 33.4 302 419 B(ghi)P
Section 3.1 ). The accuracy was also verified with the reference material (cf. Section 3.4).
2.6. Experimental design approach
To understand the way in which PLE operating variables affect PAH extraction, individual operating variables must be considered along with interaction terms. The operating variables, temperature (1), static extraction time ( ts) and numberof cycles (N), were studied using a factorial design (Nemrodw, LPRAI, Marseille, France). Each of the variables was set at 3 coded levels: -1, 0 and + 1, requiring 18 experiments in total (Table 1 ).
The results from the factorial design can be assessed using mul-tilinear regression (Nemrodw, LPRAI, Marseille, France), with an equation of the form:
Y = bo
+
bt T+
b2ts+
b3N+
bt2 Tts+
b131N+
b23tsNwhere Y is the extraction recovery and b0 the intercept. This first
degree mode! was validated using a Fischer test. Each regression coefficient was tested using a Student's
t
test with a correspond-ing p-value. The factors whose p-values were less than 0.05 were considered as, Nstatistically significant".3. Results and discussion 3.1. Optimization of the PLE method
The factorial design revealed recoveries of 56-75% forANT d10
(surrogate for ACE to PYR) and from 58 to 71% for B(a)P d10
(sur-rogate for B(a)A to B(glù)P) (Fig. 2), in agreement with the results obtained in the literature with n-hexane over the same extraction temperature ranges, static extraction time and number of cycles
133,34].
Variance analysis of the factorial design with a Fischer test validated the choice of a first degree model.Indeed, a variance coef-ficient ofF= 2, strictly inferior to the Fischer coefcoef-ficient fAscher = 6, showed that the variability of the central point was significantly lower than the variability over the facto rial design.
Multilinear regression was applied to the light and heavy PAH recoveries obtained with the central factorial design. Statistical treatment of the results is shown in Table 3. At the 95% confidence level (p-value < 0.05 ), the PLE operational parameters studied in the factorial design bad an insignificant effect on light and heavy PAH recoveries, except for extraction temperature which bad a significant effect on heavy PAH recoveries (99% confidence levet,
30.0 12 0.6
323 7 03
33.9 6 03
p-value<O.Ol). This parameter is therefore the key to PLE opti-mization. The interaction between the terms corresponding to the extraction temperature and the number of static cycles was par-ticularly important as it appeared to have a significant effect on heavy PAH recoveries at the 95% confidence levet (p-value < 0.05 ). The response surface representing heavy PAH fraction recoveries showed that optimal conditions were reached with a minimum temperature of 80
oc
and a maximal extraction ti me of 45 min (3 cycles of 15min) (Fig. 3). However, at the optimal temperature of"'
..
'iii > 0 u..
0::Light PAHs He avy PAHs
Fig. 2. Box-plots of the recoveries obtained with the PIE factorial design (t-3 static extraction cydes of 5-15min at 80-140"C) forlight PAHs (ACE-+ PYR) and heavy PAHs (B(a)A-+ B(ghi)P). The box boundaries indicate the 25th and 75th percentiles. The horizontal !ines and plus signs ( +) within the boxes represent the median and
Table]
Multilinear regression coefficients of the first order models of light and heavy PAH recoveries associated with the p-values obtained by Student's t test and their degree of "statisticalsignificanœ•. Parameter • p<O.OS. •• p<0.01. -· p<0.001. Variable T t, N T.t, T.N t,.N
Ught PAH recoveries
Coefficient p value 0.6525 <0.0001 -0.0022 0.8900 -0.0041 0.7990 -0.0194 0.2540 -0.0074 0.6480 0.0014 0.9310 -0.0286 0.1030
80
oc, average recoveries varied insignificantlywith total extraction
ti me.The extracts obtained with n-hexane were pale yellow, green or brown, depending on the operatiollill parameters (Fig. 4). At 80 oc (1-4), the colour of the extracts was Jess intense than at 140°C (5-8), as Iow temperatures induced Jess co-extraction of matrix compounds, as shown previously by jânskâ et al. [39]. Moreover, with 80
oc
static extraction temperatures, extracts were darker when the PLE was operated with 1 cycle (experiments 1 and 4) than with 3 cycles (experiments 2 and 3). Canying out severa! cycles ensures better in-cell cleanup by FlorisiJIZ, as Jess extract passes through the sorbent during each flush. As low interference is necessary during HPLC-FID analysis, extractions should therefore be performed at 80oc with at !east two static cycles. To develop
the shortest analytical procedure possible, and since total extrac-tion time bad barely any influence on PAH recoveries, the optimal extraction appeared to be with 2 cycles of 5 min.After studying the quantitative and qualitative aspects of the PLE method, the optimal parameters chosen were:
- Extraction temperature: 80
oc.
- Static extraction time: 5 min. - Number of cycles: 2.These conditions were similar to those found in the litera-ture concerning the optimization of PAH extraction by PLE in
72% 70% " ~ 68% ~
"'
f 66%[
"'
64% 62% 1 80 95 110 Temperature (•q 125 140 ' 5 15 "" 35 25 -45 • 700.4-72% • 68%-70% 66%·68% 64%-66% 62%-64%Total extraction time (min)
ftg.1 Response surface of the factorial design representing recoveries of the heavy PAH fraction (B(a)A-+ B(ghi)P), obtained by plotting extraction temperature against total extraction time.
Heavy PAH recoveries
Signiflcance Coefficient pvalue Significanœ
0.6600 <0.0001 -0.0281 0.0038 0.0128 0.0840 -0.0020 0.7550 0.0089 0.2000 -0.0206 0.0155 -0.0008 0.8990
environmental samples such as soi!, sediments and partirulate matter: generally 1-2 cycles of 5 min at 100
o
c
[36,38].The optimal conditions were tested using 6 repetitions of the analytical procedure. The extracts obtained were bright yellow and did not contain any visible matrix residues. Moreover, the extracts showed average recoveries of 70% and 68% for light and heavy PAHs respectively. These results were satisfactory as they tallied with the highest quartiles oflight and heavy PAH recoveries obtained with the factorial design (shown in Fig. 2). Average total PAH concentrations of233±6ngg-1 were measured for 13 PAHs
in I. myosuroides Brid. (Table 4). FLR, PHE, FTN and PYR appeared as the major compounds. These levels were within the ranges of con-centrations measured in 2006-2007 in four other pleurocarpous moss species sampled from the same site [29]. These results also valida te the reprodudbility of the method as the relative standard deviation of the total concentrations was 2% and of the individual concentrations of 1-22% (for PYR and ANT respectively).
3.2. Comparison with Soxtec extraction
Soxtec extraction provided similar yellow extracts to those obtained with optimal PLE, as weil as equivalent surrogate recover-ies: 77% for light PAHs (ACE to PYR) and 67% for heavy PAHs (B(a)A to B(ghi )P). Moreover, the individual PAH concentrations measured after PLE and Soxtec extraction were within the same range, except for ACE and FLR (Table 4). During analysis, these two-ring aromatic compounds sometimes interfered with matrix compounds, Iead-ing to diffirult quantification, and as they are volatile, !osses may have occurred during Soxtec extraction. These observations con-firm the necessity for evaluating the accuracy of the PLE method Table4
Mean PAH concentrations (ngg-1 dry weight) and corresponding standard
devia-tions (SD) measured in Isothedum myorusoides Brid by HPI.C-FID after extraction with the optimal PI.E conditions (n = 6) and comparison with the levels measured after Soxtec extraction (n=3) .
PAHs OptimaiPLE(n-6) Soxtec (n- 3)
Mean SD Mean SD ACE 2.0 0.1 2.6 0.2 FLR 35.6 3.3 14.0 2.2 PHE 29.4 3.1 29.6 3.7 ANT 1.8 0.4 1.7 0.2 FfN 43.4 1.8 42.0 6.8 PYR 96.7 1.3 100.5 18.1 B(a)A 3.4 0.6 4.2 0.4 CHR 9.5 1.1 11.0 1.3 B(b)F 2.3 0.2 2.4 0.1 B(k)F 2.2 0.4 2.1 0.1 B(a)P 4.1 0.5 4.1 0.2 D(ah)A 0.7 0.1 0.9 0.1 B(ghi)P 5.4 0.5 5.3 0.3 Total 233.5 5.5 2203 31.1
2
3
l'tg. 4. Concentrated extracts obtained from experiments 1-8 of the factorial design. See Table 1 for details.
with a reference material. Average total concentrations measured with the two methods showed a low relative difference of 6%. Sax-tee ensured 2 parallel extractions with 200 mL of solvent in 3.5 h ( .-...0.6 extractions per hour), whereas optimal PLE conditions (2 static cycles of 5 min) led to 3 extractions per hour with 30 mL of solvent per sample. Therefore, optimal PLE conditions were as efficient as Soxtec for PAH extraction from masses, with the advan-tage of being five times faster and of consuming three times less solvent 3.3. Oeanup procedure
l
i
'
"'
r-'"'
'
"'
'"'
'
"'
-
-"""
'
"'
'
"'
'
"'
"'
J
r
l
1
r - r-LC~orhiil+
r - r-LC.SI 1 1 oLi~hl P.I.H$ ACE- PYR OHtaYyPAHs B(a)A- B(ghllf"Strata NH2 cartridges were immediately eliminated during preliminary tests because quantification with HPLC/FW analysis was impossible due to the presence of high quantities of inter-fering compounds on the chromatograms. Conversely, analysis of the purified extracts obtained with Strata Alumina-N, Supel-clean LC -Florisil and Supeldean LC -Si SPE cartridges was possible. Recoveries of light and heavy PAHs were determined for each type of sorbent (n~S) (Fig. 5). Alumina-N recoveries were sig-nificantly lower than the 2 other sorbents. For these cartridges,
l'tg. S. Light and heavy PAH recoveries obtained un der the optimal PLE conditions as a function of the SPE sorbents used for post -extraction deanup. The error bars repre-sent the standard deviation obtained by repeating the extraction(deanup(analysis procedure flve times with each type of cartridge.
(a) 800 600 400 200 8.0 10.0 12.0 14.0 16,0 18.0 20.0 22.0 24.0 26.0 28.0 30.0 32.0 35.0 Ti me (min) 600 (b) 500 400 300 200 min 2.0 4,0 6,0 8,0 10,0 12,0 14,0 16,0 18,0 20,0 22.0 24.0 26,0 28,0 30,0 32,0 35,0 Time (min)
l'tg. 6. HPLC chromatograms obtained by ftuorescence detection (emission) after il\iection of: (a) a standard solution ofPAHs at 10 ng L _, in HPLC-grade acetorutrile (prepared with Mix 16 HAP, LGC Standards, France). (b) An extract of Hypnum cupressiforme moss sampled in 2010 in the Bertiz Nature Reserve, obtained with the optimal PI.E method followed by deanup using Florisile SPE cartridges. See text and Table 2 for chromatographie experimental conditions.
average recoveries of 51% and 59% were observed for light and heavy PAHs respectively, compared to 71% for bath fractions with LC-Fiorisil and 67% and 75% for light and heavy PAHs respec-tively with LC-Si cartridges. LC-Fiorisil and LC-Si cartridges gave equivalent cleanup PAH recoveries. However, light PAH recov-eries were much more variable with LC-Si than with LC-Fiorisil cartridges (RSD of 20% compared to 8%). Therefore, LC -Fiorisil cartridges appeared to be the most appropriate for moss extract cleanup after PLE extraction, as they were the only type of SPE tested that ensured recoveries higher than 60% for aU PAHs. These cartridges also appeared to give the extracts with the least co-extracts.
As cleanup of moss extracts with Florisi1111 ensured the
high-est PAH selectivity and recoveries, Supelclean LC-Florisil (1 g/6 mL) cartridges were chosen and used in subsequent experiments. Fig. 6
shows a chromatogram obtained with the optimal analytical proce-dure combining optimal PLE conditions (80°C, 2nùn x Smin) and Florisi1111 deanup. The chromatogram of a standard solution is also
included to show the law interfering compound content in the moss extract chromatogram.
3.4. Validation of the analytical procedure
The accuracy of the optimal analytical procedure was verified by applying PLE extraction three times, under the optimal conditions (2 min x 5 min at 80°C) followed by deanup with Supeldean LC-Florisil (1 g/6 mL) cartridges, to a reference material (IAEA-140-0C Fucus (35 g) from ANAIAB) containing the 13 target PAHs.
The International Atomic Energy Agency (IAEA) supply refer-ence material with recommended values for 9 target PAHs (ANT, PHE, FIN, PYR, B(a)A, CHR, B(k)F, B(a)P, B(ghi)P), establishedon the basis of 8-28 statistically valid results submitted during an inter-national Iaboratory inter-comparison exercise [43]. As shawn in
Fig. 7, concentrations of 8 target PAHs measured (ANf, PHE, FTN,
PYR, CHR, B(k)F, B(a)P, B{ghi)P) were included in the recommended value ranges (95% confidence intervals). Only B(a)A was slightly overestimated, due to the presence of chromatographie interfer-ing peaks, because the reference mate rial con tains numerous other organic compounds such as polychlorinated biphenyls (PCBs) and organochlorine pesticides (OCPs).
The IAEA also supply information values for ACE, FI.R, B(b )F and D( ah)A( established with 3-7 accepted labo ra tory results ). The con-centrations measured with optimal PI.E and SPE conditions were within the information value 95% confidence intervals.
TableS 120 ~ 0 ~
g:
100 .5. iO 't:"
...
E"
80 (,) c ! .! !"
.s
60·=
,
!"
..
..
"
E..
40 c 0 ·~ "E"
(,) 20 c 0 (,) :z: <1: IL B(ghi)P B(a)P~~--< ~---< B(k)F ANT y= x > - - - ;1 PHE //
1
~
z=
PYR >---*~ 0 ~--~---~--~---~--~----4 0 20 40 60 80 100 120Recommended PAH values given by the IAEA (ng g·' DW)
fi&. 7. Concentrations of9 target PAHs measured in the reference materialiAEA-140/0C Fucus (35g} {ANAIAB, France} as a function of the recommended values {ngg-1, based on dry weight DW}. The analytical procedure was performed on 3 replicates of reference material. The experimental levels are represented by the mean concentration, and the error bars correspond to the concentration range mea-sured (minimum and maximum). The recommended values are represented by the mean value given by the IAEA, and the error bars correspond to the 95% confidence intervals (based on 8-28 results depending on compound}. The dotted line (y =x} represents the case where the experimental value is equal to the recommended value.
3.5. Study of spatial and inter-spedes variability at a rural site
Using the optimal analytical procedure, the 13 target PAHs were quantified in the moss samples collected from the remote site in the Aralar Range Iocated in Navarra, Spain (Table 5). Average total concentrations of 133±5 and 130±5ngg-1 (dry weight) were
measured in the H.
splendens
(Hedw.) Schimp. and H.cupressi-forme
Hedw. samples, respectively. The levels were of the samearder of magnitude as those measured in the H.
splendens
and H.cupressiforme
masses sam pied over the past years in rural areas ofEuropean countries [ 4,2 7 ,32]. A previous study carried out in 2008
Mean and median individual and total concentrations (ngg-1 dry weight} and corresponding standard deviations {SD} of 13 PAHs in two species of moss (Hylocomium
splendens {Hedw.} Schimp. and Hypnum cupressi.forme Hedw.} sampled at a remote site in the .Aralar Range {Navarra, Spain}. The results were obtained by applying the
optimal extraction/deanupjanalysis procedure to 9 sam pies of ffy/ocomium sp/endens and 3 sam pies of Hypnum cupressi{onne.
PAHs Acenaphthene {ACE) Fluorene (FIR) Phenanthrene {PHE) Anthracene (AN'Ij Fluoranthene (FTN) Pyrene {PYR} Benz(a)anthracene (B(a}A} Chrysene {CHR) Benzo{b)fluoranthene (B(b)F) Benzo{k}fluoranthene {B{k}F} Benzo{a)pyrene {B(a}P) Dibenz{a,h}anthracene {D{ah)A} Benzo(g.h.i)perylene {B{ghi)P) Total Concentrations (ngg-1 DW}
Hylocmnium splendens {Hedw.} Schimp.
Mean Median 3.5 3.1 30.3 30.1 19.2 19.8 1.3 1.1 15.5 15.5 26.3 25.8 4A 4.1 8.2 7.9 8.5 8.2 3.5 3.5 5.2 5.0 1.6 1.5 5.8 5.5 133.3 131.2 Concentrations (ng g-1 DW}
Hypnum cupressifonne Hedw.
SD Mean Median SD 0.4 2.9 2.9 0.2 2.8 24.0 24.0 3.3 1.3 19.0 17.9 1.9 0.2 12 1.2 0.1 0.8 15.7 15.5 0.5 4.0 31.9 32.6 2.3 0.7 2.8 2.6 0.3 0.9 7.6 8.3 1.3 0.8 72 7.1 0.7 0.4 3.0 3.0 0.2 0.5 4.0 4.1 0.3 0.3 12 1.2 0.1 0.6 4.4 4.5 0.7 4.8 130.0 125.0 4.7
in the Bertiz Nature Reserve, located 35 km from the Aralar Range sampling site, also showed average totallevels for the 13 PAHs of approximately 1 00 ng g-1 (dry weight) in the moss H. cupressifonne
[29].
Average individual concentrations ranged from 1.3 ± 0.2 to 30±3 ngg-1 (dryweight) forANT and FLRrespectively inH.
splen-dens and from 1.2 ± 0.1 to 32 ± 3 ng g-1 (dry weight) for ANT and
PYR respectively in H. cupressifonne. The major compounds in both species were FLR, PHE, FTN and PYR, with concentrations over lOngg-1 (dry weight), as previously found in the Bertiz Nature
Reserve [29].
The nine sam pies of H. splendens were sampled from soi! at sev-era! points over 200 rn, at the limit between grassland and forest, where local conditions varied slightly (light intensity, throughfall precipitation ... ) in function of the canopy cover. The analysis of the se sam pies revealed relative standard deviations lower than 20% for ali target PAHs, of the same order as the reproducibility pre-viously determined in this study with a homogenous composite sample. The low variability showed that the local environmental conditions had a negligible influence on bioaccumulation of PAHs by the mosses.
Individual concentrations of FLR, B(a)A, B(b)F, B(k)F, B(a)P, D(ah)A, B(ghi)P were significantly lower in H. cupressifonne than in H. splendens samples. PYR concentrations were significantly higher in H. cupressifonne. The quantity of PAHs bioaccumulated was therefore specifie to the moss species, as shown previously by Galuszka [32] who observed higher PAH accumulation in H. splendens than in Pleurozium schreberi mosses. The variability of bioaccumulation between species can be explained by their differ-ent morphologies and/or their growth conditions. H. splendens is a weft moss with feathery fronds, whereas H. cupressifonne has prostrate, creeping stems which form smooth, dense mats [51]. Moreover, H. cupressifonne was growing on tree stumps and dead branches under forest cover, whereas H. splendens was collected from soi! at the Iimit between the forest and grassland. Therefore, to biomonitor atmospheric deposition of PAHs with severa! moss species, preliminary inter-species calibration is necessary.
4. Conclusions
PAH extraction from the moss 1. myosuroides Brid., using Soxtec with n-hexane showed average PAH recoveries of 67-77% and con-centrations of approximately 200 ngg-1 (dry weight). To increase
the extraction turnover and reduce solvent consumption, PLE was tested. The PLE factorial design revealed the optimal extraction conditions: 80
oc
for 2 cycles of 5 min, giving maximum recov-eries and ensuring good selectivity for moss PAH determination at trace levels. Under optimal PLE conditions, satisfactory average recoveries of 68-70% were obtained and concentrations similar to tho se for the Soxtec extraction procedure were measured, whereas solvent volume was divided by 3 and total extraction time by 5. Severa! normal phase SPE cleanup steps were tested. Supelclean LC-Florisil (1 g/6 mL) cartridges appeared to be the most efficient since the purified extracts contained the !east interfering com-pounds and the highest PAH concentrations. The accuracy of the optimal analytical procedure, combining the optimal PLE condi-tions with cleanup by FlorisiJ® SPE, was verified on a reference material.Finally, the optimal analytical procedure was applied to sam-pies of H. splendens (Hedw.) Schimp. and H. cupressifonne Hedw. collected at a remote site in Navarra (Spain) in june 2010. The tar-get PAHs were quantifiable and showed similar levels to those of previous studies carried out in Europe and locally in Navarra. The study revealed negligible on-site spatial variability for the PAH lev-els in the H. splendens samples, but significant differences between
the levels in the two species, due to their morphology and growth conditions.
Acknowledgments
This work was supported by the Communauté de Travail des PyrénéesfCommunidad de Trabajo de los Pirineos (CTP). We wish to thankAlicia Ederra from the Departamento de Biologia Vegetal of the University ofNavarra (Pamplona, Spain) for helping us with her botanical knowledge during the moss species identification phase, and Nerea Aragonés, Raul Bermejo, Laura Gonzâlez, josé Miguel Otano and jesus Miguel Santamaria of the Laboratorio Integrado de Calidad Ambiental (LICA) of the University of Navarra (Pamplona, Spain) for supplying us with moss samples. We also wish to thank Laure Candy and Christine Raynaud from the Laboratoire de Chimie Agro-Industrielle (LCA) for their advice on experimental designs.
References
[1] A Bjiirseth. T. Ramdahl. Sources and Emissions of PAH. Marcel Dekker. New York, 1985.
[2] LH. Lim, R.M. Harrison, S. Harrad, Environ. Sei. Technol. 33 (1999) 3538. [3] AM. Mastral, M.S. Callén, R. Murillo, T. Garcia, Environ. Sei. Technol. 33 (1999)
4155.
[4] 1. Holoubek.J. Klanova.j.jarkovsky,J. Kohoutek,J. Environ. Monit. 9 (2007) 557. [5] K.M. Nauss, Diesel Exhaust: A Critical Analysis of Emissions, Exposure and Health Effects, Health Effects lnstitute (HEl) Special Report, Health Effects lnsti-tute, Diesel Working Group, Cambridge, 1995, p. 6.
[6] S. Dejean, C. Raynaud, M. Meybeck,J.-P. Della Massa, V. Simon, Environ. Monit. Assess. 148 (2009) 27.
[7] A Motelay-Massei, D. Ollivon, B. Garban, K. Tiphagne-Larcher,l. Zimmerlin, M. Chevreuil, Chemosphere 67 (2007) 312.
[8] J.P. Carree, C. Van Haluwyn, Biosurveillance végétale de la qualité de l'air Concepts, méthodes et applications (Air Quality Biomonitoring with Plants -Concepts, Methods and Applications),Lavoisier, Paris, 2002.
[9] A Klumpp, W. Anse!, G. Klumpp,]. Breuer, P. Vergne, MJ. Sanz, S. Rasmussen, H. Ro-Poulsen, À Ribas Artola,j. Pefiuelas, et al., Atmos. Environ. 43 (2009) 329. [10] Y.Q, Wang, S. Tao, X.C. jiao, R.M. Coveney, S.P. Wu, B.S. Xing, Environ. Pollut.
151 (2008) 158.
[11] F. De Nicola, L Claudia, P. MariaVittoria, M. Giulia, A Anna, Atmos. Environ. 45 (2011) 1428.
[12] N. Ratola,j.M. Amigo, M.S.N. Oliveira, R. Araujo,J.A Silva, A Alves, Environ. Exp. Bot. 72 (2011) 339.
[13] S. Orecchio, A Gianguzza, L Culotta, Environ. Res. 107 (2008) 371. [14] M. Blasco, C. Domeno, P. Lopez, C. Nerin,J. Environ. Monit. 13 (2011) 2588. [15] Z.M. Migaszewski, A Galuszka, P. Paslawski, Environ. tnt. 28 (2002) 303. [16] S. Dolegowska, Z.M. Migaszewski, Ecotoxicol. Environ. Saf. 74 (2011) 1636. [17] H. Harmens, D.A Norris, E. Steinnes, E. Kubin,]. Piispanen, R. Al ber, Y.
Aleksi-ayenak, O. Blum, M. Coskun, M. Dam, et al., Environ. Pollut. 158 (2010) 3144. [18] M. Krmar, D. Radnovic, D.T. Mihailovic, B.Lalic,j. Slivka, 1. Bikit, Appt. Radiat.
!sot. 67 (2009) 1139.
[19] H. Harmens, D.A Norris, D.M. Cooper, G. Mills, E. Steinnes, E. Kubin, L. Thiini, J.R. Aboal, R. Alber, A. Carballeira, et al., Environ. Poli ut. 159 (2011) 2852. [20] X.-Y. Liu, H.-Y. Xiao, C.-Q, Liu, Y.-Y. Li, H.-W. Xiao, Y.-L. Wang, Environ. Pollut.
158 (201 0) 2273.
[21] H.-Y. Xiao, C.-G. Tang, H.-W. Xiao, Y.-L Wang, X.-Y. Liu, C.-Q, Liu, Environ. Poli ut. 158 (201 0) 1726.
[22] F. Borghini, j.O. Grimait, J.C. Sanchez-Hernandez, R. Bargagli, Chemosphere 58 (2005) 271.
[23] A Carballeira,j. Angel Fernândez,J.R. Aboal, C. Real,J.A Couto, Atmos. Environ. 40 (2006) 5776.
[24] G.T. Yogui,J.L. Sericano, Chemosphere 73 (2008) 1589.
[25] R. Gerdol, L Bragazza, R. Marchesini, A. Medici, P. Pedrini, S. Benedetti, A. Bov-olenta, S. Coppi, Atmos. Environ. 36 (2002) 4069.
[26] 1. Holoubek, P. Korinek,
z.
Seda, E. Schneiderovâ, 1. Holoubkovâ, A Pacl,J. Triska, P. Cudlin,J. Câslavst<Y. Environ. Pollut. 109 (2000) 283.[27] V. Krommer, H.G. Zechmeister, 1. Roder, S. Scharf, A. Hanus-Illnar, Chemosphere 67 (2007) 1956.
[28] H. Zechmeister, S. Dullinger, D. Hohenwallner, A Riss, A. Hanus-Illnar, S. Scharf, Environ. Sei. Pollut. Res. 13 (2006) 398.
[29] L Foan, C. Sablayrolles, D. Elustondo, E. Lasheras, L Gonzâlez, A Ederra, V. Simon, J.M. Santamaria, Atmos. Environ. 44 (2010) 3207.
[30] E. Otviis, 1.0. Kozâk,J. Fekete, V.K. Sharma, Z. Tuba, Sei. Total Environ. 330 (2004) 89.
[31] A Ares, J.R. Aboal, J.A Fernândez, C. Real, A Carballeira, Atmos. Environ. 43 (2009) 5501.
[32] A. Galuszka, Chemosphere 67 (2007) 1415.
[33] X. Liu, G. Zhang, K.C.jones, X. Li, X. Peng, S. Qi, Atmos. Environ. 39 (2005) 5490. [34] K.-D. Wenzel, A Hubert, M. Manz, L Weissflog, W. Engewald, G. Schüürmann,
[35] M. Tobiszewski, A Mechlinska, B. Zygmunt, j. Namniesnik, Trends Anal. Chem. 28 (2009) 943.
[36] E. Bjiirklund, T. Nilsson, S. Bowadt, Trends Anal. Chem. 19 (2000) 434. [37] DIONEX, Methods Optimization in Accelerated Solvent Extraction (ASE«>),
Dionex Corporation Technical Note 208, LPN 0982-02 PDF 9/04, 2004 (cited 2012 january 16th). Available from: http://www.dionex.com/en-usfwebdocsf4736-TN208.pdf.
[38] H. Giergielewicz-Mozajska, L. Dabrowski, j. Namiesnik, Crit. Rev. Anal. Chem. 31 (2001) 149.
[39] M.jânskâ, M. Tomaniovâ,J. Hajslovâ, V. Kocourek, Anal. Chim. Acta 520 (2004) 93.
[40] N. Ratola, S. Lacorte, A Alves, D. Barcel6,j. Chromatogr. A 1114 (2006) 198. [41] P. Konieczka, L Wolska,j. Namiesnik, Trends Anal. Chem. 29 (2010) 706. [42] M. Blasco, C. Domeiio, C. Nerîn, Environ. Sei. Technol. 40 (2006) 6384. [43] j.P. Villeneuve, C. cattini, F.P. Carvalho, World-wide and
Regionallntercom-parison for the Determination of Organochlorine Compounds and Petroleum
Hydrocarbons in Fucus Sample IAEA-140,1ntemational Atomic Energy Agency, Marine Environment Laboratory, Monaco, 1997 (cited 2012 january 16th). Available from: http:ffnucleus.iaea.orgfrpstfDocuments/ aL 140.pdf. [44] B. Markert, Sei. Total Environ. 176 (1995) 45.
[45] P. Quevauviller, Sei. Total Environ. 176 (1995) 141.
[46] E. Bjiirklund, S. Sporring, K. Wiberg, P. Haglund, C.v. Holst, Trends Anal. Chem. 25 (2006) 318.
[47] N. Saim, j.R. Dean, M.P. Abdullah, Z. Zakaria, Anal. Chem. 70 (1998) 420. [48] M. Blasco, C. Domeiio, K. Bentayeb, C. Nerîn, lnt. j. Environ. Anal. Chem. 87
(2007)833.
[49] j. Tranchant, Manuel pratique de chromatographie en phase gazeuse (Practical Handbook of Gas Chromatography), Masson, France, Paris, 1995.
[50] P. Konieczka,j. Namiesnik,j. Chromatogr. A 1217 (2010) 882.
[51] B. Goffinet, AJ. Shaw, Bryophyte Biology, second ed., cambridge University Press, Cambridge, 2009.