To cite this version :
Kelemen, Eszter and Balázs, Katalin and Choisis, Jean-Philippe and Choisis, Norma and Dennis, Peter and Gomiero, Tiziano and Kovacs, Eszter and Nguyen, Genevieve and Paoletti, Maurizio and Podmaniczky, Laszlo and Ryschawy, Julie and Sarthou, Jean-Pierre Assessement of economic benefits linked to organic and low input farmland in 4 BIOBIO case study areas. (2011) [Report]
OATAO is an open access repository that collects the work of some Toulouse researchers and makes it freely available over the web where possible.
This is a publisher’s version published in :http://oatao.univ-toulouse.fr/16369
Official URL :http://www.biobio-indicator.org/deliverables.php
Any correspondence concerning this service should be sent to the repository administrator : tech-oatao@listes-diff.inp-toulouse.fr
Project no. 227161
BIOBIO
Indicators for biodiversity in organic and low-input farming systems Thematic Priority: Food, Agriculture and Fisheries and Biotechnology
Funding scheme: KBBE-2008-1-2-01
Assessement of Economic Benefits
Linked to Organic and Low Input Farmland
in 4 B
IOB
IOCase Study Areas
Deliverable D3.4
Due date of deliverable: Month 24 First draft: 4/03/2011 Final submission date: 30/08/2011
Start date of project: 01.03.09 Duration: 3 1/2 years (42 months)
Organisation name of lead contractor for this deliverable: SIU (WP3) Final Version
Project co-funded by the European Commission within the Seventh Framework Programme (2009-2012) Dissemination Level
PU Public X
PP Restricted to other programme participants (Including the Commission Services) RE Restricted to a group specified by the consortium (Including the Commission Services) CO Confidential, only for members of the consortium (Including the Commission Services)
Assessment of Economic Benefits Linked to Organic and Low
Input Farmland in 4 BioBio Case Study Areas
Final Version of Report
Eszter Kelemen1(editor), Katalin Balázs1, Jean-Philippe Choisis2, Norma Choisis2, Peter Dennis3,
Tiziano Gomiero4, Eszter Kovács1, Geneviève Nguyen5, Maurizio Paoletti4, László
Podmaniczky1, Julie Ryschawy2, Jean-Pierre Sarthou5
1(SIU) Szent Istvan University, Institute of Environmental & Landscape Management, (SZIE-KTI), Gödöllö, Hungary; 2(INRA)
Institut National de la Recherche Agronomique, UMR Dynafor, Toulouse, France; 3(ABER) Institute of Biological, Environmental
and Rural Sciences, Aberystwyth University, UK; 4(UP) Department of Biology, Padova University, Italy; 5(ENSAT) University of
Toulouse, INP-ENSAT, Toulouse, France. 28 February 2011
Table of contents
TABLE OF CONTENTS ... 3
EXECUTIVE SUMMARY ... 4
1. INTRODUCTION ... 5
2. THEORETICAL AND METHODOLOGICAL BACKGROUND ... 6
2.1. THEORETICAL INTRODUCTION ... 6
2.2. METHODOLOGICAL BACKGROUND ... 7
2.2.1. Data collection methods ... 7
2.2.2. Data analysis ... 8
3. GENERAL CONTEXTUAL INFORMATION ON THE FOCUS GROUPS ... 9
3.1. THE LOCAL CONTEXT OF FOCUS GROUPS ... 9
3.2. GENERAL OVERVIEW OF FOCUS GROUP PARTICIPANTS ... 11
3.2.1. Homogeneity of focus groups ... 11
3.2.2. Preparatory questionnaires: background information on participants ... 12
3.3. RUNNING THE FOCUS GROUPS ... 13
3.3.1. General management of focus groups ... 13
3.3.2. Moderation and group dynamics ... 14
4. GENERAL AND COMPARATIVE ANALYSIS ... 16
4.1. THE COMPARABILITY OF RESULTS ... 16
4.1.1. Basic statistics ... 16
4.1.2. The validity and generalisability of results ... 19
4.2. RESULTS OF THE COMPARATIVE ANALYSIS ... 21
4.2.1. Interpretation of biodiversity ... 21
4.2.2. Attitudes towards biodiversity ... 30
4.2.3. Benefits and beneficiaries of biodiversity ... 32
4.2.4. How to preserve biodiversity ... 38
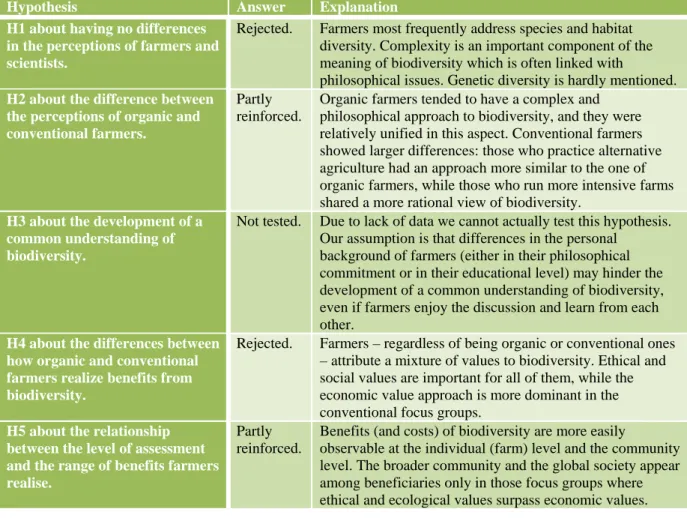
5. CONCLUSION ... 41
5.1. REVIEWING THE INITIAL HYPOTHESES ... 41
5.2. METHODOLOGICAL INSIGHTS ... 46
5.3. RECOMMENDATIONS ... 47
6. REFERENCES ... 49
ANNEX I: GUIDELINES... 50
ANNEX II: WORKSHOP PROGRAM ... 51
ANNEX III: CODING AGENDA ... 52
Executive summary
This report (BioBio Deliverable 3.4) gives a detailed overview of the non-monetary valuation of biodiversity carried out in four countries (France, Hungary, Italy and Uganda) and provides a comparative analysis of the results. We selected the focus group methodology to carry out this task because this method is useful to understand the way of thinking of a group of people, and because earlier research projects also applied this method successfully. We involved only farmers in the research (and did not involve general citizens) partly because the existing literature provides already some findings on the perceptions of the general public and partly because of time and resource constraints. Two focus groups were organized in each country to get to know how organic and conventional farmers perceive biodiversity, what kind of values they attribute to biodiversity, and how they define the range of beneficiaries who enjoy the positive effects of biodiversity. Focus group data gathered in this research are more suitable for the comparison of organic and conventional focus groups than for a cross-country comparison due to the limited size and other specificities of the sample.
Our results suggest that when farmers think about biodiversity they address species and habitat diversity the most frequently. Complexity is also an important component of biodiversity for them, and the complex nature of biodiversity is often linked to the philosophical and spiritual commitment of farmers. Genes’ diversity is hardly mentioned by farmers. Focus group results show a difference between the perception of organic and conventional farmers. Organic farmers tended to have a more complex and philosophical approach to biodiversity, and they were relatively unified in this aspect. Conventional farmers showed larger heterogeneity in this aspect: those who practice alternative agriculture had an approach more similar to the one of organic farmers, while those who run more intensive farms shared a more rational view of biodiversity. Differences in the philosophical background of farmers affect also how they attribute values to biodiversity.
Farmers – regardless of being organic or conventional ones – attribute a mixture of values to biodiversity. Ethical and social values are important for all of them (this was the most frequently mentioned type of value). Economic value has also an important role especially in conventional focus groups; although in most cases the economic value is not strongly related to biodiversity but to farm management. In this respect, biodiversity is seen as having both positive and negative effects on the farm, and farmers tend to value biodiversity by comparing its contribution to the costs and benefits of farming. This cost-benefit approach is often in conflict with the strong ethical and social values attributed to biodiversity. It may happen that farmers truly respect nature and attribute existing value to biodiversity, but at the same time they have to make a compromise in order to provide a safe livelihood. This can result in cognitive dissonance (the confrontation of ethical considerations and real life decisions) which has to be resolved somehow.
Focus groups helped us experience that scientific concepts become inherently value-laden when we put them into the local context, which warns us that the subject of valuation is reinterpreted by the participants during the process. Hence, scientists should be aware of the various contexts of valuation and should understand how participants conceptualize the subject of valuation before choosing the appropriate method of valuation. Our findings reinforced also that monetary valuation methods have certain limits in biodiversity valuation, because they restrict the range of benefits and probably underscore the importance of biodiversity, because it is partly rooted in the philosophical and spiritual background of farmers which cannot be measured in monetary terms.
1. Introduction
Organic and low-input farming systems contribute to biodiversity protection in many ways (e.g. by reducing the use of chemicals, fostering zero-ploughing, breeding a wide range of traditional species) and at the same time enjoy the benefits provided by biodiversity. However, there is a lack of generic indicators which would be able to assess these benefits (and possible disadvantages) across Europe. The BioBio project aims at selecting and testing a set of biodiversity indicators to fill this gap. Although the core activities of the project focus on the ecological foundations of biodiversity assessment and apply a scientific approach, the research consortium is aware of the multiple understandings of biodiversity by different publics. Local residents, villagers and farmers perceive the importable and non-marketable functions resulting from agricultural activities that enhance biodiversity in the most direct manner. Thus, it is important to explore and understand the attitudes and values these actors attach to biodiversity, and to include their approach in scientific and policy discussions. Accordingly, we have carried out a non-monetary assessment of biodiversity in four case study areas (in France, Hungary, Italy and Uganda).1
Ecological values of biodiversity can be grasped in a comprehensive way by biodiversity indicators, while market-based (monetary) valuation methods are useful to assess the private monetary benefits biodiversity provides (Nunes and van den Bergh, 2001). However, many public benefits which are often expressed in social/psychological value categories are difficult to monetize or describe with ecological indicators. To draw a complex picture on the multiple values attached to biodiversity, we applied a non-monetary assessment methodology. Non-monetary assessment can best be carried out by qualitative research methods, of which we have chosen the focus group method combined with a visual exercise and a concept mapping task. A total number of eight focus group discussions were planned in the late autumn and winter of 2010/11 in the four case study areas, six of them were run and analysed during this period, and another two (the Ugandan focus groups) were run and analysed during the summer 2011. Only farmers were involved in the research (general citizens were eliminated) partly because the existing literature provides already some findings on the perceptions of the general public, and partly because of time and resource constraints. In each case study area one group was dedicated to organic farmers and the other one to conventional farmers. Focus group discussions were transcribed and analysed according to the qualitative content analysis method (Marying, 2000).
This report (BioBio Deliverable 3.4) gives a detailed overview of the assessment process and provides a comparative analysis of the results. Objective 3.4 – “to evaluate the economic benefits of biodiversity for organic/low-input farming” (BioBio DoW, 2009 p. 41) – has been expanded here to include the non-economic benefits of biodiversity and is broken down into the following aims:
- to present the methodology and the process of the non-monetary assessment of biodiversity carried out in the four case study areas;
- to analyse and compare the results of the assessment process; - and to critically revise the methodology applied for this assessment.
The report proceeds as follows. Introduction is followed by a brief explanation of the theoretical background and a priori hypotheses, and then the methodology used for data collection and analysis is detailed. Chapter 3 gives an overview of the general contextual
1
This task originally aimed at comparing four European countries (France, Hungary, Italy and Wales) but due to external factors we finally decided to include a Ugandan case study instead of the Welch one.
information on focus groups, including the main characteristics of the research areas and the participants as well as the major circumstances of running the focus groups. Chapter 4 contains the comparative analysis. First we discuss here the comparability of results and the possible limitations. This is followed by the detailed analysis grouped along four key questions: (1) how do farmers interpret biodiversity; (2) what kind of attitudes can be identified from the discussions; (3) what are the benefits and who are the beneficiaries of biodiversity; and finally (4) what is the perceived role of farmers in preserving biodiversity (whether their practices are thought to threaten or protect biodiversity). The concluding chapter is divided into three parts: the first part answers the a priori hypotheses defined in the preparatory phase, the second part draws conclusions from the critical review of the methodology, whilst the third part offers some recommendations for science and policy.
2. Theoretical and methodological background
2.1. Theoretical introduction
Biodiversity can be considered a global public good, although it often shows mixed characteristics: most aspects of biodiversity are characterised by rivalry and non-excludability while in the case of marketed goods and services derived from biodiversity rivalry and excludability prevails (Ostrom, 2005; Bela et al., 2008). Moreover, biodiversity works at different levels, such as genes, species and ecosystems. This makes the valuation of biodiversity more complicated, and necessitates the value of biodiversity to be assessed at different hierarchical levels: from the value realized in market exchange through the total economic value to the potential value provided for humanity and the value stemming from the ability of biological diversity to maintain the long term stability of the biosphere (Gowdy, 1997; Bela, 2008; Nijkamp et al., 2008). Beside economic values, ecological and social/psychological values – or in other classifications instrumental and intrinsic values (Nunes and van den Bergh, 2001) – should be also taken into account.
We applied non-monetary valuation methods in order to expand the valuation of biodiversity benefits to the most comprehensive level. Reasons for applying this approach are the ability of non-monetary valuation to focus on the variety and complexity of life and to include the intrinsic value of biodiversity. Moreover, non-monetary valuation applies a holistic approach focusing on the values lying in the integrity, stability and resilience of complex systems; and often has a focus on public engagement, which might lead to social learning and conflict resolution (Nunes and van den Bergh, 2001). A further reason for choosing non-monetary methods comes from previous biodiversity valuation studies, which found that the term biodiversity and the related scientific concepts are not really well-known in local communities (Buijs et al., 2008). Valuation studies therefore often struggle with the distortion stemming from the fact that those who are asked to value the benefits of biodiversity are not really aware of what biodiversity is. Thus it is better to jointly conceptualize first what this term means and how it may relate to the everyday life of the research participants, and then ask them about the benefits. Empirical research experience (e.g. Fisher and Young, 2006) also suggest that discursive approaches which acknowledge and embrace the diverse views of the general public on biodiversity are required to improve public support for biodiversity management and to reduce conflicts.
A few studies have already investigated how biodiversity is perceived by people who are not scientists, although none of them focused directly on contrasting organic and conventional farmers. For instance, Lindemann-Matthies and Bose (2008) and Junge et al. (2009) described an on-site survey research where lay people were asked about their attitudes towards field margins. Soini and Aakkula (2007) conducted in-depth interviews with local residents and
farmers to understand their interpretation of biodiversity on agricultural land. Other studies focused on the interpretations of the general public. For instance Fisher and Young (2006) and Buijs et al (2008) used focus groups to understand the mental constructs of biodiversity in three European countries, while Christie et al. (2006) combined focus groups, choice experiment and contingent valuation in order to value biodiversity in the most comprehensive way. The results of these investigations show that most people have a rich interpretation of biodiversity, although they use a terminology different from the language of science and they often link biodiversity to normative evaluations (Fisher and Young, 2006; Christie et al., 2006). Based on these findings we established the following a priori hypotheses linked to the local understandings of biodiversity:
Hypothesis 1: There are no significant differences between the farmers’ understanding of biodiversity and the scientifically based definition of biodiversity. Hypothesis 2: Organic / low input farmers have a more complex understanding
(more solid knowledge) of biodiversity than conventional farmers.
Hypothesis 3: During the discussions it is possible to develop a common understanding – acceptable for both farmers and scientists – of biodiversity.
Previous research also suggested that despite biodiversity is appreciated (e.g. more diverse field margins are preferred to less diverse ones (Junge et al., 2009) it is difficult for people to conceptualize biodiversity and its benefits in the context of agriculture (Soini and Aakkula, 2007), because its benefits are perceived at a more general level (e.g. it is the basis of human life, it provides balance, it has aesthetic functions and creates a sense of place (Buijs et al., 2008). Thus we formulated the following hypotheses on the perceived value of biodiversity:
Hypothesis 4: Conventional farmers acknowledge more those benefits of biodiversity which can be realised in monetary terms (economic benefits), while organic / low input farmers acknowledge more the indirect (non-economic) benefits of biodiversity.
Hypothesis 5: The more local the level of assessment is, the more benefits of biodiversity participants can perceive.
2.2. Methodological background
2.2.1. Data collection methods
To test our hypotheses described above we applied a mixed methodology for data collection. Basic data were collected from focus group discussions (one organic and one conventional in each country taking part in the research), but before the focus groups we conducted a short questionnaire with farmers already engaged in the BioBio project to collect some personal impressions (see in Annex I).2 With this additional data collection technique we aimed to detect whether participants used different arguments and knowledge base when they were asked personally or within the group. However, as the range of farmers invited to the focus group went beyond the BioBio sample in some case study areas, we could not use the questionnaires for a proper comparison but rather as an additional source of background information about farmers’ way of thinking.
We used focus group as the main data collection method. Focus group discussion refers to interviews with a small group of people on a specific topic, when the aim of the session is to get to know the group’s opinion on the research topic. In this case, group dynamics and interaction between the participants is as important as the answers given to the pre-defined
2
The questionnaires were conducted together with the farm survey carried out within Task 3.2 in order to minimize the time efforts required from farmers (our questions were inserted into the survey as an introductory part only in those case study areas which were designated to the non-monetary assessment).
questions (Barbour, 2007). Focus group method is proposed if the research addresses topics which are unfamiliar or sensitive to the participants, or if the researcher would like to involve powerless social groups. However, the particular reason for choosing this method was that focus groups provide a good occasion for participants to listen to each others’ opinion, and form thoughts together on the issue under investigation, thus it is also useful to understand the process how participants conceptualize a scientific term with their own words and concepts. Based on the literature review and previous focus group experiences, we divided the focus groups into four major parts and an optional fifth step (for the whole guideline and hand outs see in Annex I):
- introduction (with their name and some information about their farm);
- a visual ice-breaking exercise (discussing photos taken in the area which represent different levels of biodiversity, e.g. soil biodiversity, species and habitat diversity); - a concept mapping exercise (a creative and interactive exercise with a brainstorming
phase about the concepts related to biodiversity and with a drawing phase focusing on the relationship between the concepts drawn from the brainstorming phase);
- moderated discussion about the causal links between farming and biodiversity (what are the effects of biodiversity to farming and vice versa);
- optional questions about geographical and time scales (how biodiversity changes over time and space).
Because focus groups were run in different national contexts and participating researchers had slightly different scientific and methodological background, we put strong emphasis on establishing a common ground about the methods and techniques to apply (this is also required to make the data comparable). Thus, we run a pilot focus group in August 2010 to test the guideline and to see the method working. The pilot focus group was organised in Hungary with low-input (but not organic) farmers who run their farms near to the research area but who were not taking part in the BioBio project earlier. As the discussion was scheduled during the high season on the fields, participation remained low (from the 12 invited farmers 9 agreed to come but finally only 3 of them showed up). The main lessons learnt reinforced that (1) the visual exercise is good for starting the discussion as it brings the topic closer to participants, (2) the whole guideline requires almost 2 hours to complete, and (3) the language used should be non-scientific as much as possible. The pilot focus group was transcribed and was used further to test the method of analysis and to develop the coding agenda used later for analysing the texts. First-hand experiences from the pilot focus group were shared during the one day long workshop we organised for participating researchers to discuss and refine the methodology (see the programme in Annex II). The workshop allowed to “taste” how group dynamics works in a concept mapping exercise, and provided some insights into qualitative content analysis by using sequences from the pilot focus group. Based on the discussions we had on the workshop, the focus group guideline and the coding agenda were finalized. Because Ugandan colleagues could not take part on the preparatory workshop an extra meeting was held in April 2011 in Padova, Italy, where Italian and Hungarian colleagues helped the Ugandan team to learn more about the methodology and discussed thoroughly the guideline.
2.2.2. Data analysis
Focus group transcription – as other qualitative data – needs special techniques to analyse. The two most typical analytic methods are content analysis (a bit closer to the quantitative tradition) and the grounded theory method (inherently qualitative). To analyse our focus groups we used a method in between: qualitative content analysis. This method was developed in order to merge the advantages of the two others mentioned above. It examines the themes and main ideas of the text (main content), the context information (latent content)
as well as the formal aspects of the material, but without extensive quantification (Mayring, 2000). We chose this analytical approach because the replicability of the method is a key to produce more easily comparable results from case study areas (helps cross-country comparison), but at the same time its interpretative nature allows to take into account the country level specificities during the analysis (reflects the context-dependency of data). Furthermore, the systematic process of coding and categorization helps levelling off the differences in researchers’ experiences with text analysis.
Qualitative content analysis allows both inductive and deductive coding and category development, but how the categories can be defined is regulated through criteria of definition derived from theoretical background and research questions. We agreed to use the deductive content analysis (a priori coding) in order to make the results easier to compare. The process of deductive content analysis builds upon the idea that a coding agenda is developed from theory and previous results, which gives explicit definitions of each category and determines when and how a text passage can be coded with a category (Mayring, 2000). Then, the researcher works through the text by using this coding agenda, and simply looks up the codes in the text which were defined in the agenda paying also attention to the context of the codes. If there are considerably long passages of the text which cannot be coded according to the agenda but have useful (interesting) content, emergent codes and categories can be defined and added to the coding agenda (revision of categories).
Each team started data analysis by transcribing the focus group discussions (research groups were free to choose between doing the transcriptions by themselves and contracting somebody). The original idea was to transcribe the whole discussions and encode the text from the beginning – this way the comparison of the results of coding and the concept mapping exercise could serve as a source of triangulation. However, time constraints and the different level of existing experiences resulted finally in some divergence among countries (French and Hungarian focus groups were transcribed and analysed from the very beginning, while Italian focus groups were transcribed and coded from that phase when the concept mapping exercise was finished). Coding started with the transcribed data by reading the text carefully and looking up the predefined codes. It was again the free choice of researchers to use software for the analysis (NVivo® was suggested) or doing the analysis “by hand”. During the analysis participating researchers could share ideas and improve the process continuously (e.g. if technical assistance or procedural advice was needed). Once the coding was finished, researchers were asked to fill in the coding agenda with typical references and explanations about the contextual and attitudinal characteristics of the code (see the detailed coding agenda in Annex III). The filled-in coding agendas were used as the main source of data for the comparative analysis. To check the comparability of the results we contrasted some codes (the references coded by the same codes) and run some basic statistics on coding frequency (see chapter 4.1). If it was necessary, further input or clarification was asked by participating researchers. In a few cases iterative coding was applied (e.g. Hungarian transcriptions were coded again with two codes – species diversity and preserving biodiversity – when we recognised that the logic French and Italian teams followed with these codes was different from that of the Hungarian colleagues).
3. General contextual information on the focus groups
3.1. The local context of focus groups
The focus groups were organised in three research areas within Europe and another one within Africa which show different land use characteristics: arable farming systems were studied in the Midi-Pyrénées, France; extensive grazing systems were chosen from the
Homokhátság, Hungary; vineyards were selected from the Veneto Region in Italy, and small-scale arable farming were studied in Kayunga, Uganda, which is one of the tropical countries of East-Africa lying on the Equator.
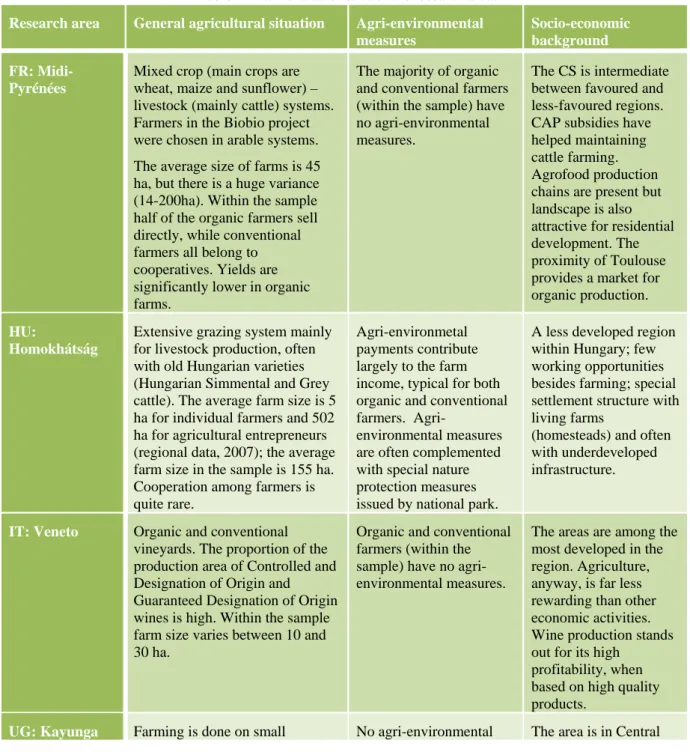
As the main contextual factors (such as the dominant farming system, the general agricultural situation, and the socio-economic characteristics of the communities included) can have an influence on how farmers think and act in the focus groups and which topics they bring into the conversation, we provide here a brief introduction to the four research areas (Table 1) based on the report “Delimitation of BIOBIO Case Study Regions and the Selection of Case Study Farms” (D3.1). The table also calls our attention to the fact that the farmers chosen to participate in the focus groups are often in special situation within their country (e.g. Hungarian farmers run their farm in a protected area and Italian farmers are high quality wine producers who brand and sell their own wine, which means that their ideas may differ from the general attitudes of “average” farmers), which reflects well the heterogeneity of farmers within and beyond Europe.
Table 1: Main characteristics of the research areas
Research area General agricultural situation Agri-environmental
measures
Socio-economic background FR:
Midi-Pyrénées
Mixed crop (main crops are wheat, maize and sunflower) – livestock (mainly cattle) systems. Farmers in the Biobio project were chosen in arable systems. The average size of farms is 45 ha, but there is a huge variance (14-200ha). Within the sample half of the organic farmers sell directly, while conventional farmers all belong to cooperatives. Yields are significantly lower in organic farms.
The majority of organic and conventional farmers (within the sample) have no agri-environmental measures.
The CS is intermediate between favoured and less-favoured regions. CAP subsidies have helped maintaining cattle farming. Agrofood production chains are present but landscape is also attractive for residential development. The proximity of Toulouse provides a market for organic production.
HU:
Homokhátság
Extensive grazing system mainly for livestock production, often with old Hungarian varieties (Hungarian Simmental and Grey cattle). The average farm size is 5 ha for individual farmers and 502 ha for agricultural entrepreneurs (regional data, 2007); the average farm size in the sample is 155 ha. Cooperation among farmers is quite rare.
Agri-environmetal payments contribute largely to the farm income, typical for both organic and conventional farmers.
Agri-environmental measures are often complemented with special nature protection measures issued by national park.
A less developed region within Hungary; few working opportunities besides farming; special settlement structure with living farms
(homesteads) and often with underdeveloped infrastructure.
IT: Veneto Organic and conventional
vineyards. The proportion of the production area of Controlled and Designation of Origin and Guaranteed Designation of Origin wines is high. Within the sample farm size varies between 10 and 30 ha.
Organic and conventional farmers (within the sample) have no agri-environmental measures.
The areas are among the most developed in the region. Agriculture, anyway, is far less rewarding than other economic activities. Wine production stands out for its high
profitability, when based on high quality products.
acreages, usually less than 1 acre (~0.4 ha), using family labour hand hoe. There is both a lot of interspecific diversity and intraspecific diversity on farms. A plot can have as many as 5 crops intercropped; and a single crop e.g. bananas can have as many as 8 different cultivars planted by the farmer. Usually fruit trees are part of the farm lands, and although some of the fruits e.g. jackfruits are not purposively planted by the farmers they are protected and maintained once they establish in the fields. A farmer can have as many as 10 different crops planted or maintained on his plot.
schemes exist in the case study area.
Uganda, about 100km away from the capital city. Farming is the main source of income; only about 10% of the population is engaged in other employments in addition to farming. The main crops are
pineapple and coffee for cash, maize, cassava, banana, sweet potatoe, rice, bean and
groundnut mainly for food; but they are as well important sources of income.
3.2. General overview of focus group participants
3.2.1. Homogeneity of focus groups
The key aspect to homogenise the focus groups was farm type (organic or conventional), but also the farming system and the approximate size of the farms were roughly similar within the groups. However, we did not have the possibility to homogenise the groups according to age, gender and educational level because of the relatively small size of the sample. While age heterogeneity was not a decisive factor, differences in the educational background and gender seemed to influence the discussion (see more details in the next section). In France and Italy farmers who did not belong to the BioBio project were also invited in order to balance the relatively high refusal rate, but both the group dynamics and the preparatory questionnaire reinforced that belonging to the BioBio sample is not a determining variable.3
Organic focus groups showed homogeneity in the attitudes and general approaches of farmers (almost all of them decided to be organic because of personal/philosophical motivation), while conventional groups were more heterogeneous in this aspect. Especially the French conventional focus group showed conflicting approaches among conventional farmers. In this group some farmers have adopted alternative practices such as minimum tillage, direct sowing and cover cropping partly because they care about the impact of their practices on the environment (hence they showed more similarities with organic farmers), while other participants were pure intensive farmers who focused mainly on the utility biodiversity provides for their agricultural activity. The Hungarian conventional focus group was also interesting in this aspect: participating farmers run low-input farms partly because of the increasing costs of intensive production and partly because of the strong nature conservation rules in the region. Thus, their practices may be close to organic farming, but their attitudes are rather related to intensive production. In the Ugandan case differences between organic and conventional famers and especially among conventional farmers were less visible. Here both conventional and organic farmers were of nearly the same social status with approximately the same farm size. There was also less variation in the educational levels both within and across the groups. What is important, however, is how farmers decide to be
3
We checked for instance whether the fact that a farmer has taken part in BioBio from the beginning has an influence on the first hand impressions about what biodiversity is or on the typical reasons for loving the area where participants live, but comparing the answers of BioBio and non-BioBio farmers within the Italian sample we did not find any significant discrepancy.
organic or remain conventional farmers. The first aspect is the cost and the requirements to become a certified organic farmer which limits some farmers to get into organic farming even when they seldom use chemicals or fertilizers. Organic farmers are also externally motivated to get into organic farming. Companies that are involved in buying organic fruit produce from certified organic farmers are the ones that take a leading role in encouraging farmers to be organic. Some of the conventional farmers mentioned that they would get organic if they were sure of the market. Therefore we pay special attention during the comparative analysis to figure out whether there is further differentiation within the conventional and organic groups of farmers appears in the participating countries; and whether it has a special influence on the discussion and the results.
3.2.2. Preparatory questionnaires: background information on participants
Before running the focus groups, we conducted a preparatory questionnaire (see in Annex I) with the organic and conventional farmers involved in the BioBio project (a total number of 38 questionnaires were filled in, and 29 questionnaires were analyzed in the three European countries, in Uganda only qualitative analysis was done).4 The first two questions addressed the personal relationship of farmers to the case study area. Focus group participants in general showed quite large variance in the length of time they spent in the research area (either by farming or by living there). Hungarian and Ugandan farmers, however, were a bit different in this aspect: the majority were born and raised here and they inherited the farm from their parents. The time spent in the particular locality can have an influence on the local knowledge of farmers on species and habitats, and can also affect their personal attachment to the landscape. For example, when Hungarian farmers were asked in the questionnaire why they like living in the area, most of them referred back to their family roots (“I was born here, everything links me here”). Only farmers moving in the area later talked about the beauty of the landscape or the freedom of living and farming in the plain. In Uganda, participating farmers appreciated their place of living because of the fertile soils and the good weather that enables them to get good yields, and the ability of their area to support a variety of both crops and trees. Another reason given by some Ugandan farmers was the proximity to town and the available market for their produce. This is clearly different in the case of Italian and French farmers, who were attracted mostly by the heterogeneous hilly environment, the magnificent view, the natural beauty of the surroundings, the peaceful and colourful landscape. Only some of them accounted for the good territorial potential for agriculture (e.g. the good climate, the specific soil etc).
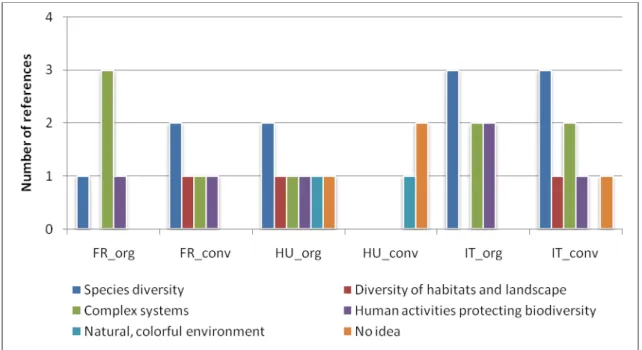
The third question of the questionnaire addressed the existing knowledge of farmers about biodiversity. As Figure 2 shows,5 farmers linked the concept most frequently to the richness of species (e.g. “The presence of many species and varieties…” or “Heterogeneity” or “The
4
In France and Hungary the survey was conducted among farmers participating in the BioBio project, while in Italy all focus group participants were asked during the survey. This resulted in a distortion within the sample of the survey: in Hungary and Uganda all focus group participants belonged to the BioBio sample and hence filled in the survey, in Italy all focus group participants filled in the survey also but some of them were non-BioBio farmers, and in France only those focus group participants filled in the survey who belonged to the BioBio sample (thus we miss the answers of the non-BioBio farmers participating at the focus group discussions). In the analysis we skipped the answers of those BioBio farmers who did not participate at the focus groups. Ugandan data were only processed in qualitative ways.
5
We asked an open question to trigger as much associations on biodiversity as possible. Notes were taken to record the answers. During the analysis we grouped the answers into five categories (species diversity, habitat and landscape diversity, complex systems, human activities to protect biodiversity, natural and colourful environment, and no idea). If a respondent referred to more aspects of biodiversity at the same time, we noted the different aspects as distinct references (e.g. the following answer – “The number of animal and plant species, trees, grasses and insects. Biodiversity represents the full richness of life.” – were noted as two references, one referring to species diversity and the other one referring to complexity.)
number of animal and plant species, trees, grasses and insects”); the two exceptions are the French organic and the Hungarian conventional group, where species richness was not a typical answer. The second most frequent answer – which was the dominant one in the French organic group and was also typical in the Italian groups – referred to biodiversity as a complex system (e.g. “Integrity and complexity of the natural wild habitat” or “Symbiosis”). Ideas related to biodiversity management (how to preserve biodiversity, what are the biodiversity friendly farming practices) were more popular among organic farmers (it was mentioned in each organic group once at least), while habitats diversity was mentioned relatively rarely. Four farmers (three of them were conventional farmers) could not give any explanation of the term and admitted that they did not know what biodiversity means. Another two farmers mentioned the beauty of the natural and colourful environment without any reference to the biological content of the concept. This shows that there is a lack of scientific knowledge among farmers – especially in Hungary – about the meaning of biodiversity (the six farmers who had no clear idea of biodiversity account for the 20% of respondents), which makes it difficult for them to link the concept to their real life experiences and local knowledge.
Figure 2: Individual interpretations of biodiversity (excepting the Ugandan data)
3.3. Running the focus groups
3.3.1. General management of focus groups
A pilot focus group was organised in August 2010 in Hungary, in order to test the methodology and the guidelines developed earlier. Because both the moderation and analysis guideline were improved after this event, data and results from the pilot focus group were not included in the comparative analysis. Some general information about the focus groups is indicated in Table 2.
Table2: General information about focus groups
Research area Date Place Length Participants Comments
FR Organic 15-10-2010 City hall 120
min
8 farmers 3 people came from the same family farm, 2 of the participants were female.
Conventional min local inhabitant, one participant was late.
HU Organic 26-11-2010 Restaurant 150
min
7 farmers 2 people were from the same family farm, and 3 of the participants were female. Most of them have known each other earlier.
HU
Conventional
24-11-2010 Restaurant 80 min 3 farmers More farmers promised to come but finally they did not, probably because field works were postponed to late autumn due to weather extremes.
IT Organic 07-12-2010 University 120
min
8 farmers More farmers were willing to participate but the heavy fog set them back. Participants represented 6 farms (3 of them external to BioBio).
IT
Conventional
12-01-2011 University 90 min 6 farmers 2 female and 4 male farmers participated, 2 of them external to the BioBio project.
UG Organic 16-07-2011 Small room in
the trading centre
105 min
8 farmers Farmers came in time. It was a very lively discussion in spite of the hot climate inside the room. Both male and female farmers were present.
UG Conventional 16-07-2011 Small room in the trading centre 120 min
7 farmers 3 participants came late with one participant sending her 18 year old son to represent her. Both male and female farmers were present. According to the table, the focus groups attracted 6-11 participants in general (excepting the Hungarian conventional focus group where only 3 farmers came), which fits to the methodological expectations. Both extremes – having too few or too many participants – put extra pressure on the moderator: in the first case it was difficult to encourage farmers to speak about their opinion and to trigger new ideas, in the second case it was uneasy to keep the focus (avoid small talks in groups of 2-3) and to give everyone equal opportunity to speak. The average length of the meetings varied between 80 and 150 minutes – the longer meetings usually included the lunch or dinner – with an average of 115, which is a bit longer than a “normal” focus group. However, the research group consciously decided to conduct a longer guideline in order to include the concept mapping exercise as one of the most important tools to get to know more about the general way of thinking of farmers about biodiversity.
3.3.2. Moderation and group dynamics
Most of the focus groups went on in a friendly and open atmosphere; people were usually talkative and were happy to share ideas, especially when they could talk about what they observed on their fields or how they did farming. Sometimes we could even reach a personal-philosophical level in the discussion when participants started to talk about family background, personal feelings and approach to life. Exceptions were the Hungarian and Italian conventional groups which started in a bit freezing mood. We can identify two reasons for this negative tone. On the one hand, there were some better educated participants in both groups (one in the Hungarian and three in the Italian group), who could dominate the discussion and probably made other participants feel a bit embarrassed for their lack of knowledge and weaker oral skills. On the other hand, the concept of biodiversity and thus the whole topic of the discussion were unfamiliar to the participants of the Hungarian and Italian conventional focus groups (they remained confused even after a clear definition and examples
were provided by the moderator), which made them uneasy to speak about their ideas. This was also the case in Uganda, where farmers could not easily comprehend the different aspects of biodiversity we were interested in. Careful moderation was able to release this atmosphere to some extent, but farmers remained more silent all along in these groups and sometimes the moderator had to stimulate participants personally to add comments.
We observed that in the organic focus groups participants were more willing to agree on the topics discussed and often reached consensus without the influence of the moderator. In the conventional focus groups, on the contrary, debate and disagreement was more frequent. This can be traced back to the differences in the participating farmers’ general approach. In almost all of the conventional focus groups there were a few farmers who were thinking on converting to organic farming, or who remained conventional only because the certificate and the quality control is too costly. Their attitudes showed more similarities with organic farmers than with other (“real”) conventional ones, which could trigger tensions during the discussions. However, it was nice to see how participants handled this situation – they were quite open to each other and accepted if somebody had a different opinion (e.g. in the Hungarian conventional group one farmer said that having different opinions is also a sign of biodiversity). Beside debate and agreement, other types of interaction were also present in the focus groups. Farmers asked questions from each other and often reinforced the opinion or knowledge of another participant. Although farmers were interested in the results of the field studies conducted on their farms and asked the scientists about this issue, it was not difficult to keep the role of the moderator during the discussion (farmers accepted the structure and aim of the discussion).
One more interesting aspect of the group dynamics could be the gender issue, although only the Hungarian organic focus group provided detailed information on this topic (in Uganda, where also more female farmers were present, no differences were observed between the male and female participants in activity). In the Hungarian organic focus group we found that female farmers had a different approach to farming and nature; they were more emotional, more sensual and paid more attention to the benefits of biodiversity related to health and family life. Male farmers often did not pay full attention when women were talking. Women often started their speech with "sorry for telling my opinion" which shows that they have a secondary position concerning the management of the farm (men are the leaders, women help them with administration). Women used to talk after each other. This shows that they felt uneasy to take over the discussion from men, but once one of them was brave enough to talk, others followed her.
Each focus group was moderated by a native scientist who was helped by colleagues (with organizing the meeting, introducing the project, taking notes and photos etc., and in Uganda to support personally the participants if any help was needed in clarification or self-expression). All the moderators had some earlier experiences with qualitative or participatory research, and the Budapest training gave all of them the same methodological background. The same focus group guideline was followed by each moderator (translated into native language), but there were some differences in the emphasis and time allocated to different topics according to the specific characteristics of the groups. In the Italian focus groups a computer was used to make the structure of the guideline transparent to participants and to show them the pictures. The French and Hungarian focus groups were organized in a low-tech way, only printed pictures, pencils and blank sheets of paper were used. The main challenges of the moderation were keeping the focus and provide all participants with equal opportunities to speak, while encouraging silent participants, avoiding small group discussions and balancing gender relations appeared only occasionally. A critical reflection about the used methodology is shared in the Conclusion (chapter 5.2).
4. General and comparative analysis
4.1. The comparability of results
The data collected from the focus groups allows for a twofold comparison: comparison across countries and along the conventional-organic dimension. As an initial step of the analysis we first check whether there is any characteristic pattern of divergence among the frequency of codes (the total number of references coded with the same code). The semi-quantitative analysis of frequency data is used here to shed light on the major differences and similarities between the focus groups, which can help focusing on the qualitative analysis. Frequency analysis is not intended to explain causal relationships; indeed, the small number of focus groups and overall participants and the differences within coding makes it impossible. Following the overview of basic statistical data we discuss the possible sources of distortion stemming from data collection and analysis that can influence the results. This helps us define the appropriate level of comparison.
4.1.1. Basic statistics
We used 20 a priori codes and a few emergent codes for the qualitative content analysis (see the full list with detailed descriptions and references of codes in Annex III). Emergent codes were built into the comparison if they were used by more than one team, but even in this case we checked first if they are used to refer to the same content by all teams. Based on this comparison, some emergent coding categories were renamed (sometimes merged or split up) and standardized as follows:
- biodiversity as a nuisance6 (in IT and UG focus groups this included also the costs and the negative effects of biodiversity) = negative effects of biodiversity (HU focus groups) = economic values code (FR focus groups) was used originally to code these references but costs and other negative effects were sorted out into the category of negative effects of biodiversity;
- preserving biodiversity (HU focus groups) = preserving biodiversity (individual and collective level together) (FR focus groups) = good farming practices enhancing biodiversity (IT focus groups) = good farming practices that enhance biodiversity (UG focus groups);
- complex systems (FR focus groups) = complex systems (HU focus groups) = complexity and system approach (IT focus groups), not mentioned in Uganda;
- environmental policy (IT focus groups) = policy and nature conservation codes together (HU focus groups), not mentioned in Uganda;
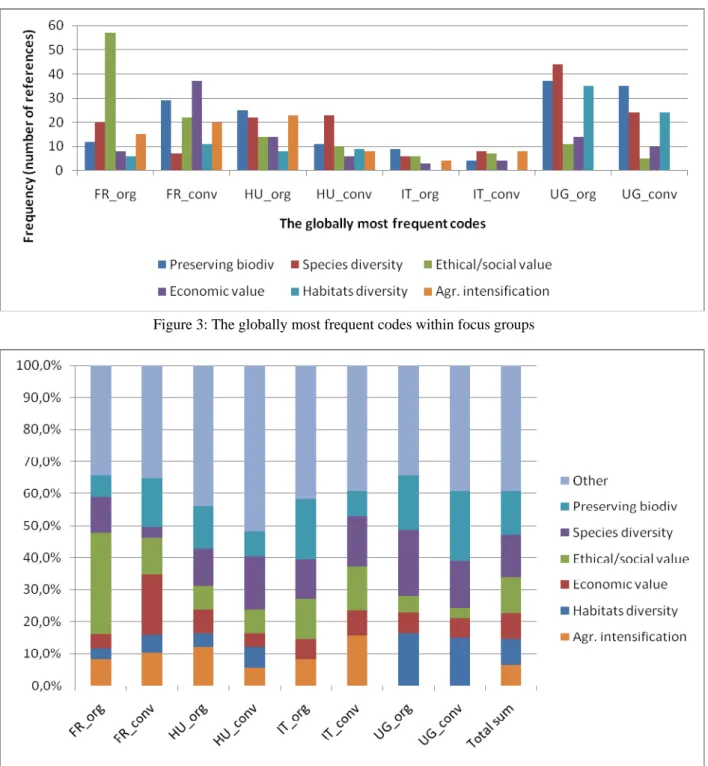
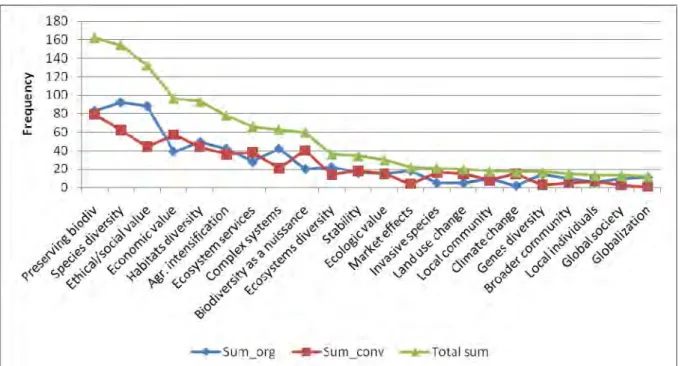
- farming (HU focus groups) = organic farming and biodiversity (IT focus groups). Figure 3 shows the number of references coded with the globally most frequent codes,7 while Figure 4 represents the relative frequency of codes (the percentage of the number of references of a given code compared to the total number of references coded in the same text) across the different focus groups. Both graphs indicate that the frequency is highly variable both within countries and between countries. Some codes got into the list of most frequent
6
Codes written with bold letters were included in the statistical comparison, while codes written with normal letters were used in the country-specific analysis.
7
The six globally most frequent codes cover at least 50% of the total number of references in each focus group, while the remaining 14 (plus the inductive codes defined from the text) were much less frequent and showed a huge variance along the different groups. Thus we focused our analysis mainly to these six most frequent codes.
codes because they were highly overrepresented in one or two focus groups (e.g. the ethical/social value which was overrepresented in the French organic focus group or preserving biodiversity in the two Ugandan focus groups), while others gained relatively similar importance across the different groups (e.g. economic value). Some codes show clear differences by the organic-conventional aspect, for instance in most countries ethical/social values are more frequent in the organic groups than in conventional ones.
The huge variance among the groups can be traced back to several reasons. Differences in the moderation or the coding can have a strong impact on the frequency of codes. For instance, the diverging patterns between the Italian focus groups and the rest might be traced back to methodological differences, namely to the fact that the first half of the Italian focus group discussions (the visual and the concept mapping exercise) were not transcribed and coded, thus the codes account only for half of the discussions. The difference in the number of
Figure 3: The globally most frequent codes within focus groups
participants may also affect the results (the higher number of participants may imply that the same topic is raised several times during the discussion when participants agree with each other or reinforce the other’s opinion, thus the frequency of the same code increases).8 Another reason can be that focus group participants are embedded in different socio-economic and environmental contexts, and these contextual specificities might be reflected by the different frequency of certain codes.9 Differences seem especially large between the European and the Ugandan focus groups. Without the Ugandan results, the list and the rank of the six most frequent codes are different. For instance, social/ethical value is the most frequent code and complexity also appears among the six most frequent ones if the Ugandan data are filtered. On the contrary, the codes of preserving biodiversity, species diversity and habitats diversity are overemphasised in the Ugandan focus groups, presumably because farmers face much larger species diversity and richer habitats than in Europe. The existence of context-specific differences is further reinforced by the fact that the European data indicate larger homogeneity across and within groups if the Ugandan results are filtered. This shows that the possibilities to compare the European and Ugandan results are limited.
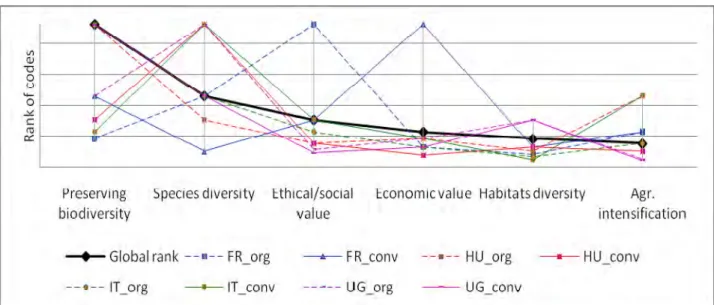
Figure 5 reinforces that there is no characteristic pattern of divergence when we compare the ranks of the most frequent codes between countries. In this graph the black line signs the ranks of the globally most frequent codes from the highest rank to the 6th rank, while the coloured and dotted lines signs the ranks the codes received in different focus groups. All codes show a great variance (indeed, some of them appear in the list only because they were overrepresented in one or two focus groups). It is also important to see that in the European countries organic and conventional focus groups run in the same country often move in the opposite direction. Although in Uganda there is less divergence between organic and conventional groups in the ranks of the most important codes, there were much more references in the organic, than in the conventional group, which shows that biodiversity is a more important (and more valuable) concept for organic farmers. All these observations hold forth interesting results from the comparison of conventional and organic focus groups.
8
One possibility to overcome this problem is to normalize the coding frequency for the number of participants. However, due to the differences in the group dynamics (moderation) and in the coding, it is difficult to filter out the exact effect of the number of participants (especially because moderation and coding may either balance or strengthen the effect of the growing number of participants).
9
We checked with ANOVA analysis whether the differences in coding frequency are linked to the countries or to the organic/ conventional aspect, but we did not find statistically significant relationships.
Figure 6 compares the frequency of codes along the organic/conventional divide and illuminates that a few codes have clearly different importance for organic and for conventional farmers (e.g. ethical/social value, species diversity and complex systems are more frequent in organic focus groups while economic benefits, ecosystem services and biodiversity as a nuisance are more often referred in conventional focus groups). This again suggests that the comparison of the attitudes and knowledge of organic and conventional farmers can reveal some key differences between the two groups.
Figure 6: Comparing the frequency of codes between organic and conventional focus groups 4.1.2. The validity and generalisability of results
Research design and sampling in qualitative research has an important role to make results comparable, because the heterogeneous social-cultural contexts into which the case studies are embedded as well as the researchers themselves can strongly influence the results. The possible sources of bias are thus the following: 1) bias stemming from the different contextual factors, 2) bias stemming from the recruitment of participants and 3) bias caused by the uncontrolled use of methodology.
4.1.2.1. Contextual bias
The social-cultural context of the research may affect farmers’ general attitudes and knowledge, their willingness and ability to take part in group discussions and share ideas, the main challenges faced in their agricultural activity etc. One of the strengths of qualitative analysis lies in its ability to conceptualize the relationship between results and their context, although this kind of studies needs a larger sample within participating countries and a comprehensive analysis of the contextual factors. The limited time and resources for this task did not allow us to carry out a detailed contextual analysis, only a few major data were collected beside the focus groups. Thus, cross-country comparison in our case would lead to uncontrolled distortion and speculation because we are not able to check the direct/indirect effects of contextual factors on the heterogeneity of results.10 Socio-economic and cultural
10
For instance the limited interaction within the Hungarian conventional focus group compared to the French and Italian examples could be explained by the disruption in democratic tradition and open discourse, but simple reasons such as the oral ability of participants or the unfamiliarity of the concept in focus can also be accused for
differences between the European countries and Uganda makes the cross-country comparison even more difficult, and the highly variable results of the coding frequency analysis (see chapter 4.1.1.) suggests that the Ugandan results should be interpreted in a somewhat different way.
4.1.2.2. Recruitment bias
As we described earlier, the majority of farmers participating in this focus group research were already involved in the BioBio project, while some farmers were invited to the discussions from outside. Within the BioBio project the main selection criteria were the type and intensity of farming within the given case study region in order to measure and compare biodiversity indicators appropriately. This means that BioBio farmers taking part in the focus group discussions are not necessarily representative for the case study region and still less typical within the whole country, especially because their farms are usually specialised (from France only arable farmers, from Italy only wine producers, from Hungary only animal breeders and from Uganda only small-scale crop producers were included in the focus groups, without providing an overlap of farm types across countries). This is clearly showed by the Ugandan example, where BioBio participants were averagely better off than the rest of the community members. The organic farmers who were involved in the Ugandan study were those who had previously been selected by pineapple exporters. These farmers therefore had to have sizeable land, the minimum education and the zeal and some expertise to manage the crop.
Moreover, as farmers were involved in the BioBio project, they met earlier with scientists and they could change ideas about the environmental performance of their farm. Thus they may have become more aware of biodiversity than the average farmers within the case study area. In some focus groups non-BioBio farmers were also invited if they fitted to the selection criteria of running the same type of farm within the same case study area. Although their self-selection may also result in some distortion (those farmers came who were more interested in biodiversity or who already practiced alternative ways of farming), their participation in the discussions could balance to some extent the distortion stemming from the original BioBio sample.
Bias stemming from the recruitment could be best reduced by running “control” focus groups, that is, focus groups with non-BioBio farmers, both organic and conventional ones. Generalisability of the results could be further enhanced if all the different farming types would be addressed through different focus groups in each case study area. Thus, a possible future improvement of our research could be to enlarge our sample and organise focus group discussions for organic and conventional farmers who run different types of farms (arable crops, vineyard, and animal husbandry).
4.1.2.3. Methodological bias
When we designed the focus group guideline and the process of analysis we put strong emphasis on minimizing the distortion stemming from the fact that participating researchers had a quite heterogeneous background and experience with qualitative research. Although running focus groups is not the easiest way to collect standardized data, we unified the structure of the focus groups and the list of photo subjects, and limited the independent choice of researchers to context dependent issues (such as supporting the group dynamics or wording
such a phenomenon. Without checking the validity of the possible explanations with empirical results, we cannot give an appropriate answer in this aspect.
the questions).11 The choice of the qualitative content analysis method, and especially deductive coding, was also led by the claim of enhancing the comparability of results, since the process of analysis can be more systematic and replicable by using an a priori coding agenda. The level of standardisation was increased further during the preparatory workshop where we discussed in details the focus group guideline and the coding agenda, and we experimented with these techniques in simulations. Beside these efforts, our data show some clear differences among countries, related mainly to coding (coding density is smaller and the length of the coded sequences is shorter in the Italian case than in the French and Hungarian focus group transcriptions, while Ugandan coding density is higher than the European average) which makes cross-country comparison more difficult.
4.1.2.4. Delimitation of the results
The basic statistical data and the overview of the possible sources of bias both reinforce that
focus group data are more suitable for the comparison of organic and conventional focus groups, while the comparison of data across countries would be more risky and would
weaken the explanatory power of the study. The reasons which reinforce that we focus the analysis on the comparison of organic and conventional farmers are the following:
‐ in each country both the organic and the conventional groups are embedded into the same socio-cultural context (distortion stemming from the different local context can be minimized);
‐ in France and Italy both focus groups involved non-BioBio farmers beside farmers belonging to the original sample of the project, while in Hungary and Uganda only BioBio farmers took part in the focus groups (non-BioBio farmers participated in the Hungarian pilot focus group but we did not build in the results of this discussion into the comparative analysis);
‐ in each country both the organic and the conventional groups were moderated by the same person in the same way (distortion stemming from the different moderation technique can be minimized);
The comparative results of this focus group research are valid mainly for BioBio farmers in the four case study regions, and can be generalized to the case study areas with some restrictions (based on the typicality of farmers taking part in the focus groups). However, results that are based on group dynamics and interaction among farmers may provide important insights for focus group research in general, and for qualitative biodiversity studies in particular.
4.2. Results of the comparative analysis
4.2.1. Interpretation of biodiversity
One of the main aims of the focus groups was to understand how farmers frame the concept of biodiversity, thus we dedicated the ice-breaking visual exercise and the concept mapping exercise to this aim. The picture representing the landscape level generated many ideas and
11
In the Ugandan case there were some context-specific issues which required specific moderation. For instance the moderator had two supporting colleagues, one of whom was responsible for helping the participants in understanding and expressing themselves (this was atypical in the European focus groups). The mind map was also prepared in a somewhat different way: in lieu of the individual brainstorming the moderator asked the opinion of participants and wrote down their ideas. Due to socio-economic and cultural differences, some of the tasks worked differently in Uganda then in the European case studies, e.g. the photo subjects were not interpreted by farmers as it was intended.
recalled positive feelings in the ice-breaking phase (especially in the Italian and Hungarian focus groups), which suggests that people are attracted the most by the scenic view of the diverse and open horizon, but can also indicate that this picture was the most familiar to farmers. The photo representing soil and earthworms was also an important topic of discussion in the French and Hungarian groups, despite being the least favoured picture in the Italian groups. An important difference between the organic and conventional groups was that conventional farmers regarded the photos more from a rational point of view (at least in the Hungarian and French case) as they talked about the benefits of earthworms and insects or the costs caused by certain species or pests, while organic farmers had a more complex and philosophical argumentation. This was again different in the Italian case where farmers expressed feelings and attitudes rather than rational arguments for or against certain pictures. Similarly, the Ugandan participants could not easily relate the pictures to the different ways of explaining biodiversity, thus they used feelings rather than rational arguments when they talked about the pictures.12 Therefore we can draw two interesting questions from the visual exercise, which can help us deepen and enrich the comparative analysis: 1) what is the most appropriate level of addressing biodiversity (is it really the landscape level or was it overemphasised here because of the visual character of the exercise)? and 2) do farmers use feelings or rather rational arguments when they talk about the importance of biodiversity? 4.2.1.1. Concept maps in the French focus groups
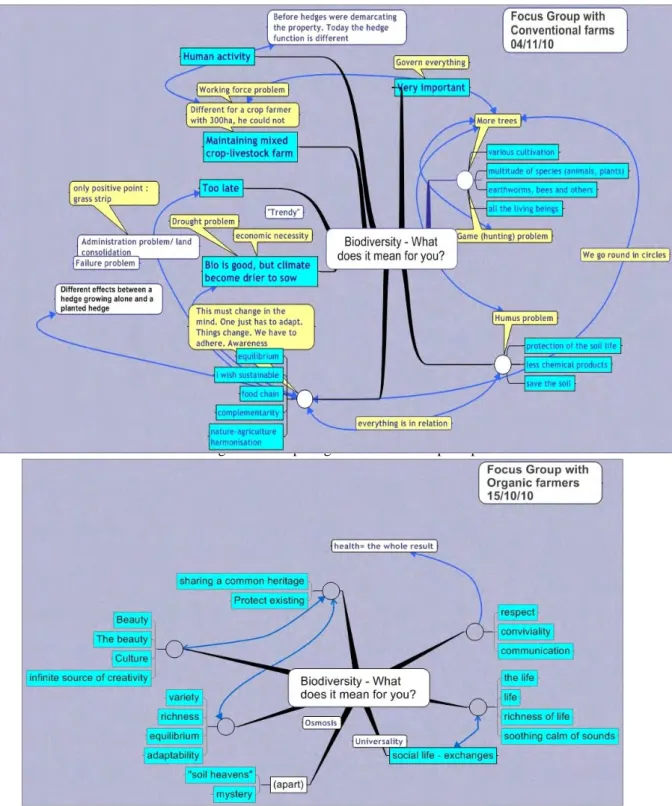
Concept maps give a graphical representation of the concepts farmers linked to biodiversity, and show clear differences among the different groups. The French concept maps are really dense and complex compared to the pictures drawn in other countries. This indicates that biodiversity is understood by participating farmers and is deeply embedded into their conceptual frameworks (because they can link it to many other aspects of life). Organic and conventional concept maps have; however, different messages (see Figure 7 for a comparison). The organic concept map is pervaded by a strong philosophical/ethical
commitment. Here the starting point to define biodiversity was the richness of life.
Ethical/social values (e.g. beauty, creativity, culture) and ecological values (equilibrium, adaptability) are attached to biodiversity. Biodiversity is often treated as a human being, which has to be respected (because of its mystery and universality). Normative aspects of the discussion referred to respect, communication and protection of biodiversity. No practicalities (e.g. direct effects of biodiversity on agriculture or vice versa) were put onto the map; and neither species nor landscape diversity was addressed directly – the map remained at a higher philosophical level. The conventional concept map, on the contrary, was much more
problem oriented and linked to practical issues (mainly to farming and its local context).
Species diversity was written down explicitly on the map (notes were taken such as: more trees, earthworms and bees, multitude of species etc.), and was linked to complex issues (e.g. equilibrium, sustainability, complementarity etc.) through soil. Soil (and the maintenance of soil diversity) had a special importance here (probably because some farmers practiced zero ploughing), which indicates also that biodiversity gains its significance through its direct relationship with agriculture. A considerable part of the map contains notes on human activity: especially the role of agriculture in biodiversity protection and the economic, social and policy context of agriculture (e.g. working force, administration problem, awareness) was emphasised. The map reflects a problem-oriented approach: the word “problem” appears five
12
The overrepresentation of feelings and emotions within the argumentation can also be the effect of the visual technique we applied, because the pictures represented well-known and loved scenes from the close surroundings of the farmers. For instance in the Hungarian focus groups farmers started to talk about whose farm was on the pictures, how far is that from their own farm, how the scene changed due to the extreme weather this year etc. But this was the exact target of this exercise: to bring the topic closer to participants and to find the personal links to this issue.
times and draws a circular relationship between biodiversity farming contextual factors of farming biodiversity.
4.2.1.2. Concept maps in the Hungarian focus groups
The Hungarian concept maps were different both in their focus and their scope (see Figure 8). Organic farmers were energized by this task and centred their notes on five main issues: the complex nature of biodiversity; how biodiversity appears; why it has a key importance; what are the problems endangering biodiversity; and what should be done to protect biodiversity. It is worth noting that in this focus group the landscape level was addressed directly – the
Figure 7: Comparing the French concept maps