To link to this article
: DOI: 10.1088/0022-3727/44/18/185401
http://dx.doi.org/10.1088/0022-3727/44/18/185401
This is an author-deposited version published in:
http://oatao.univ-toulouse.fr/
Eprints ID: 5601
To cite this version:
Lalanne, M. and Demont , Philippe and Barnabé, Antoine Ac conductivity
and dielectric properties of CuFe1−xCrxO2 : Mg delafossite.
(2011)
Journal of Physics D: Applied Physics, vol. 44 (n° 18). pp.
185401(1)-185401(7). ISSN 0022-3727
Open Archive Toulouse Archive Ouverte (OATAO)
OATAO is an open access repository that collects the work of Toulouse researchers
and makes it freely available over the web where possible.
Any correspondence concerning this service should be sent to the repository
administrator:
staff-oatao@listes.diff.inp-toulouse.fr
doi:10.1088/0022-3727/44/18/185401
Ac conductivity and dielectric properties
of CuFe
1
−
x
Cr
x
O
2
: Mg delafossite
M Lalanne, P Demont and A Barnab´e
Institut Carnot CIRIMAT, Universit´e de Toulouse UPS, 118 Route de Narbonne, 31062, Toulouse cedex 9 France
E-mail:demont@cict.fr
Abstract
The electrical and dielectric properties of CuFe1−xCrxO2(0 6 x 6 1) powders, doped with
3% of Mg and prepared by solid-state reaction, were studied by broadband dielectric spectroscopy in the temperature range from −100 to 150◦
C. The frequency-dependent electrical and dielectric data have been discussed in the framework of a power law conductivity and complex impedance and dielectric modulus. At room temperature, the ac conductivity behaviour is characteristic of the charge transport in CuFe1−xCrxO2powders. The substitution
of Fe3+by Cr3+results in an increase in dc conductivity and a decrease in the Cu+–Cu+ distance. Dc conductivity, characteristic onset frequency and Havriliak–Negami characteristics relaxation times are thermally activated above −40◦
C for x = 0.835. The associated activation energies obtained from dc and ac conductivity and from impedance and modulus losses are similar and show that CuFe1−xCrxO2delafossite powders satisfy the BNN relation.
Dc and ac conductivities have the same transport mechanism, namely thermally activated nearest neighbour hopping and tunnelling hopping above and below −40◦
C, respectively.
1. Introduction
For more than 30 years, delafossite compounds have been studied for their unusual magnetic and electrical properties [1–3]. More recently, delafossite compounds have attracted much attention since Kawazoe et al [4] showed that CuAlO2
was a good candidate for p-type transparent conducting oxides (TCO). The development of p-type TCO is one of the most crucial technologies for p–n junction-based devices such as transparent solar cells and transparent light-emitting diodes. Among various materials, copper metal oxide with the molar ratio Cu/M = 1, i.e. CuMO2, with M = {Al, Ga, Cr, . . . }
and with a delafossite structure has been known as one of the p-type TCO materials for potential industrial applications. Several CuMO2 thin films have been reported with different
conductivities and transparencies [5–9].
The CuMO2 structure can be described as a stacking,
along the c-axis, of edge-shared MO6 octahedra forming
MO2layers. These MO2 layers are connected together with
triangular metallic planes of monovalent copper. Each Cu+
cation is linearly coordinated with two O2− anions of upper
and lower MO2layers as seen in figure1. The oxygen layers
can be stacked in different ways along the c-axis, leading to
two polytypes of the delafossite structure: the hexagonal 2H (space group P63/mmc) and the rhombohedral 3R (space group
R-3m) polytypes.
CuFeO2 delafossite is a well-known p-type
semi-conductor. At room temperature, the highest electrical conductivity (σRT = 2 S cm−1) [1,10] among the CuMO2
delafossite series is obtained with p-type CuFeO2delafossite
when an off-stoichiometric CuFeO2+δphase is formed. This
electrical conductivity can also be improved by magnesium doping up to 30 S cm−1 for CuFe
0.98Mg0.02O2 [10,11].
In the CuMO2 compounds, the transport properties are
mainly governed by the copper mixed valency CuI/CuII [12,13]. In CuFeO2+δ and CuFe1−xMgxO2, this CuI/CuII
ratio is, respectively, controlled by the oxygen non-stoichiometry value δ according to (Cu+1−2δCu2+2δ)FeO2+δ
[14], and the Fe-site doping stoichiometry x according to (Cu+1−xCu2+x )(Cr3+1−xMg2+x )O2. Moreover, CuFeO2 can be
deposited in thin film form by the radio-frequency sputtering method at low temperature on conventional glass [15], and then accordingly presents a real interest for industrial applications. CuCrO2 delafossite is also a p-type semiconductor but
with a lower intrinsic electrical conductivity (σRT = 3.5 ×
Figure 1.CuMO2delafossite structure.
(This figure is in colour only in the electronic version)
into the stoichiometric delafossite structure [16]. However, the electrical conductivity can also be improved up to 220 S cm−1
with appropriate M-site doping as in CuCr0.95Mg0.05O2 thin
film [8], by the same way as with CuFeO2.
As a result, CuFe1−xCrxO2: Mg solid solution is
particularly attractive due to the potential merge of the low temperature deposition process of the p-type CuFeO2
delafossite and the optimized p-type TCO properties of CuCrO2: Mg.
Previously, we studied the phase stability and thermal behaviour of the CuFe1−xCrxO2 (0 6 x 6 1) solid solution
by thermogravimetric analysis (TGA) and high-temperature XRD under an air atmosphere up to 1000◦
C in order to characterize the oxygen intercalation [16]. For 0 6 x < 1, two oxidations were observed. A slight oxidation appears between 400 and 500◦
C, leading oxygen intercalation in the Cu+layers.
An off-stoichiometric (Cu+
1−2δCu2+2δ)Fe1−xCrxO2+δdelafossite
phase is then formed. Above 500◦
C, a phase transition occurs; the delafossite phase is transformed into spinel and CuO phases. For x = 1, i.e. CuCrO2, the delafossite phase is
thermally stable in air up to 1000◦
C.
In this paper, the electrical properties of CuFe1−xCrxO2:
Mg (0 6 x 6 1) solid solutions were studied by dielectric spectroscopy in order to observe the effect of the substitution of Fe by Cr on the M-site on the electrical conduction mechanism.
2. Experimental section
Polycrystalline samples of CuFe1−xCrxO2(0 6 x 6 1) doped
with 3% of Mg were prepared by a conventional solid-state
Figure 2.Angular frequency dependence of the real part σ′
of the complex conductivity at room temperature (25◦C) for different x:
(¥) x = 0; (
◦
) x = 0.165; (N) x = 0.333; (✳) x = 0.5; (♦) x =0.667; (H) x = 0.835; (✰) x = 1. The solid lines represent the fit of experimental data using (1). The inset represents the x dependence of exponent n.reaction from stoichiometric mixtures of Cu2O, Fe2O3, Cr2O3
and MgO commercial powders. Mg content is fixed to 3% in order to avoid the precipitation of the secondary phases [17]. The obtained mixtures were heated in a nitrogen atmosphere between 900 and 1000◦
C for 30 h with intermittent grindings. Then, the powders were pressed into pellets and sintered at 1050◦
C in neutral atmosphere for 10 h.
Electrical conductivity measurements were performed by recording the complex impedance Z∗
(ω) and complex conductivity σ∗
(ω) using a Novocontrol broadband dielectric spectrometer. The measurements were done in the frequency range from 10−2 to 106Hz at room temperature and in the
temperature range from −100 to 150◦
C. The real part, σ′
(ω), of the complex conductivity was investigated. The ac output voltage was adjusted to 1.5 V. For all the samples considered in this study, the phase lag between the measured impedance and the applied ac voltage was negligible at low frequencies, so that the reported impedance at 0.01 Hz is equivalent to the dc resistance. The dc conductivity σdcof samples was determined
from the independent frequency part of σ′(ω)
(low frequency plateau).
The powder samples were enclosed in a Teflon sample holder between two circular stainless steel electrodes (10 mm in diameter). The sintered samples 1.6 mm thick were placed between two circular gold platted electrodes (10 mm in diameter). To reduce contact resistance with the cell electrodes, a thin layer of gold (100 nm) was sputtered onto both sides of the pellets using a BOC Edwards scancoat six SEM sputter coater.
3. Results and discussion
3.1. Dc and ac conductivity
Figure 2 shows the frequency dependence of the real part, σ′
(ω) of the complex electrical conductivity, for Mg-doped 2
Table 1.Dc conductivity σdc, characteristic onset frequency ωcand
exponent n, using (1), for different CuFe1−xCrxO2delafossite
powders at room temperature.
σdc(S cm−1) ωc(s−1) n CuFeO2: Mg 9.3 × 10⁻⁸ 2.3 × 10⁵ 0.92 CuFe0,835Cr0,165O2: Mg 7.2 × 10 −8 1.8 × 10⁵ 0.97 CuFe0,667Cr0,333O2: Mg 2.3 × 10⁻⁷ 3.5 × 10⁵ 0.89 CuFe0,5Cr0,5O2: Mg 5.6 × 10 −7 4.8 × 10⁵ 0.70 CuFe0,333Cr0,667O2: Mg 4.0 × 10⁻⁷ 2.8 × 10⁵ 0.66 CuFe0,165Cr0,835O2: Mg 5.1 × 10⁻⁷ 4.0 × 10⁵ 0.65 CuCrO2: Mg 1.4 × 10⁻⁶ 8.4 × 10⁵ 0.64
CuFe1−xCrxO2 powders at room temperature (25◦C). At
low frequencies, σ′
(ω) is independent of the electric field frequency. Above a characteristic onset angular frequency ωc, the ac conductivity increases with increasing angular
frequency and obeys a power law. Then, the angular frequency dependence of the total ac conductivity is well described by the following equation:
σ′ (ω) = σ (0) + Aωn=σ dc · 1 +µ ω ωc ¶n¸ , (1)
where σdc is the independent frequency conductivity or dc
conductivity, A = ω−n
c σdc is a pre-exponential factor and n
is an exponent dependent on both frequency and temperature in the range 0 < n 6 1. This behaviour is characteristics of the charge transport in disordered materials and interpreted by Jonscher [18] as universal dynamic response (UDR). However a value of n > 1 was reported in ion-conducting glasses [19], ionic crystals [20,21] and underlined by Papathanassiou
et al[22,23] in a new approach of the universal power law in disordered materials. The experimental σ′
(ω)conductivity for CuFe1−xCrxO2powders were fitted using (1). The best fits of
the conductivity spectra at room temperature for 0 6 x 6 1 are shown as solid lines in figure2. The dc conductivity σdc,
the crossover frequency ωcand the exponent n were obtained
by a non-linear fitting procedure and reported in table1. The variation of the dc conductivity with x is shown in figure3. As expected the conductivity increases weakly with x, only one decade in magnitude, because the progressive substitution of Fe3+by Cr3+reduces the distance Cu+–Cu+in CuFe
1−xCrxO2.
The inset in figure 3 shows the variation of the power law exponent n with x. The exponent n decreases from 0.92 for CuFeO2 (x = 0) to 0.65 for CuCrO2 (x = 1) and a sharp
decrease is observed above x = 0.5. This behaviour can be compared with the decrease in particles sizes of CuFe1−xCrxO2
solid solution with increasing x [16]. The substitution of Fe3+ by Cr3+ leaded to contraction of unit cell, and reduction in lattice parameter a. The lower value of n above x = 0.5 indicates that the dispersion of ac conductivity with frequency is reduced with the introduction of large amount of Cr at the Fe site. This behaviour may be correlated with the change in the distance and barrier height of the sites available for charge carriers for electrical conduction. The decrease in the lattice parameter a in the plane of the Cu atoms and the increased overlap between Cu+(3d10) with increasing x are responsible
for the observed n decrease through a reinforcement of the interaction between Cu+ions.
Figure 3. xdependence of: ( ) dc conductivity; (⋆) characteristic relaxation time τ∗
Zfrom impedance plot; (N) characteristic
relaxation time τ∗
Mfrom dielectric modulus plot; (
◦
) reciprocalcharacteristic onset frequency ω−1 c .
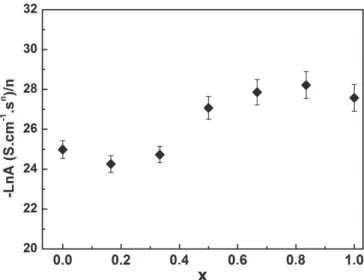
Figure 4.Composition dependence of the ratio (−LnA/n) in CuFe1−xCrxO2delafossite at room temperature.
The ac conductivity is dependent on the stoichiometric parameter x as the dc conductivity and does not obey a scaling with x, i.e. no scaling law is obtained for all the CuFe1−xCrxO2 delafossite when the reduced conductivity
σ′
(ω)/σdcis plotted against the reduced frequency ωr =axω where ax =[ω(x)/ω(x = 1)] is a shift factor depending on
x, i.e. all the conductivity curves at constant x do not fall onto one master curve. The shape of the frequency dependence of the ac conductivity is then dependent on x as dc conductivity and the onset frequency.
According to the revision of the universal power law dispersion of ac conductivity in disordered solids proposed by Papathanassiou [22], the ratio −Ln A/n is reported as a function of x in figure4. This ratio is near constant because the weak change in the dc conductivity value with the substitution of Fe3+by Cr3+. Such behaviour, i.e. −Ln A/n independent of composition, was observed in ion-conducting glasses [19]. The effect of Cr substitution on the conduction relaxation mechanism of CuFe1−xCrxO2 powder was also investigated
by the complex impedance Z∗
(ω) and complex dielectric modulus M∗
Figure 5.Angular frequency dependence of: the real part σ′
of the complex conductivity for: (
•
) x = 0; (⋆) x = 1 and the imaginary part Z′′s of the complex impedance for: (
◦
) x = 0; (✰) x = 1. Theinset shows the correlation between the characteristic onset frequency ωcand the dc conductivity for x = 0.335. The solid line
represents the least-squares linear fits to BNN relation (6).
temperature. Electrical modulus formalism was used in conductive materials to distinguish a frequency domain within the charge transport that is long range and above which is localized since it emphasizes bulk properties compared with the interfacial polarization. The frequency dependence of the imaginary part’ of Z∗
(ω), Z′′
(ω)is shown in figure5for CuFeO2(x = 0) to and CuCrO2(x = 1) and compared with the
σ′
(ω)behaviour. The relaxation conduction of charge carriers is represented by well-defined loss peaks in Z′′
(ω) and no such corresponding peak in the imaginary part of the complex dielectric permittivity ε′′
(ω) occurs. The maximum of the Z′′
spectrum, occurring in the high frequency range part of the experimental frequency range [10−2–106Hz], is associated
with the contribution of the bulk property of the material. Let τZbe the relaxation times obtained from the impedance plot.
The absence of a ε′′
loss peak together with the equivalence ω−1
c ≈τZ signify long range charge carriers diffusion. The
conduction relaxation mechanism in CuFe1−xCrxO2 powder
is also investigated by analysing electrical loss modulus M′′
as a function of frequency and temperature. The imaginary part of modulus spectra is reported in figure6for x = 0 to and x = 1 and compared with Z′′
spectra. The M′′
spectrum exhibits one main peak as the Z′′
spectrum. It is important to note that M′′
maxima are at higher frequency with respect to Z′′
maxima. Let τM be the relaxation times obtained from
the modulus plot. The relatively large width and asymmetrical nature of the Z′′
and M′′
peaks at room temperature indicate a non-Debye behaviour of the conduction relaxation process. In order to follow the effect of the substitution of Fe3+by Cr3+on relaxation times, Havriliak–Negami (HN) empirical equation was used to describe the frequency dependence of the shape of the Z′′ and M′′ peaks as follows: Z∗ s =Z ′ s−i Zs′′= Rs [1 + (iωτ∗ Z)α]β , (2) M∗ =M′+ iM′′=M∞− (M∞−M0) [1 + (iωτ∗ M)α]β , (3)
Figure 6.Angular frequency dependence of: the imaginary part Z′′ s
of the complex impedance for: (
◦
) x = 0; (✰) x = 1 and the imaginary part M′′of the complex dielectric modulus for: (
•
) x =0; (⋆) x = 1. Data points are connected to guide the eye.where τ∗ Zand τ
∗
Mare the HN characteristics relaxation time, and
αand β the parameters describing the distribution of relaxation time. The parameters describing the conduction relaxation for the different CuFe1−xCrxO2samples are listed in table2.
The variation of ω−1 c , τ
∗ Z and τ
∗
M with x at room temperature
is reported in figure 3. The three representations of the conduction relaxation show that the characteristics relaxation time decreases with increasing x. The magnitude of Z′′
is founded to decrease as x increases, because Rsdecreases. This
result is in good agreement with the shortening of the distance between Cu sites as x increases.
The frequency behaviour of the ac conductivity at different temperatures for x = 0.835 is reported in figure7. As expected for semiconductor behaviour, σdc increases with increasing
temperature. Figure8 displays the temperature dependence of the dc conductivity data in an Arrhenius plot for x = 0.835. The activation energy for the thermally activated conduction process is obtained by fitting the dc conductivity data with the Arrhenius relation: σdc=σ0exp µ −Eσ kBT ¶ , (4)
where σ0is the pre-exponential factor and Eσis the activation
energy for dc conductivity. As can be seen, only the data from −30◦
C to about 150◦
C can be well linearized in this representation with Eσ =0.43 eV and σ0 =1905 S cm−1.
In the UDR the onset frequency or the crossover frequency ωc from the dc regime at low frequencies to
the dispersive regime is also the hopping frequency ωh.
The frequency behaviour of ac conductivity as a power law was largely observed in many other low mobility oxides amorphous semiconductors and disordered systems and attributed to the hopping of charge carriers between sites having variable heights and separation distances. To correlate dc and ac conductivities, the temperature dependence of the hopping frequency ωh is compared with the corresponding
dc conductivity behaviour in figure 8. As expected the 4
Table 2.Number density of Cu sites NCu, Cu–Cu distance (a-axis lattice parameter), number density of effective charge carrier density Nc
using (8) and charge carrier mobility µ using (9) for different powders at room temperature.
NCu(m−3) a(Å) [16] Nc(m−3) µ(m−2V−1S−1) CuFeO2: Mg 2.19 × 1028 3.0344 2.64 × 1027 2.2 × 10⁻¹⁴ CuFe0,835Cr0,165O2: Mg 2.21 × 1028 3.0268 2.65 × 1027 1.7 × 10⁻¹⁴ CuFe0,667Cr0,333O2: Mg 2.22 × 1028 3.0159 4.38 × 1027 3.3 × 10⁻¹⁴ CuFe0,5Cr0,5O2: Mg 2.24 × 1028 3.0055 7.82 × 1027 4.5 × 10⁻¹⁴ CuFe0,333Cr0,667O2: Mg 2.26 × 1028 2.9942 9.65 × 1027 2.6 × 10⁻¹⁴ CuFe0,165Cr0,835O2: Mg 2.28 × 1028 2.9826 8.68 × 1027 3.7 × 10⁻¹⁴ CuCrO2: Mg 2.29 × 1028 2.9742 1.14 × 1028 7.7 × 10⁻¹⁴
Figure 7.Angular frequency dependence of the real part σ′of the
complex conductivity at different temperatures between −100 and 150◦C: (¥) −100◦C; (
◦
) −60◦C; (N) −20◦C; (▽) 40◦C; (¨)80◦C; (⊳) 120◦C; (✰) 150◦C for x = 0.835.
Figure 8.Dc conductivity σdc(¨) and characteristic onset frequency
ωc(
◦
) as a function of reciprocal temperature for x = 0.835. Solidslines represent the fit of experimental data using (4) and (5).
crossover frequency is also thermally activated and ωhobeys
an Arrhenius equation: ωc≡ωh=ωh0exp µ −Eh kBT ¶ (5) with an activation energy value Eh =0.36 eV close to the value of Eσ. The value of the corresponding characteristic hopping
attempt frequency ωh0=1013s−1is close to the lattice phonon
frequency such as the inverse pre-exponential factor 1/τ0Z,M.
It is well known that, in most conductive materials, σdc and
ωh satisfy the Barton–Nakajima–Namikawa (BNN) relation
[24–26], i.e.
σdc=pε01εωc, (6)
where p is a constant of order 1, 1ε is the dielectric strength and ε0is the permittivity of free space. σdcand ωhare thermally
activated with nearly the same activation energy. The inset in figure5shows the log σdcversus log ωhfor x = 0.5. The solid
line is the least-squares straight-line fit and gives a slope of 1.16 close to unity in good agreement with the BNN relation σdc ∼ ωh. It can be concluded that dc and ac conductions are correlated with each other in CuFe1−xCrxO2 delafossite
and that they are governed by the same transport mechanism, namely thermally activated nearest neighbour hopping.
At the lower temperature range, below −40◦C, the dc
conductivity is independent of the temperature. The thermally activated behaviour for conduction in the temperature range [−30, 150◦C] is confirmed by analysing the temperature
dependence of τ∗ Z and τ
∗
M. It is clear that the relaxation
times predicted by each empirical equation show an activated behaviour, i.e. obey the Arrhenius equation:
τ∗ z,M =τ0Z,Mexp µ EaZ,M kBT ¶ , (7)
where Eais the activation energy and τ0is the high-temperature
limit of the relaxation time. The best fit to (7) gives EaZ = 0.35 eV and EaM =0.39 eV which corresponds to the value of dc conduction activation energy Eσ. This result indicates
that charge carrier has to overcome the same energy barrier while conducting as well as relaxing. The mechanism of electrical conduction is the same as that of dielectric relaxation in CuFe1−xCrxO2powder. As expected from the observed dc
conductivity temperature behaviour, ωcand τZ∗are independent
of the temperature below −40◦C.
In hopping transport, we can use the relationship between the dc conductivity σdcand the hopping frequency ωh[27],
σdc=
µ Nce2rh2
12π kBT
ωh, (8)
where rh is the hopping distance (i.e. the Cu–Cu distance
a [16]) and Nc is the number density of effective charge
carrier. Using (8), Nccan be evaluated at room temperature
and compared with the number density of Cu sites in CuFe1−xCrxO2delafossite. As shown in table2, Ncincreases
Figure 9.Characteristic onset frequency ωc(
◦
) and characteristicrelaxation time τ∗
Z(⋆) as a function of reciprocal temperature for
x =0.835. Solids lines represent the fit of experimental data using (5) and (7).
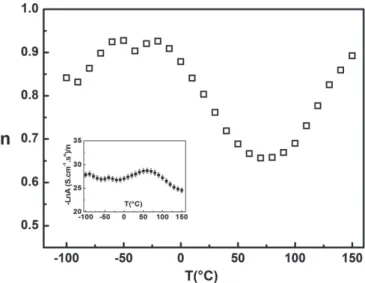
Figure 10.Variation of the exponent n with temperature for x =0.835. The inset shows the temperature dependence of the ratio (−Ln A/n).
with x and the value is close to NCu for CuCrO2 (x = 1)
as expected, if one takes into account that the charge carrier hopping probability is necessarily reduced to some extent in the real delafossite powder. From σdcand Nc, the charge carrier
mobility µ can be obtained using µ = σdc
eNc
(9) and is reported in table2.
To complete the temperature behaviour of ac conductivity, the temperature dependence of the frequency exponent n for x =0.835 is shown in figure9. The value of n calculated from (1) in figure10 decreases with increasing temperature from −30 to 50◦C and is increasing above 80◦C. The temperature dependence of n, at low temperature up to −10◦
C, is weak compared with the variation above 0◦
C. This behaviour suggests that relaxation processes and conduction mechanism at low temperature are linked to tunnelling of charge carriers.
This result is in agreement with the weak activation energy measured below −40◦
C using the temperature dependence of dc conductivity; impedance and loss modulus (see figures8
and9).
According to Dyre et al [28] presentation of a review on ac hopping conduction, the temperature dependence of the parameter n was explained on the basis of the many body interaction models. At low temperatures the interaction between the neighbouring charge carriers is almost negligible. As the temperature increases, the interaction increases, leading to a decrease in n. The universal power law dependence of ac conductivity on the frequency corresponds to the short range hopping of charge carriers between the sites separated by energy barriers of varied heights. If hopping takes place between a random distribution of localized charge states, it then lies between 0.5 and 1 as observed in CuFe1−xCrxO2
delafossite. The lower value of n occurs for multiple hops while the higher value occurs for single hops. Theoretical models have been proposed to correlate the conduction mechanism of ac conductivity with n(T ) behaviour. If n increases with temperature, a small polaron is the predominant mechanism, while the correlated barrier hopping (CBH) is characterized by a decrease in n with temperature [29]. Benko
et al[2] assumed the conduction mechanism by hopping of small polarons localized on the Cu sites in Mg-doped CuFeO2.
Substituting Mg2+for Fe3+by Mg doping results in the mixed valence Cu+/Cu2+and contributes a hole. The calculated carrier
mobility is very low and insufficient to measure the Seebeck coefficient in sample powders and to display some precise information about the nature of the involved charge carrier in the conduction of the CuFe1−xCrxO2delafossite.
According to Papathanassiou [22] the ratio (Ln A/n), in disordered solids, is independent of the temperature. The ratio −Ln A/n is reported as a function of temperature in the inset of figure 4. The variation of (−Ln A/n) in delafossite (x = 0.835) is less than 2 orders of magnitude in the investigated temperature range. This behaviour is in agreement with those observed in other experimental data from ionic conducting glasses or disordered semiconductors and compiled by Papathanassiou [22].
From the literature, the conduction mechanism in CuCrO2
[8,30,31] or CuFeO2 delafossites at low temperature (T <
25◦
C) is a hopping of holes between the nearest neighbour Cu sites in Cu layers and a crossover from thermal activation behaviour to that of 3D VRH occurs at a very low temperature. As shown in figures8and9, a such VRH behaviour of σdcin
T0.25is not observed because σdc,τZ∗ and ωcare independent
of the temperature below −40◦
C. Hence the charge carrier transport occurs via tunnelling from Cu atom to another at low temperature.
4. Conclusion
The electrical conductivity and dielectric behaviour of Mg-doped CuFe1−xCrxO2 delafossite powders have been
studied by dielectric spectrometry. At room temperature, the conductivity behaviour is frequency and composition-dependent and obeys a power law, above the onset frequency 6
ωc. In CuFe1−xCrxO2delafossite no scaling of ac conductivity
has been observed at room temperature at different x. The Cu+–Cu+distance has a great influence on electrical properties of CuFe1−xCrxO2 delafossite. The dc conductivity σdc
increases with increasing x and decreasing Cu–Cu distance. The behaviour of the exponent n in the power law shows also a decrease when x increases from 0 to 1. The dc and ac conductivities are driven by the same mechanism, as the BNN relation is found to be valid. The same temperature behaviour is observed for the dc conductivity and the onset frequency: the activation energy is the same for both ac and dc conduction, confirming the BNN relation. The dielectric behaviour of CuFe1−xCrxO2 delafossite powders
has been analysed in the framework of complex impedance and complex dielectric modulus. The characteristic relaxation times τ∗
Z and τ ∗
M extracted from impedance and modulus
losses Z′′(ω)
and M′′
(ω), using a HN empirical equation, are decreasing monotonic functions of x in agreement with the x dependence of dc conductivity. The observed dielectric behaviour is characteristic of a conduction relaxation of charge carriers. Above −40◦
C, the characteristic relaxation time τ∗
Z is thermally activated and the activation energy is close
to the value obtained from dc conductivity for x = 0.835. The relaxation conduction and dc conduction are governed by charge carriers hopping from the Cu site to another. At low temperature, the charge transport occurs via tunnelling.
In delafossite, the ratio Ln A/n extracted from the power law dispersion of the ac conductivity was found to be poorly dependent on composition and temperature.
References
[1] Rogers D B, Shannon R D, Prewitt C T and Gillson J L 1971
Inorg. Chem.10723
[2] Benko F A and Koffyberg F P 1984 J. Phys. Chem. Solids
4557
[3] Doumerc J P, Wichainchai A, Ammar A, Pouchard M and Hagenmuller P 1986 Mater. Res. Bull.21745
[4] Kawazoe H, Yasukawa M, Hyodo H, Kurita M, Yanagi H and Hosono H 1997 Nature389939
[5] Gong H, Wang Y and Luo Y 2000 Appl. Phys. Lett.763959 [6] Yanagi H, Inoue S I, Ueda K and Kawazoe H 2000 J. Appl.
Phys.884159
[7] Jayaraj M K, Draeseke A D, Tate J and Sleight A W 2001 Thin
Solid Films397244
[8] Nagarajan R, Draeseke A D, Sleight A W and Tate J 2001 J.
Appl. Phys.898022
[9] Nagarajan R, Duan N, Jayaraj M K, Li J, Vanaja K A, Yokochi A, Draeseke A, Tate J and Sleight A W 2001 Int. J.
Inorg. Mater.3265
[10] Benko F A and Koffyberg F P 1987 J. Phys. Chem. Solids
48431
[11] Nozaki T, Hayashi K and Kajitani T 2008 Proc. ICT 2007
26th Int. Conf. on Thermoelectrics (Jeju Island, Korea, June 2007)p 168
[12] Thomas G 1997 Nature389907
[13] Ingram B J, Mason T O, Asahi R, Park K T and Freeman A J 2001 Phys. Rev. B64155114
[14] Mugnier E, Barnab´e A and Tailhades Ph 2006 Solid State Ion.
177607
[15] Barnab´e A, Mugnier E, Presmanes L and Tailhades Ph 2006
Mater. Lett.603468
[16] Lalanne M, Barnab´e A, Mathieu F and Tailhades Ph 2009
Inorg. Chem.486065
[17] Sadik P W, Ivill M, Craciun V and Norton D P 2009 Thin Solid
Films5173211
[18] Jonscher A K 1977 Nature267673
[19] Cramer C, Brunklaus S, Ratai E and Gao Y 2003 Phys. Rev.
Lett.9126601
[20] Chen R H, Yang R Y and Shern S C 2002 J. Phys. Chem.
Solids632069
[21] Louati B, Gargouri M, Guidara K and Mhiri T 2005 J. Phys.
Chem. Solids 6762
[22] Papathanassiou A N 2005 Mater. Lett.591634 Papathanassiou A N 2006 J Non-Cryst Solids3525444 [23] Papathanassiou A N, Sakellis I and Grammatikakis J 2007
Appl. Phys. Lett.91122911 [24] Barton J L 1966 Verres Refract. 20 328
[25] Nakajima T 1972 Ann. Rep. Conf. on Electrical Insulation and
Dielectric Phenomena(Washington DC: National Academy of Sciences) p 168
[26] Namikawa H 1975 J. Non-Cryst. Solids18173 [27] Mott N F and Davis E A 1979 Electronic Processes in
Non-crystalline Materials(Oxford: Clarendon) [28] Dyre J C and Schroder T B 2000 Rev. Mod. Phys.72873 [29] Elliot S R 1977 Phil. Mag.361291
Elliot S R 1987 Adv. Phys.36135
[30] Okuda T, Jufuku N, Hidaka S and Terada N 2005 Phys. Rev. B
72144403
[31] Li D, Fang X, Deng Z, Zhou S, Tao R, Dong W, Wang T, Zhao Y, Meng G and Zhu X 2007 J. Phys. D: Appl. Phys.