1373 Semina: Ciências Agrárias, Londrina, v. 41, n. 4, p. 1373-1384, jul./ago. 2020
DOI: 10.5433/1679-0359.2020v41n4p1373
Received: Aug. 28, 2019 - Approved: Nov. 04, 2019
New model of evaluation of sunflower and corn silages by the in vitro
gas production technique
Novo modelo para avaliação das silagens de girassol e milho pela
técnica in vitro de produção de gás
André Luiz Pinto dos Santos
1; Cícero Carlos Ramos de Brito
2; Guilherme Rocha
Moreira
2; Frank Gomes-Silva
2*; Moacyr Cunha Filho
2; Maria Lindomárcia
Leonardo da Costa
3; Leonardo Andrade Leite
4; Ronaldo Braga Reis
5; Patrícia
Guimarães Pimentel
6; Mércia Regina Pereira de Figueiredo
7Highlights:
New models that can bring more significant results and generate more accurate estimates.
Possibility that a new model can perform better in terms of biological interpretations and convergence of parameters. New model that stood out, with better results compared to models commonly used in the literature for gas production curves.
Abstract
This study aimed to propose a model called Two-compartment Logistic-von Bertalanffy (LVB) and to identify among the proposed and Two-compartment Logistic (TL) models the one that has the best goodness of fit to the kinetic curve of cumulative gas production (CGP) of sunflower and corn silages alone and combined using the in vitro semi-automated gas production technique. A random block split-plot experimental design was employed in which the inoculums were the blocks, the incubation times were the split-plots, and the experimental diets were: CS - corn silage, SS - sunflower silage (as single roughage), and their mixtures, i.e., 340SS (660 g kg-1 corn silage and 340 g kg-1 sunflower silage) and
660SS (340 g kg-1 corn silage and 660 g kg-1 sunflower silage). The parameters were estimated by
the least squares method using the iterative Gauss-Newton process in the software R version 3.4.1. The criteria adopted were: adjusted coefficient of determination (R2
adj.), residual mean squares (RMS),
mean absolute deviation (MAD), Akaike information criterion (AIC), Bayesian information criterion (BIC), and relative efficiency (RE). The TL model had higher R2
adj. values compared to LVB, however,
such difference may be considered negligible. The LVB model had RE above one, which indicates it is superior to the TL model, in addition to the lowest RMS, MAD, AIC, and BIC values, The Two-1 Pesquisador, Graduado no Programa de Biometria e Estatística Aplicada, Universidade Federal Rural de Pernambuco, UFRPE,
Recife, PE, Brasil. E-mail: andredefensor@hotmail.com
2 Profs., Programa de Biometria e Estatística Aplicada, UFRPE, Recife, PE, Brasil. E-mail: cicerocarlosbrito@yahoo.com.br; guirocham@gmail.com; franksinatrags@gmail.com; moacyr.cunhafo@ufrpe.br
3 Profa, Departamento de Zootecnia, Universidade Federal da Paraíba, UFPB, Areia, PB, Brasil. E-mail: lindomarciacosta@gmail. com
4 Consultor, Serviço Brasileiro de Apoio às Micro e Pequenas Empresas, SEBRAE, Belo Horizonte, MG, Brasil. E-mail: leoleite. vet@gmail.com
5 Prof., Departamento de Zootecnia, Universidade Federal de Minas Gerais, UFMG, Belo Horizonte, MG, Brasil. E-mail: rbr. ufmg@gmail.com
6 Profa, Departamento de Zootecnia, Universidade Federal do Ceará, UFC, Ceará, CE, Brasil. E-mail: pgpimentel@hotmail.com 7 Pesquisadora, Instituto Capixaba de Pesquisa, Assistência Técnica e Extensão Rural, INCAPER, Linhares, ES, Brasil. E-mail:
merreg5@gmail.com * Author for correspondence
1374
Semina: Ciências Agrárias, Londrina, v. 41, n. 4, p. 1373-1384, jul./ago. 2020
compartment Logistic-von Bertalanffy model had the best fit to describe the CGP over time according to the methodology and conditions of the present study.
Key words: Alternative feed. Forage. Proposed model. Rumen.
Resumo
O objetivo deste trabalho é propor um modelo denominado Logístico-Von Bertalanffy bicompartimental (LVB) e identificar entre os modelos proposto e Logístico bicompartimental (LB), aquele apresenta maior qualidade de ajuste à curva de cinética de produção cumulativa de gases (PCG) das silagens de girassol, de milho e de suas misturas, através da técnica “in vitro” semiautomática de produção de gases. O delineamento experimental foi em blocos ao acaso, onde os inóculos equivalem aos blocos, os tempos de incubação às subparcelas, e as dietas experimentais foram: SM - silagem de milho; 340SG - 660 g kg-1
de silagem de milho e 340 g kg-1 de silagem de girassol; 660SG - 340 g kg-1 de silagem de milho e 660
g kg-1 de silagem de girassol e SG - silagem de girassol. Os parâmetros foram estimados pelo método
de mínimos quadrados utilizando o processo iterativo de Gauss-Newton, a partir do programa R versão 3.4.1. Os critérios adotados foram: o coeficiente de determinação ajustado (R2
adj.), quadrado médio
do resíduo (QMR), desvio médio absoluto (DMA), critério de informação de Akaike (AIC), critério Bayesiano de Schwarz (BIC) e a eficiência relativa (ER). O modelo LB apresentou os maiores valores de R2
adj. comparado ao LVB, porém, essa diferença entre eles pode ser considerada desprezível. O modelo
LVB apresentou RE maior que um, indicando superioridade em relação ao LB, além disso, obteve os menores valores de QMR, DMA, AIC e BIC. Dentre os modelos ajustados, o modelo Logístico-Von Bertalanffy bicompartimental apresentou melhor qualidade de ajuste para descrever a PCG ao longo do tempo, de acordo com a metodologia e condições em que foi desenvolvido o presente estudo.
Palavras-chave: Alimentos alternativos. Modelo proposto. Forragem. Rúmen. Vacas leiteiras.
Introduction
Sunflower is a crop with high tolerance against water deficit and high temperatures and has been standing out in Brazil thanks to genetic enhancements and the increased demand for oilseeds for biodiesel production. Its use as silage represents an alternative for periods of water deficit, which prevent the production of quality roughage and the maintenance of animal production throughout the year (Costa, Silva, Galati, Silva, & Duarte Júnior, 2015; Pereira et al., 2016).
Several studies have been carried out to asses the agronomical characteristics, fermentation patterns, bromatological composition, and nutritional value of sunflower silage (Aragadvay-Yungán et al., 2015; Leite et al., 2006, 2017; A. D. S. Martins et al., 2014; Viana et al., 2012; Wanderley et al., 2012). However, few studies have been made on the rumen degradation kinetics of sunflower silage as
the single roughage in the diet or in association (Pereira et al., 2016).
The literature features several studies using the Two-compartment Logistic (TL) model developed by Schofield, Pitt and Pell (1994) (Pires et al., 2017) based on the assumption that the in vitro gas production rate is impacted by microbial mass and substrate level. However, this model may not be adequate for some cases due to its fixed inflection point halfway through cumulative gas production (France, Dijkstra, Dhanoa, Lopez, & Bannink, 2000).
That requires new mathematical models that allow fitting broad curve shape ranges with variable inflection points (Wang, Tang, & Tan, 2011). In addition, Santos et al. (2018) understood that, given the dynamics with which non-linear models have been applied in biological researches, such models are justifiable.
1375 Semina: Ciências Agrárias, Londrina, v. 41, n. 4, p. 1373-1384, jul./ago. 2020
New model of evaluation of sunflower and corn silages by the in vitro gas production technique The idea of combining non-linear growth
models has received considerable attention in the literature, particularly when growth shows a characteristic behavior that identifies the steps, which allows dividing the curve into several stages. Adopting multi-compartment models is needed as they take exclusive parameters into account for each compartment (Koops, 1986). Hence, this research combined the Logistic and von Bertalanffy models as they are basic models frequently used to fit growth curves.
In this way, mathematical models with equations that satisfactorily describe cumulative gas production (CGP) are indispensable to interpret the nutritional value of ruminant feed. This study aimed to propose a new Two-compartment model by combining the Logistic and von Bertalanffy models for corn and sunflower silages and their associations.
Materials and Methods
Planting, harvest, and ensilageCorn (cultivar AG 1051) sowing and ensilage were carried out between October and February, whereas sunflower (genotype M734, a simple hybrid targeted at oil production, with intermediate cycle and medium size) sowing and silaging were carried out between February and May. The sowing density used for corn was, approximately, 55,000 plants ha-1, with spacing of 0.90 m between rows and
0.20 m between plants for corn and, for sunflower, approximately 45,000 plants ha-1, with spacing of
0.90 m between rows and 0.25 m between plants. A random block split-plot experimental design was employed in which the inoculums were the blocks, the experimental diets (CS, SS, 340SS, and 660SS) correspond to the treatments, and the incubation times, in hours, were the split-plots.
The sunflower silage for this assay targeted stage R9, in which there is approximately 100% grain filling, and was carried out 110 to 115 days after planting. The forages were ensiled using a conventional ensiling machine coupled to a tractor. The silages were stored in surface silos and a tractor was used to compact the material deposited. The silos were opened 90 days after silaging so that samples were taken and pre-dried in an oven at 55 °C for 72 h and then ground in a mill with 1 mm sieves.
Ruminal inoculum
Four multiparous lactating Dutch cows with rumen fistulas, weighing approximately 550 kg and producing, on average, 25 kg of milk per day between 60 and 82 days of lactation, were used as donors of rumen fluid to prepare the inoculum (Maurício, Mould, & Dhanoa, 1999). The animals were kept in tie-stalls containing individual feeding and drinking troughs and were fed twice a day (7:00 a.m. and 5 p.m.).
Experimental diets
Four experimental diets were formulated that met the requirements of the animals according to the National Research Council [NRC] (2001). The roughage: concentrate ratio was fixed at 56:44 on dry matter (DM) basis. The diets were balanced to be isoproteic, with increasing sunflower silage proportions in replacement of corn silage as roughage: Treatment 1 - corn silage as single roughage added with concentrate (CS); Treatment 2 - 660 g kg-1 corn silage and 340 g kg-1 sunflower
silage (340SS); Treatment 3 - 340 g kg-1 corn
silage and 660 g kg-1 sunflower silage (660SS); and
Treatment 4 - sunflower silage as single roughage added with concentrate (SS) (Tables 1 and 2).
1376
Semina: Ciências Agrárias, Londrina, v. 41, n. 4, p. 1373-1384, jul./ago. 2020
Table 1
Chemical composition and fermentation parameters of corn and sunflower silages
Items (g kg1 DM) Corn silage Sunflower silage
DM (g kg-1 NM) 300.0 272.0 CP 69.0 88.0 NDF 569.0 493.0 ADF 332.0 373.0 EE 38.0 126.0 Ca 1.8 12.2 P 1.6 10.0 pH 3.97 4.56 N-NH3 (% of total N) 6.05 16.86
DM: dry matter; NM: natural matter; CP: crude protein; NDF: neutral detergent fiber; ADF: acid detergent fiber; EE: ether extract; Ca: calcium; P: phosphorus; N-NH3: ammoniacal nitrogen; N: nitrogen.
Table 2
Chemical composition of the experimental diets on dry matter basis
Items (g kg1 DM) CS 340SS 660SS SS DM 369.0 372.0 365.0 367.0 CP 161.0 161.0 168.0 165.0 NDF 477.0 456.0 441.0 428.0 ADF 265.0 278.0 275.0 299.0 NFC 287.0 272.0 267.0 253.0 EE 27.0 44.0 59.0 74.0 Ca 6.0 6.3 6.3 6.2 P 4.4 4.4 4.5 4.6
DM: dry matter; CP: crude protein: NDF: neutral detergent fiber; ADF: acid detergent fiber; NFC: non-fiber carbohydrates; EE: ether extract; Ca: calcium; P: phosphorus; CS: 1,000 g kg-1 corn silage; 340SS: 340 g kg-1 sunflower silage and 660 g kg-1 corn silage; 660SS: 660 g kg-1 sunflower silage and 340 g kg-1 corn silage; SS:1,000 g kg-1 sunflower silage at NFC% = 100% - [CP% + (NDF% - NDCP%) + EE + ash%], according to Sniffen O’Connor, Van Soest, Fox and Russel (1992) (NDCP: neutral detergent insoluble crude protein).
Incubation
Incubation was carried out in 160 mL glass flasks saturated with carbon dioxide (CO2) and added with 1 g of treatment. Two flasks were used per treatment, i.e., two for each cow in each of the four treatments (CS, 660SS, 340SS, and SS) and two more blank flasks (containing only the culture medium and the inoculum) per inoculum.
Substrates, in vitro gas production
The culture medium, comprising a blend of buffer solution, macrominerals, resazurin, and reducing agents, were prepared according to the recommendations by Theodorou, Williams, Dhanoa, Mcallan and France (1994). The medium was constantly stirred and saturated with CO2 for 2 h until a rosy color was reached, then 90 mL were added to the fermentation flasks using a test tube.
1377 Semina: Ciências Agrárias, Londrina, v. 41, n. 4, p. 1373-1384, jul./ago. 2020
New model of evaluation of sunflower and corn silages by the in vitro gas production technique The flasks were sealed with 14 mm silicon stoppers
and, so as to prevent any fermentation from taking place, were kept at 4 °C during the night. 5 h prior to inoculation, the flasks with the samples and the culture medium were taken from the refrigerator to the oven at 39 °C, where they remained until inoculation. Inoculation was performed using the rumen fluid from each animal in each treatment.
The rumen fluid was manually removed through the fistulas and stored in previously warmed thermal bottles. The fluid was then filtered through two layers of cotton fabric under CO2 injection and kept in a water bath at 39 °C. Inoculation was performed by injecting 10 mL of the inoculum in each flask using a sterile graduated plastic syringe. Immediately after inoculation, the internal pressure of the flasks was stabilized by inserting needles (25 x 7) into their stoppers. The needles were later removed and the flasks were manually stirred and placed in the oven at 39 °C, when fermentation time began.
The pressure caused by the gases was measured using a pressure transducer (T443A, Bailey and Mackey, England) connected to the end of a needle (25 x 7) inserted into the stoppers. Pressure readings were taken at 2, 3, 4, 6, 8, 9, 10, 12, 15, 19, 24, 30, 36, 48, 72, and 96 h. Pressure was read using a digital reader and written down in spreadsheets for later gas volume calculations as proposed by Maurício et al. (2003).
Proposed model
A Two-compartment Logistic (TL) model was developed by Schofield et al. (1994) for kinetic studies of in vitro gas production based on the assumption that production rate is impacted by microbial mass and substrate level.
The proposed model developed was the result of combining the one-compartment Logistic (Schofield et al., 1994) and von Bertalanffy (Bertalanffy, 1957) models, whose formulas are, respectively:
(1)
(2)
Let W(t) be an estimate of growth of the accumulated gas volume, then:
Thus, Equation (3) is our proposed model, called Two-compartment Logistic-von Bertalanffy model, or LVB, as it is a combination of Equations (1) and (2). In this model, W(t) is the accumulated volume (mL) at time t; α1 is the gas volume produced from the rapid-digestion fraction of non-fiber carbohydrates (NFC); α2 is the gas volume produced from the slow-digestion fraction of fiber carbohydrates (FC); β is a shape parameter with no biological interpretation; k1 is the degradation rate of the rapid-digestion fraction (NFC); k2 is the degradation rate of the slow-digestion fraction (FC); λ is the time of bacterial colonization; t is the fermentation time; e is exponential; and ε is the random error associated with each observation with normal distribution, zero means, and constant variance. Thus, the cumulative gas production kinetics was fitted using models LVB and TL.
The kinetic parameters of non-linear models LVB and TL were estimated via the least-squares method using the iterative Gauss Newton process through the Nonlinear Least Squares function of the software R version 3.4.1 (R Development Core Team [R], 2017).
Criteria for model selection
The most adequate model was selected based on, besides the biological interpretation of parameters, the goodness of fit following the following criteria: adjusted coefficient of determination (R2
adj.) residual
mean squares (RMS), mean absolute deviation (MAD), Akaike information criterion (AIC), and
The rumen fluid was manually removed through the fistulas and stored in previously warmed thermal bottles. The fluid was then filtered through two layers of cotton fabric under CO2 injection and kept
in a water bath at 39 °C. Inoculation was performed by injecting 10 mL of the inoculum in each flask using a sterile graduated plastic syringe. Immediately after inoculation, the internal pressure of the flasks was stabilized by inserting needles (25 x 7) into their stoppers. The needles were later removed and the flasks were manually stirred and placed in the oven at 39 °C, when fermentation time began.
The pressure caused by the gases was measured using a pressure transducer (T443A, Bailey and Mackey, England) connected to the end of a needle (25 x 7) inserted into the stoppers. Pressure readings were taken at 2, 3, 4, 6, 8, 9, 10, 12, 15, 19, 24, 30, 36, 48, 72, and 96 h. Pressure was read using a digital reader and written down in spreadsheets for later gas volume calculations as proposed by Maurício et al. (2003).
Proposed model
A Two-compartment Logistic (TL) model was developed by Schofield et al. (1994) for kinetic studies of in vitro gas production based on the assumption that production rate is impacted by microbial mass and substrate level.
The proposed model developed was the result of combining the one-compartment Logistic (Schofield et al., 1994) and von Bertalanffy (Bertalanffy, 1957) models, whose formulas are, respectively:
( ) { [ ( )]} (1) ( ) { ( )} (2) Let W(t) be an estimate of growth of the accumulated gas volume, then:
( ) ( ) ( ) { [ ( )]} { ( )} (3) Thus, Equation (3) is our proposed model, called Two-compartment Logistic-von Bertalanffy model, or LVB, as it is a combination of Equations (1) and (2). In this model, W(t) is the accumulated volume (mL) at time t; α1 is the gas volume produced from the rapid-digestion fraction of non-fiber
carbohydrates (NFC); α2 is the gas volume produced from the slow-digestion fraction of fiber carbohydrates
(FC); β is a shape parameter with no biological interpretation; k1 is the degradation rate of the rapid-digestion
fraction (NFC); k2 is the degradation rate of the slow-digestion fraction (FC); λ is the time of bacterial
colonization; t is the fermentation time; e is exponential; and ε is the random error associated with each observation with normal distribution, zero means, and constant variance. Thus, the cumulative gas production kinetics was fitted using models LVB and TL.
The kinetic parameters of non-linear models LVB and TL were estimated via the least-squares The rumen fluid was manually removed through the fistulas and stored in previously warmed thermal bottles. The fluid was then filtered through two layers of cotton fabric under CO2 injection and kept
in a water bath at 39 °C. Inoculation was performed by injecting 10 mL of the inoculum in each flask using a sterile graduated plastic syringe. Immediately after inoculation, the internal pressure of the flasks was stabilized by inserting needles (25 x 7) into their stoppers. The needles were later removed and the flasks were manually stirred and placed in the oven at 39 °C, when fermentation time began.
The pressure caused by the gases was measured using a pressure transducer (T443A, Bailey and Mackey, England) connected to the end of a needle (25 x 7) inserted into the stoppers. Pressure readings were taken at 2, 3, 4, 6, 8, 9, 10, 12, 15, 19, 24, 30, 36, 48, 72, and 96 h. Pressure was read using a digital reader and written down in spreadsheets for later gas volume calculations as proposed by Maurício et al. (2003).
Proposed model
A Two-compartment Logistic (TL) model was developed by Schofield et al. (1994) for kinetic studies of in vitro gas production based on the assumption that production rate is impacted by microbial mass and substrate level.
The proposed model developed was the result of combining the one-compartment Logistic (Schofield et al., 1994) and von Bertalanffy (Bertalanffy, 1957) models, whose formulas are, respectively:
( ) { [ ( )]} (1) ( ) { ( )} (2) Let W(t) be an estimate of growth of the accumulated gas volume, then:
( ) ( ) ( ) { [ ( )]} { ( )} (3) Thus, Equation (3) is our proposed model, called Two-compartment Logistic-von Bertalanffy model, or LVB, as it is a combination of Equations (1) and (2). In this model, W(t) is the accumulated volume (mL) at time t; α1 is the gas volume produced from the rapid-digestion fraction of non-fiber
carbohydrates (NFC); α2 is the gas volume produced from the slow-digestion fraction of fiber carbohydrates
(FC); β is a shape parameter with no biological interpretation; k1 is the degradation rate of the rapid-digestion
fraction (NFC); k2 is the degradation rate of the slow-digestion fraction (FC); λ is the time of bacterial
colonization; t is the fermentation time; e is exponential; and ε is the random error associated with each observation with normal distribution, zero means, and constant variance. Thus, the cumulative gas production kinetics was fitted using models LVB and TL.
The kinetic parameters of non-linear models LVB and TL were estimated via the least-squares
The rumen fluid was manually removed through the fistulas and stored in previously warmed thermal bottles. The fluid was then filtered through two layers of cotton fabric under CO2 injection and kept
in a water bath at 39 °C. Inoculation was performed by injecting 10 mL of the inoculum in each flask using a sterile graduated plastic syringe. Immediately after inoculation, the internal pressure of the flasks was stabilized by inserting needles (25 x 7) into their stoppers. The needles were later removed and the flasks were manually stirred and placed in the oven at 39 °C, when fermentation time began.
The pressure caused by the gases was measured using a pressure transducer (T443A, Bailey and Mackey, England) connected to the end of a needle (25 x 7) inserted into the stoppers. Pressure readings were taken at 2, 3, 4, 6, 8, 9, 10, 12, 15, 19, 24, 30, 36, 48, 72, and 96 h. Pressure was read using a digital reader and written down in spreadsheets for later gas volume calculations as proposed by Maurício et al. (2003).
Proposed model
A Two-compartment Logistic (TL) model was developed by Schofield et al. (1994) for kinetic studies of in vitro gas production based on the assumption that production rate is impacted by microbial mass and substrate level.
The proposed model developed was the result of combining the one-compartment Logistic (Schofield et al., 1994) and von Bertalanffy (Bertalanffy, 1957) models, whose formulas are, respectively:
( ) { [ ( )]} (1) ( ) { ( )} (2) Let W(t) be an estimate of growth of the accumulated gas volume, then:
( ) ( ) ( ) { [ ( )]} { ( )} (3) Thus, Equation (3) is our proposed model, called Two-compartment Logistic-von Bertalanffy model, or LVB, as it is a combination of Equations (1) and (2). In this model, W(t) is the accumulated volume (mL) at time t; α1 is the gas volume produced from the rapid-digestion fraction of non-fiber
carbohydrates (NFC); α2 is the gas volume produced from the slow-digestion fraction of fiber carbohydrates
(FC); β is a shape parameter with no biological interpretation; k1 is the degradation rate of the rapid-digestion
fraction (NFC); k2 is the degradation rate of the slow-digestion fraction (FC); λ is the time of bacterial
colonization; t is the fermentation time; e is exponential; and ε is the random error associated with each observation with normal distribution, zero means, and constant variance. Thus, the cumulative gas production kinetics was fitted using models LVB and TL.
The kinetic parameters of non-linear models LVB and TL were estimated via the least-squares The rumen fluid was manually removed through the fistulas and stored in previously warmed
thermal bottles. The fluid was then filtered through two layers of cotton fabric under CO2 injection and kept
in a water bath at 39 °C. Inoculation was performed by injecting 10 mL of the inoculum in each flask using a sterile graduated plastic syringe. Immediately after inoculation, the internal pressure of the flasks was stabilized by inserting needles (25 x 7) into their stoppers. The needles were later removed and the flasks were manually stirred and placed in the oven at 39 °C, when fermentation time began.
The pressure caused by the gases was measured using a pressure transducer (T443A, Bailey and Mackey, England) connected to the end of a needle (25 x 7) inserted into the stoppers. Pressure readings were taken at 2, 3, 4, 6, 8, 9, 10, 12, 15, 19, 24, 30, 36, 48, 72, and 96 h. Pressure was read using a digital reader and written down in spreadsheets for later gas volume calculations as proposed by Maurício et al. (2003).
Proposed model
A Two-compartment Logistic (TL) model was developed by Schofield et al. (1994) for kinetic studies of in vitro gas production based on the assumption that production rate is impacted by microbial mass and substrate level.
The proposed model developed was the result of combining the one-compartment Logistic (Schofield et al., 1994) and von Bertalanffy (Bertalanffy, 1957) models, whose formulas are, respectively:
( ) { [ ( )]} (1) ( ) { ( )} (2) Let W(t) be an estimate of growth of the accumulated gas volume, then:
( ) ( ) ( ) { [ ( )]} { ( )} (3) Thus, Equation (3) is our proposed model, called Two-compartment Logistic-von Bertalanffy model, or LVB, as it is a combination of Equations (1) and (2). In this model, W(t) is the accumulated volume (mL) at time t; α1 is the gas volume produced from the rapid-digestion fraction of non-fiber
carbohydrates (NFC); α2 is the gas volume produced from the slow-digestion fraction of fiber carbohydrates
(FC); β is a shape parameter with no biological interpretation; k1 is the degradation rate of the rapid-digestion
fraction (NFC); k2 is the degradation rate of the slow-digestion fraction (FC); λ is the time of bacterial
colonization; t is the fermentation time; e is exponential; and ε is the random error associated with each observation with normal distribution, zero means, and constant variance. Thus, the cumulative gas production kinetics was fitted using models LVB and TL.
The kinetic parameters of non-linear models LVB and TL were estimated via the least-squares
1378
Semina: Ciências Agrárias, Londrina, v. 41, n. 4, p. 1373-1384, jul./ago. 2020 Bayesian information criterion (BIC) as described
by Santos et al. (2018), and relative efficiency (RE) according to Mello, Magalhães, Breda and Regazzi (2008).
Residual analysis
In addition to verifying the goodness of fit, it is important to analyze the residuals to verify the fulfillment of the model assumptions, normally neglected in most growth curve studies. Graphical methods can be used to verify the model assumptions or traditional tests, such as Shapiro-Wilk, may be employed to verify the residual normality assumption, where the null hypothesis is that there is normality; Durbin Watson, to verify independence; and the statistical Breusch-Pagan test, used to verify heteroscedasticity of the errors, where the null hypothesis is that the residuals are homoscedastic. If such considerations are ignored
in the fitting process, biased estimates may be obtained (Pasternak & Shalev, 1994) and parameter variance may be underestimated (Souza, 1998).
Results and Discussion
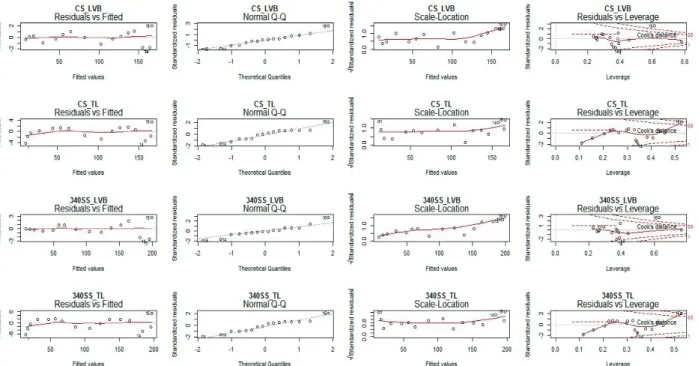
According to the results of the residual analysis for the LVB and TL models fitted to the data (Figures 1 and 2), the first column (residuals versus fitted values) shows that observation 16 (the last pressure reading taken over time for all treatments) has the largest residuals, whereas the other points are random. In the second column, the data have an approximately normal distribution and observation 16 is out of normality. The figure of the third column gives an idea of how diverging, or not, the data are. In the last column (residual versus leverage), observation 16 appears as a point of influence and leverage.
Figure 1. Analysis of residuals for the LVB and TL models for materials CS and 340SS.
Figure 1. Analysis of residuals for the LVB and TL models for materials CS and 340SS.
Nonetheless, it was chosen to preserve observation 16 in the analysis since data analysis after its removal showed no significant change in parameter estimates and, consequently, no change in the fits obtained.
All situations studied (Table 3) for model LVB show that the estimated residuals had normal distribution and are independent and homoscedastic, i.e., all assumptions on the residuals for treatment SS were met (p > 0.05), whereas treatments CS, 340SS, and 660SS, despite the rejection of homoscedasticity (p < 0.05) showed normality and independence. For the TL model, the results show no evidence to reject the normality hypothesis or the lack of homoscedasticity of the residuals. However, the violation of the assumption of independence of the errors can be seen for all treatments.
1379 Semina: Ciências Agrárias, Londrina, v. 41, n. 4, p. 1373-1384, jul./ago. 2020
New model of evaluation of sunflower and corn silages by the in vitro gas production technique Nonetheless, it was chosen to preserve
observation 16 in the analysis since data analysis after its removal showed no significant change in parameter estimates and, consequently, no change in the fits obtained.
All situations studied (Table 3) for model LVB show that the estimated residuals had normal distribution and are independent and homoscedastic, i.e., all assumptions on the residuals for treatment
SS were met (p > 0.05), whereas treatments CS, 340SS, and 660SS, despite the rejection of homoscedasticity (p < 0.05) showed normality and independence. For the TL model, the results show no evidence to reject the normality hypothesis or the lack of homoscedasticity of the residuals. However, the violation of the assumption of independence of the errors can be seen for all treatments.
Figure 2. Analysis of residuals for the LVB and TL models for materials 660SS and SS.
Figure 2. Analysis of residuals for the LVB and TL models for materials 660SS and SS. Table 3
Statistical values of the Shapiro-Wilk, Durbin-Watson, and Breusch-Pagan tests, with their respective p-values, applied to the residuals of models LVB and TL fitted to the CGP for treatments CS, 340SS, 660SS, and SS
Treatment Shapiro-Wilk p-value Durbin-Watson p-value Breusch-Pagan p-value
CSLVB 0.9674 0.7950 1.8455 0.2677 6.0622 0.0138 CSTL 0.9419 0.3730 1.1824 0.0185 0.7354 0.3911 340SSLVB 0.9646 0.7453 1.9083 0.3124 10.454 0.0012 340SSTL 0.9389 0.3366 1.0983 0.0109 0.3366 0.5618 660SSLVB 0.9792 0.9574 1.8699 0.2848 8.8269 0.0029 660SSTL 0.9358 0.3014 1.1512 0.0153 0.7187 0.3966 SSLVB 0.9488 0.4709 1.6103 0.1323 2.5644 0.1093 SSTL 0.9145 0.1374 1.1428 0.0146 0.5289 0.4670
The behavior of CGP curves (mL kg-1 DM) for the different treatments based on the observed and
fitted data for models LVB and TL can be seen in Figure 3. What differentiates models LVB and TL is the second compartment. Model TL represents the initial phase of the data well, however, it does not model so well the exponential and asymptotic phases. However, replacing the Logistic model in the second compartment by the von Bertalanffy model (Equation 3) resulted in fits to all stages of the fermentation process. Thus, the LVB model fitted to all stages of the fermentation process of the treatments. Model TL, in turn, was less effective in fitting the curves in the exponential and asymptotic phases (Figure 3).
The kinetic degradation parameters with their respective standard errors estimated by the different models is seen in Table 4. The models had small and acceptable standard errors for the estimates. The maximum gas volume of models LVB and TL for the fractions of rapid and slow digestion of NFC and FC ranged from 113.86 to 168.79 and 95.78 to 167.14, and 53.79 to 108.95 and 69.82 to 88.04, respectively. The gas production rates of NFC and FC ranged from 0.02 to 0.08 and 0.02 to 0.09, and 0.06 to 0.20 and 0.02 to 0.10, respectively. The lag phase (λ) found for treatment CS (3.18) was greater than that of treatment SS
Table 3
Statistical values of the Shapiro-Wilk, Durbin-Watson, and Breusch-Pagan tests, with their respective p-values, applied to the residuals of models LVB and TL fitted to the CGP for treatments CS, 340SS, 660SS, and SS
Treatment Shapiro-Wilk p-value Durbin-Watson p-value Breusch-Pagan p-value
CSLVB 0.9674 0.7950 1.8455 0.2677 6.0622 0.0138 CSTL 0.9419 0.3730 1.1824 0.0185 0.7354 0.3911 340SSLVB 0.9646 0.7453 1.9083 0.3124 10.454 0.0012 340SSTL 0.9389 0.3366 1.0983 0.0109 0.3366 0.5618 660SSLVB 0.9792 0.9574 1.8699 0.2848 8.8269 0.0029 660SSTL 0.9358 0.3014 1.1512 0.0153 0.7187 0.3966 SSLVB 0.9488 0.4709 1.6103 0.1323 2.5644 0.1093 SSTL 0.9145 0.1374 1.1428 0.0146 0.5289 0.4670
1380
Semina: Ciências Agrárias, Londrina, v. 41, n. 4, p. 1373-1384, jul./ago. 2020 The behavior of CGP curves (mL kg-1 DM) for
the different treatments based on the observed and fitted data for models LVB and TL can be seen in Figure 3. What differentiates models LVB and TL is the second compartment. Model TL represents the initial phase of the data well, however, it does not model so well the exponential and asymptotic phases. However, replacing the Logistic model in the second compartment by the von Bertalanffy model (Equation 3) resulted in fits to all stages of the fermentation process. Thus, the LVB model fitted to all stages of the fermentation process of the treatments. Model TL, in turn, was less effective in fitting the curves in the exponential and asymptotic phases (Figure 3).
The kinetic degradation parameters with their respective standard errors estimated by the different models is seen in Table 4. The models had small and acceptable standard errors for the estimates. The maximum gas volume of models LVB and TL for the fractions of rapid and slow digestion of NFC and FC ranged from 113.86 to 168.79 and 95.78 to 167.14, and 53.79 to 108.95 and 69.82 to 88.04, respectively. The gas production rates of NFC and FC ranged from 0.02 to 0.08 and 0.02 to 0.09, and 0.06 to 0.20 and 0.02 to 0.10, respectively. The lag phase (λ) found for treatment CS (3.18) was greater than that of treatment SS (2.90), with the lowest value (2.00) found for treatment 660SS, which indicates the latter was more rapidly colonized.
Figure 3. Cumulative gas production curves for corn silage (CS), sunflower silage (SS), and
associations (340SS and 660SS) over the incubation period from the observed data and data fitted by the LVB and TL models.
(2.90), with the lowest value (2.00) found for treatment 660SS, which indicates the latter was more rapidly
colonized.
Figure 3. Cumulative gas production curves for corn silage (CS), sunflower silage (SS), and associations
(340SS and 660SS) over the incubation period from the observed data and data fitted by the LVB and TL
models.
Table 4
Estimated values and standard deviation (in parentheses) for parameters α
1, α
2, k
1, k
2, β, and λ for the
LVB and TL models fitted to the treatment data
Estimates (LVB) Estimates (TL) Levels CS (3.719) 113.86 (3.465) 53.79 (0.152) 0.08 (0.082) 0.06 (0.003) 1.25 (0.003) 3.18 (4.943) 95.78 (4.894) 69.82 (0.007) 0.09 (0.001) 0.02 (0.250) 4.56 340SS (5.213) 118.33 (4.795) 82.05 (0.231) 0.07 (0.073) 0.06 (0.004) 1.35 (0.003) 2.36 (6.971) 109.05 (7.035) 88.04 (0.001) 0.02 (0.010) 0.09 (0.366) 4.62 660SS (8.379) 118.98 (7.705) 108.95 (0.334) 0.07 (0.089) 0.06 (0.006) 1.37 (0.003) 2.00 (8.985) 143.05 (9.081) 80.37 (0.001) 0.02 (0.015) 0.10 (0.471) 5.01 SS (9.380) 168.79 (9.906) 78.87 (1.710) 0.02 (0.480) 0.20 (0.001) 1.25 (0.016) 2.90 (12.54) 167.14 (12.93) 78.63 (0.001) 0.02 (0.017) 0.09 (0.539) 5.79
The data concerning the parameters of rumen degradability (Table 4) show the increase in
participation of sunflower silage in the treatments increased the final volume of gases produced by the NFC
and FC combined.
The models obtained high R
2adj.
values of over 99%. However, since R
2adj.does not assess the
biological coherence of the data, it is important that it is not used as the single evaluation criterion. The
highest values of RMS, MAD, AIC, and BIC were observed for model TL, which indicates the fit to the
model data was not the most adequate. However, model LVB had the lowest values and, consequently,
obtained the best fit to the feeds tested when taking these criteria into account (Table 5).
1381 Semina: Ciências Agrárias, Londrina, v. 41, n. 4, p. 1373-1384, jul./ago. 2020
New model of evaluation of sunflower and corn silages by the in vitro gas production technique
Table 4
Estimated values and standard deviation (in parentheses) for parameters α1, α2, k1, k2, β, and λ for the LVB and TL models fitted to the treatment data
Estimates (LVB) Estimates (TL) Levels CS (3.719)113.86 (3.465)53.79 (0.152)0.08 (0.082)0.06 (0.003)1.25 (0.003)3.18 (4.943)95.78 (4.894)69.82 (0.007)0.09 (0.001)0.02 (0.250)4.56 340SS 118.33(5.213) (4.795)82.05 (0.231)0.07 (0.073)0.06 (0.004)1.35 (0.003)2.36 (6.971)109.05 (7.035)88.04 (0.001)0.02 (0.010)0.09 (0.366)4.62 660SS 118.98(8.379) (7.705)108.95 (0.334)0.07 (0.089)0.06 (0.006)1.37 (0.003)2.00 (8.985)143.05 (9.081)80.37 (0.001)0.02 (0.015)0.10 (0.471)5.01 SS (9.380)168.79 (9.906)78.87 (1.710)0.02 (0.480)0.20 (0.001)1.25 (0.016)2.90 (12.54)167.14 (12.93)78.63 (0.001)0.02 (0.017)0.09 (0.539)5.79
The data concerning the parameters of rumen degradability (Table 4) show the increase in participation of sunflower silage in the treatments increased the final volume of gases produced by the NFC and FC combined.
The models obtained high R2
adj. values of over
99%. However, since R2
adj. does not assess the
biological coherence of the data, it is important that it is not used as the single evaluation criterion. The highest values of RMS, MAD, AIC, and BIC were observed for model TL, which indicates the fit to the
model data was not the most adequate. However, model LVB had the lowest values and, consequently, obtained the best fit to the feeds tested when taking these criteria into account (Table 5).
RE is a measure that reflects the relative level of precision of a model compared to another. When the RE of a model compared to another is greater than 1.0, that indicates the former was more efficient compared to the latter. It can be seen that, in all silage comparisons, models LVB and TL had RE > 1.0 and RE < 1.0, respectively (Table 6).
Table 5
Criteria used to select the most adequate non-linear model
Criteria Levels CS 340SS 660SS SS R2 adj._TL 0.9997 0.9996 0.9994 0.9985 R2 adj._LVB 0.9987 0.9980 0.9973 0.9971 RMS_TL 5.86 12.93 21.96 29.82 RMS_LVB 1.56 2.67 5.32 17.39 MAD_TL 1.63 2.51 3.36 3.89 MAD_LVB 0.77 0.96 1.43 2.83 AIC_TL 79.71 92.36 100.84 105.74 AIC_LVB 59.08 67.63 78.62 97.58 BIC_TL 84.35 96.99 105.47 110.37 BIC_LVB 64.48 73.04 84.03 102.99
1382
Semina: Ciências Agrárias, Londrina, v. 41, n. 4, p. 1373-1384, jul./ago. 2020
Table 6
Relative efficiency (RE) between the variance in residuals of the models fitted to the different substrates
Models(2)
LVB TL LVB TL LVB TL LVB TL
Models(1) CS 340SS 660SS SS
LVB - 0.3 - 0.2 - 0.2 - 0.6
TL 3.7 - 4.8 - 4.1 - 1.7
-Comparing the models (Tables 6) shows the LVB model had the lowest RMS, MAD, AIC, and BIC values, besides RE > 1, which indicates it is superior to the TL model.
The analysis of residuals is a very important step in the process of fitting regression models so that, if any of the assumptions is not met, the model is not adequate and such deviation must be corrected or considered in the model (Fernandes, Pereira, Muniz, & Savian, 2014).
Mello et al. (2008) found in a visualization of dispersion plots of the residuals that the Brody and France models had identical dispersion for sunflower silages and similar dispersion for corn silages, with positive residuals different to the patterns of other models in the first hours of incubation. The von Bertalanffy, Gompertz, Logistic, and modified Logistic models followed the same dispersion trend in both substrates and had greater residual dispersion up to 60 and 72 h after incubation for sunflower and corn silages, certainly due to the greater microbial activity during those periods in both silages. The residuals were more homogeneous between 60 and 144 h for sunflower and corn silages, respectively, due to the lower microbial activity during those periods.
Mello et al. (2008) reported an overestimation in the transition between the end of the exponential phase and start of the asymptotic phase for the von Bertalanffy, Gompertz, Logistic, and modified Logistic models from 24 to 60 and 36 to 72 h after incubation for sunflower and corn silages,
respectively. Those authors also reported that the TL model had an adequate curve shape in all phases up to 144 h after incubation, except for a small trend shown at 18 h after incubation in corn silage.
Aragadvay-Yungán et al. (2015) worked with sunflower silage as single roughage or mixed with corn silage at 25, 50, and 75% and found the highest total gas production for corn silage, however, with a lower fermentation rate compared to the mixture containing 25% sunflower silage. Those authors recommended adding sunflower silage to corn silage at 25% to obtain similar rates as corn silage as single roughage.
The production results obtained in the digestibility assays on the use of sunflower silage, whether as single roughage or mixed to another, vary. Leite et al. (2006) observed that partially replacing corn silage by sunflower silage (340SS) did not impact DM intake compared to treatment 100CS. The quality of the fibrous fraction of sunflower silage is lower than that of corn silage, which leads to a reduction in its nutritional value for ruminants (Pereira et al., 2016). For that reason, it should be used as feed for dairy cows in a different manner as corn silage, with their association being an alternative to use sunflower silage in the diet of high-performance dairy cows.
Martins et al. (2011) found lower DM intake and weight loss in crossbred cows fed sunflower silage as single roughage, which was attributed to the low digestibility of the fiber in the roughage. Conversely, Leite et al. (2017) found greater nutrient intake in
1383 Semina: Ciências Agrárias, Londrina, v. 41, n. 4, p. 1373-1384, jul./ago. 2020
New model of evaluation of sunflower and corn silages by the in vitro gas production technique diets containing sunflower silage and no change in
milk production of dairy cows compared to diets containing corn silage.
The TL model estimated lower values for the k1 parameter than for k2 for treatments 340SS, 660SS, and SS. The LVB model yielded higher estimates for the degradation rate of NFC than those of FC for treatments CS, 340SS, and 660SS (Table 4), except for the degradation rate for treatment SS which resulted in estimates with difficult biological explanation. That corroborates the important aspect of the theory according to which the degradation rate of NFC is greater than that of FC, i.e., NFC are more quickly degraded than FC (Schofield et al., 1994; Malafaia, Valadares, Vieira, Silva, & Pereira, 1998). Ricacheski et al. (2017) used this recommendation in their studies.
In a research to identify the model with the best goodness of fit to the cumulative gas production curve in sunflower and corn silages, Mello et al. (2008) concluded that the TL model best described CGP. In that study, the comparisons were made according to the comparisons, RMS, mean percentage error, and number of iterations of the models fitted to the different substrates. Those same authors observed that the TL model had RE > 1 in all comparisons for sunflower silages, whereas the France model was more efficient in all comparisons for corn silages.
Conclusions
The LVB model best estimated the cumulative gas production rates and can be adopted to describe the rumen fermentation kinetics for feeds such as CS, 340SS, 660SS, and SS.
Acknowledgments
This study was financed in part by the Coordenação de Aperfeiçoamento de Pessoal de Nível Superior - Brazil (CAPES) - Finance Code 001.
References
Aragadvay-Yungán, R. G., Ravas Amor, A. A., Heredia-Nava, D., Estrada-Flores, J. G., Martinez-Castañeda, F., & Arriaga-Jordán, C. M. (2015). Evaluación in
vitro del ensilaje de girasol (Helianthus annuus L.)
solo y combinado con ensilaje de maíz. Revista
Mexicana de Ciencias Pecuarias, 6(3), 315-327.
Bertalanffy, L. V. (1957). Quantitative laws in metabolism and growth. The Quarterly Review of Biology, 32(3), 217-230. doi: 10.1086/401873
Costa, R. V., Silva, J. A., Galati, R. L., Silva, C. G. M., & Duarte, M. F. Jr. (2015). Girassol (Helianthus
annuus L.) e seus coprodutos na alimentação animal. Publicações em Medicina Veterinária e Zootecnia, 9(7), 303-320.
Fernandes, T. J., Pereira, A. A., Muniz, J. A., & Savian, T. V. (2014). Selection of nonlinear models for the description of the growth curves of coffee fruit.
Coffee Science, 9(2), 207-215.
France, J., Dijkstra, J., Dhanoa, M. S., Lopez, S., & Bannink, A. (2000). Estimating the extent of degradation of ruminant feeds from adescription of their gas production profiles observed in vitro: derivation of modelsand other mathematical considerations. British Journal of Nutrition, 83(2), 143-150. doi: 10.1017/S0007114500000180
Koops, W. J. (1986). Multiphasic growth curve analysis.
Growth, 50(2), 169-177.
Leite, L. A., Reis, R. B., Pimentel, P. G., Saturnino, H. M., Coelho., S. G., & Moreira, G. R. (2017). Performance of lactating dairy cows fed sunflower or corn silages and concentrate based on citrus pulp or ground corn. Revista Brasileira de Zootecnia, 46(1), 56-64. doi: 10.1590/s1806-92902017000100009 Leite, L. A., Silva, B. O., Reis, R. B., Faria, B. N.,
Gonçalves, L. C., Coelho, S. G., & Saturnino, H. M. (2006). Sunflower and corn silages in lactating cow diets: intake and digestibility. Arquivo Brasileiro de
Medicina Veterinária e Zootecnia, 58(6), 1192-1198.
doi: 10.1590/S0102-09352006000600031
Malafaia, P. A. M., Valadares, S. D. C., F., Vieira, R. A. M., Silva, J. D., & Pereira, J. C. (1998). Ruminal kinetics of some feeds investigated by gravimetric and metabolic techniques. Revista Brasileira de
Zootecnia, 27(2), 370-380.
Martins, A. D. S., Oliveira, J. R. D., Lederer, M. L., Moletta, J. L., Galetto, S. L., & Pedrosa, V. B. (2014). Glycerol inclusion levels in corn and sunflower silages. Ciência e Agrotecnologia, 38(5), 497-505. doi: 10.1590/S1413-70542014000500009
1384
Semina: Ciências Agrárias, Londrina, v. 41, n. 4, p. 1373-1384, jul./ago. 2020 Martins, S. C. D. S. G., Rocha, V. R., Jr., Caldeira, L.
A., Pires, D. A. D. A., Barros, I. C., Sales, E. C. J. D., & Oliveira, C. R. D. (2011). Intake, digestibility, milk production and economic analysis of diets with different forages. Revista Brasileira de Saúde e
Produção Animal, 12(3), 691-708.
Maurício, R. M., Mould, F. L., & Dhanoa, M. S. (1999). A semi-automated in vitro gas production technique for ruminants fedstuff evaluation. Animal Feed Science
and Technology, 79(4), 321-330. doi: 10.1016/
S0377-8401(99)00033-4
Maurício, R. M., Pereira, L. G. R., Gonçalves, L. C., Rodriguez, N. M., Martins, R. G. R., & Rodrigues, J. A. S. (2003). Potencial da técnica in vitro semi-automática de produção de gases para avaliação de silagens de sorgo (Sorghum bicolor (L.)
Moench). Revista Brasileira de Zootecnia, 32(4),
1013-1020. doi: http://dx.doi.org/10.1590/S1516-35982003000400029
Mello, R., Magalhães, A. L. R., Breda, F. C., & Regazzi, A. J. (2008). Models for fit of gas production in sunflower and corn silages. Pesquisa Agropecuária
Brasileira, 43(2), 261-269. doi:
10.1590/S0100-204X2008000200016
National Research Council (2001). Nutrient requirements
of dairy cattle (7nd ed. rev.). Washington, DC:
National Academy of Science.
Pasternak, H., & Shalev, B. A. (1994). The effect of a feature of regression disturbance on the efficiency of fitting growth curves. Growth, Development and
Aging, 58(1), 33-39.
Pereira, D. R. M., Godoy, M. M., Sampaio, C. C., Silva, T. V., Felix, M. J. D., & Oliveira, R. L. R. (2016). Uso do girassol (Helianthus annuus) na alimentação animal: aspectos produtivos e nutricionais.
Veterinária e Zootecnia, 23(2), 174-183.
Pires, L. C., Machado, T. M. M., Carneiro, P. L. S., Silva, J. B. L. da, Holanda Barbosa, A. D. de, & Almeida Torres, R. de. (2017). Growth curve of repartida goats reared in the caatinga region, brazil.
Semina: Ciências Agrárias, 38(2), 1041-1050. doi:
10.5433/1679-0359.2017v38n2p1041
R Development Core Team (2017). R: A language and
environment for statistical computing. Vienna: R
Foundation for Statistical Computing. Retrieved from http://www.r-project.org
Ricacheski, S. T., Henrique, D. S., Mayer, L. R. R., Oliveira, J. G., Rosler, J. A., & Fluck, A. C. (2017). Chemical composition and ruminal degradation kinetics of White oat (Avena sativa L.) IPR 126.
Revista Brasileira de Saúde e Produção Animal, 18(1),
50-61. doi: 10.1590/S1519-99402017000100006 Santos, A. L. P., Moreira, G. R., Brito, C. C. R., Silva, F.
S. G., Costa, M. L. L., Pimentel, P. G., & Mizubuti, I. Y. (2018). Method to generate growth and degrowth models obtained from differential equations applied to agrarian sciences. Semina: Ciências Agrárias,
39(6), 2659-2672. doi: 10.5433/1679-0359.2018v3
9n6p2659
Schofield, P., Pitt, R. E., & Pell, A. N. (1994). Kinetics of fiber digestion from in vitro gas production.
Journal of Animal Science, 72(11), 2980-2991. doi:
10.2527/1994.72112980x
Sniffen, C. J., O’Connor, J. D., Van Soest, P. J., Fox, D. G., & Russel, J. B. (1992). A net carbohydrate and protein system for evaluating cattle diets: II. Carbohydrate and protein availability. Journal of Animal Science, 70(11), 3562-3577. doi: 10.2527/1992.70113562x Souza, G. S. (1998). Introdução aos modelos de
regressão linear e não linear. Brasília: EMBRAPA
SPI/EMBRAPA-SEA.
Theodorou, M. K., Williams, B. A., Dhanoa, M. S., Mcallan, A. B., & France, J. (1994). A simple gas production method using a pressure transducer to determine the fermentation kinetics of ruminant feed. Animal Feed Science and Technology, 48(1), 185-197. doi: 10.1016/0377-8401(94)90171-6 Viana, P. T., Pires, A. J. V., Oliveira, L. B., Carvalho, G. G.
P., Ribeiro, L. S. O., Chagas, D. M. T., & Carvalho, A. O. (2012). Fractioning of carbohydrates and protein of silages of different forages. Revista Brasileira
de Zootecnia, 41(2), 292-297. doi:
10.1590/S1516-35982012000200009
Wanderley, W. L., Ferreira, M. D. A., Batista, A. M. V., Veras, A. S. C., Bispo, S. V., Silva, F. M. D., & Santos, V. L. F. (2012). Intake, digestibility and ruminal measures in sheep feed silage and hay in association with cactus pear. Revista Brasileira de
Saúde e Produção Animal, 13(2), 444-456.
Wang, M., Tang, S., & Tan, Z. (2011). Modeling in
vitro gas production kinetics: Derivation
oflogistic-exponential (le) equations and comparison of models.
Animal Feed Scienceand Technology, 165(3-4),