HAL Id: hal-00700985
https://hal-mines-paristech.archives-ouvertes.fr/hal-00700985
Submitted on 22 Feb 2018
HAL is a multi-disciplinary open access
archive for the deposit and dissemination of
sci-entific research documents, whether they are
pub-lished or not. The documents may come from
teaching and research institutions in France or
abroad, or from public or private research centers.
L’archive ouverte pluridisciplinaire HAL, est
destinée au dépôt et à la diffusion de documents
scientifiques de niveau recherche, publiés ou non,
émanant des établissements d’enseignement et de
recherche français ou étrangers, des laboratoires
publics ou privés.
Toward a new interpretation of the mechanical
behaviour of As-quenched low alloyed martensitic steels
Sébastien Allain, Olivier Bouaziz, M. Takahashi
To cite this version:
Sébastien Allain, Olivier Bouaziz, M. Takahashi. Toward a new interpretation of the mechanical
behaviour of As-quenched low alloyed martensitic steels. ISIJ international, Iron & Steel Institute of
Japan, 2012, 52, pp.717-722. �10.2355/isijinternational.52.717�. �hal-00700985�
Toward a New Interpretation of the Mechanical Behaviour of
As-quenched Low Alloyed Martensitic Steels
Sebastien ALLAIN,1) Olivier BOUAZIZ1,2) and Manabu TAKAHASHI3)
1) Arcelormittal Maizières Research SA, Voie Romaine-BP30320, 57283 Maizières-lès-Metz Cedex, France. 2) Centre des Matériaux, Ecole des Mines de Paris, CNRS UMR 7633, B.P. 87, 91003 Evry Cedex, France. 3) Steel Research Laboratories, Nippon Steel Corporation, Shintomi 20-1, Futtsu, Chiba, 293-8511 Japan.
(Received on September 2, 2011; accepted on September 30, 2011)
Though as-quenched martensite exhibits a low uniform elongation in tension, it is highlighted that this phase has a very high strain-hardening which increases with carbon content and a large Bauschinger effect. Because usual dislocation storage can not explain reasonably this particular behaviour, an approach based on a contin-uum composite view of martensite (CCA) is developed suitable to capture all the experimental features. KEY WORDS: martensite; carbon; strain-hardening; Bauschinger; composite; modelling.
1. Introduction
The martensite is one of the main “natural” nano-struc-tured phases used to strengthen the steels. Apart from some fully martensitic steels, this essential constituent is involved in all very high strength steels developed for automotive or industry applications for instance, as Dual-Phase steels. A lot of work has been done for many years to understand the yield stresses and the strengths of this phase in relation with its microstructure. The martensitic steels (metallurgy, crys-tallography, strengths …) are the topic of numerous reviews in the scientific literature.1,2)
The main parameters which seem to control the behaviour of a martensitic steel is its initial carbon content as symbol-ized by the well-known evolution of its hardness.2) This
increase in hardness with carbon content is probably the most commonly accepted correlation between a mechanical property and a metallurgical feature. The other correlations between microstructure and mechanical properties (mainly Yield Strength) are widely discussed, but no consensus appears in the literature and the microstructural length scales (laths, packet, prior austenite grain size) responsible for the strength of martensite are still a matter of debate.
On the contrary, the intensity and the mechanisms of strain-hardening have been surprisingly poorly discussed. This lack of interest is probably due to the low uniform elon-gation (i.e. strain at necking). So no model predicting the whole tensile curves of as-quenched martensitic steels is available in the literature, except some purely phenomeno-logical polynomial law.3) The behaviour of martensite is even
often reduced to an elastic or an elastic-perfectly plastic law.4)
2. Behaviour of As-quenched Martensitic Steels The work-hardening of different as-quenched martensitic steels for which tensile curves are available in literature
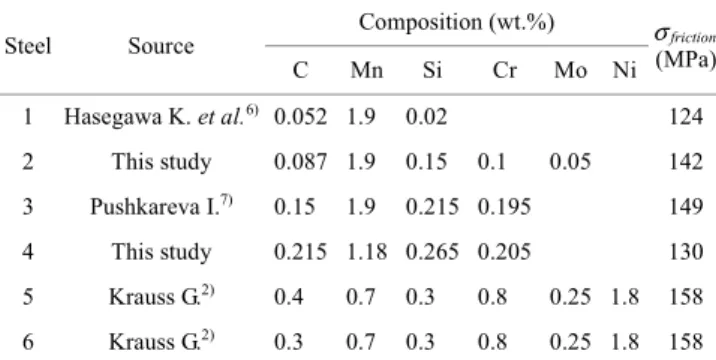
from different authors have been analyzed. The steels have been chosen with varying carbon contents from 0.05 wt.%C to 0.4 wt.%C because steels with higher carbon contents are known to be brittle during tensile tests in as-quenched con-ditions. The compositions of the studied steels and related references are reported in Table 1.
The materials tested within the frame of this study have been elaborated at laboratory scale (60 kg cast, hot-rolling, cold-rolling). The final annealing treatments have been per-formed thanks to a salt-bath to reach a fully austenitic state and the samples have then been water-quenched. The tensile tests have been performed following the ISO procedure on 12.5×50 samples.
To be able to compare rigorously the tensile curves of these different martensitic steels, a friction stress σfriction
related to solid solution hardening of iron lattice depending on substitutional alloying elements has been subtracted. This friction stress in MPa is expressed as:5)
σfriction = 60 + 33 wt.% Mn + 81 wt.% Si
+ 48 wt.% Cr + 48 wt.% Mo + 0 wt.% Ni... (1)
Table 1. Composition of the studied steels and corresponding
ref-erences. Their respective friction stresses σfriction are
cal-culated thanks to Eq. (1).
Steel Source Composition (wt.%) σfriction
(MPa) C Mn Si Cr Mo Ni 1 Hasegawa K. et al.6) 0.052 1.9 0.02 124 2 This study 0.087 1.9 0.15 0.1 0.05 142 3 Pushkareva I.7) 0.15 1.9 0.215 0.195 149 4 This study 0.215 1.18 0.265 0.205 130 5 Krauss G.2) 0.4 0.7 0.3 0.8 0.25 1.8 158 6 Krauss G.2) 0.3 0.7 0.3 0.8 0.25 1.8 158
ISIJ International, Vol. 52 (2012), No. 4
The corresponding tensile curves are plotted in Figs. 1(a) and 1(b). Figure 1(a) shows the evolution of the true tensile stress as a function of true tensile strain and Fig. 1(b) the slope of the tensile curves as a function of true stress (known as Kocks-Mecking plot).8,9) For the sake of
compar-ison, the elastic behaviour of each curve has been recalcu-lated to impose a common Young modulus chosen arbitrarily equal to 200 GPa, even if slightly lower values could be expected by.10)
Both Figs. 1(a) and 1(b) highlight the main features of the behaviour of martensitic steels:
• All studied martensitic steels show rather low and con-stant microplasticity yield stress whatever the carbon content (about 400 MPa, indicated by an arrow in Fig. 2(b)). This particular feature can only be explained by the presence of soft areas in the microstructure the local yield strengths of which are nearly independent on the chemical composition.
• All studied martensitic steels show a high initial work-hardening rate which increases with their carbon con-tents. This statement explains why many authors have observed an increase in the conventional yield stress (0.2% plastic strain onset) as a function of the carbon content despite invariable microplasticity yield strength.2)
• This dependence of their work-hardening rates on the carbon content is sustained up to strain at necking. In FCC or in BCC metals the maximum strain-hardening rate in tension induced by a dislocation storage mechanism is about Y/100 where Y is the Young modulus.11,12) However
it is clear from Fig. 1(b) highlights that the strain-hardening rate of martensite is far higher than this upper-bound up to
2% or 3% of strain. It means that a dislocation storage mechanism is definitively not suitable to explain the behav-iour of this phase.
In order to take into account all these characteristics and especially the last comment, martensite should be consid-ered, not as a single phase material but as a continuum het-erogeneous composite,13) made of a mixture of soft and hard
phases, whose respective fractions vary with the initial car-bon content. The soft phases control the microplasticity yield whereas the hard phases (remaining elastic) provide the high work-hardening. So the observed behaviour is probably a very large elasto-plastic transition. As suggested by Asaro,14) this kind of approach gives naturally the
possi-bility to evaluate internal stresses and the kinematic contri-bution to work-hardening (Kinematic type I in the Asaro classification) and to predict the behaviour under non-monotonous loading paths. In order to confirm this aspect, Bauschinger effect has been measured on a Fe–0.1 wt%.C– 2.3 wt.%Mn–0.3 wt.%Si–0.8 wt.%Cr steel using reverse shear test. The experimental stress-strain-curve is reported in Fig. 2. The level of Bauschinger effect after 6.5% strain is about 800 MPa (i.e. kinematic hardening contribution is 400 MPa). As total flow stress is 1 250 MPa and as yield stress is about 750 MPa, kinematic hardening represents about 400 MPa, a very significant part of the total 500 MPa strain-hardening (i.e. about 80%). This aspect confirms the interest of a composite type approach.
3. Continuum Composite Approach (CCA) 3.1. Description of the CCA
In order to take into account the observations and the con-clusions of the previous part, a generalized Masing model is now developed, called CCA in the following. It consists of a continuum composite of elastic-perfectly plastic phases in interaction. The behaviour of each phase of the continu-um composite is supposed to be elastic-perfectly plastic and so requires only two parameters for a proper description, its Young modulus (supposed to be the same for each phases) and its respective yield stress. The composite can thus be described univocally by the continuous distribution of the density of probability f(σ) to find a phase fractions having a local yield stress σ. This distribution will be called stress spectrum in the following. An example of the expected
den-(a)
(b)
Fig. 1. (a) Normalized true stress – true strain tensile curves of the studied steels (b) Strain-hardening rate – true strain curves (Kocks-Mecking plot) corresponding to the tensile tests presented in (a).
Fig. 2. Experimental behaviour of a Fe–0.1 wt%.C–2.3 wt.%Mn– 0.3 wt.%Si–0.8 wt.%Cr martensitic steels during a Bausch-inger test by reverse shear test.
sity of probability f(σ) and its associated cumulated function
F(σ) are plotted in Fig. 3. The function F(σ) is defined as follows:
... (2) The function f must respect the following mathematical con-ditions for obvious consistency reasons:
... (3) The stress spectrum thus represents the distribution of yield stress in the microstructure.
To make calculations easier, the threshold stress below which all the phases of the composite remains elastic is defined as σmin (cf. Fig. 3).
... (4) This value corresponds to the yield stress of the softest phase of the composite, i.e. the threshold macroscopic stress at the very beginning of the microplasticity range, i.e. about 400–500 MPa as indicated in Fig. 1(b).
As the stress spectrum is supposed to be known, the aim of the CCA is to estimate the resulting macroscopic behav-iour of the composite, i.e. Σ the macroscopic stress as a function of E the applied macroscopic strain.
If the macroscopic stress Σ is lower than σmin, all the
phas-es remains elastic and the behaviour of the composite is ful-ly elastic. When Σ reaches the threshold σmin, the softest
phases of the composite plasticize while keeping their respective yield stress values (perfectly-plastic assumption). It permits to define the critical stress σL (E) in the stress
spectrum as the highest yield stress among the plasticized phases for a given macroscopic strain E. The remaining fraction of harder phases will remain elastic. The stress state of these phases is the same and is equal to σL (elastic
load-ing).
Along with the macroscopic deformation E, the macro-scopic stress and thus the fraction of plasticized phases increases. As a consequence, σL increases necessarily with
the macroscopic strain E.
In order to avoid the unrealistic iso-strain assumption to describe the interactions between the phases in the
compos-ite after any plasticization, a constant parameter β is defined as:
... (5) where σ and ε are respectively the local stress and the local strain in each element of the composite. The β parameter is of course the same for all the phases constituting the composite and permits to manage varying localization con-ditions from iso-strain concon-ditions (β = ∞) to iso-stress con-ditions (β = 0).
Fixing β permits to calculate the evolution of σL as
fol-lows:
... (6)
with Y the Young modulus and εL the elastic strain
associ-ated to phases that remain elastic under the stress σL.
Finally, for a given macroscopic strain E, the macroscopic stress Σ can be calculated as follows:
... (7) The first integral term corresponds to the contribution of the already plasticized phases of the composite and the second one the phases that remains elastic under σL loading. In most
of the cases, these integrals can not be solved explicitly. Nevertheless, the derivative as a function of the macroscop-ic strain (i.e. the macroscopmacroscop-ic strain-hardening rate) can be calculated without any prior assumption on the stress spec-trum:
... (8) As all the already plasticized phases are perfectly plastic, the strain hardening rate will only be maintained by phases remaining elastic whose fraction is equal to (1–F(σL)).
The consistency of the deduced Eq. (8) can be assessed in the following conditions:
• In the macroscopic elastic range Σ ≤ σmin then σL ≤ σmin
and F(σL) = 0 and thus:
... (9) • In iso-strain conditions (β >> Y), Eq. (8) can be dras-tically simplified and leads to the equation used by:15,16) Fig. 3. Typical stress spectrum f(σ) and its associated cumulated
function F(σ). Definition of σmin.
F σ f ξ ξd σ
( )
=( )
−∞∫
∀( )
≥ + ∞( )
=( )
= −∞ +∞∫
σ σ ξ ξ , f F f d 0 1 ∀ ≤σ σmin, f( )
σ =0 andF( )
σ =0 β σ ε = − − − Σ E Σ Σ Σ − = −(
−)
⇔ + = + ⇔ = + + σ β ε β σ βσ σ ββ L L L L L E E Y E Y 1 Σ =( )
+( )
+∞∫
∫
f d L f d L min L σ σ σ σ σ σ σ σ σ d f L Ld L f L Ld L f d d L L Σ =( )
+ −( )
+⎛( )
⎝ ⎜ ⎜ ⎞ ⎠ ⎟ ⎟ ⎛ ⎝ ⎜ ⎜ ⎞ ⎠ ⎟ ⎟ = +∞∫
σ σ σ σ σ σ σ σ σ σ 1−−( )
(
)
× = −(
( )
)
× + + ⇒ = +( )
−( )
(
F d F d dE Y d dE Y F F L L L L L σ σ σ ββ σ β σ 1 1 1 1 1 Σ Σ))
d dE Y Σ=ISIJ International, Vol. 52 (2012), No. 4
... (10) The work hardening becomes thus a simple function of the fraction of phases remaining elastic and of the Young mod-ulus. Nevertheless, this formulation leads to a too stiff description of the behaviour and less accurate prediction of internal stresses.
3.2. Adjustment of the Model
The model has been identified to capture the behaviour of the six different martensitic steels previously analyzed. The shape of the mechanical spectrum has been fixed (Avrami type law) with three free parameters which were adjusted to best reproduced the tensile tests. The Avrami type law is given independently by:
... (11) Where n controls the shape of the distribution and σ0 the
width of the stress spectrum.
The β parameter has been set arbitrarily to equal to Y/4 (50 GPa) in the following. The procedure adjustment reveals that a single couple of n and σmin values can be chosen to
describe the behaviour of all tensile curves, while only σ0
should increase with carbon content. The results of the mod-el are compared to tensile and hardening curves of Fig. 1 with n = 1.82 and σmin = 300 MPa for all the steels. Only σ0
varies with steels identified to:
σ0 (wt.%C) = 645 + 5 053 × (wt.%C)1.34... (12)
As shown in Fig. 4, the agreement is particularly good per-mitting to reproduce very accurately stress levels, elastic-plastic transitions and the evolution of the strain-hardening rate as a function of strain or stress. Figures 4(a) and 4(b) present the comparison between the results of the model and experimental tensile curves of the studied steels. Figure 4(c) represents the deduced σ0 values as a function
of their carbon content. The deduced stress spectra f(σ) for the studied steels are represented in Fig. 4(d). All the curves begin of course at the same σmin and their maximum
appears at stress just below their respective UTS. The tails of the stress distributions do not exceed 4 000 MPa for steels whose carbon contents is lower than 0.3%C whereas steels with higher carbon contents require hard phases with higher yield strengths. This critical value corresponds to the fracture stress of the lath structure established by Saeglitz and Krauss in various tempered martensitic steels.17) It could thus provide a straightforward explanation
why martensitic steels with carbon content higher than 0.35 wt.%C show premature brittle fracture before reaching uni-form elongation during a tensile tests, as local internal stresses in their microstructure could exceed 4 000 MPa in tension.
The σmin value could be considered as low even
consid-ering the strength of areas fully depleted with carbon atoms that can be present in the microstructure.18) Nevertheless,
this value has been determined on curves whose friction stress contributions have been removed. In order to take into
account this contribution expressed in Eqs. (1), (11) should be modified in the following way to compute tensile curves without modification of Eq. (8):
d dE Y F YE Σ =
(
1−( )
)
ifσ σ then σ else σ σ σ σ <( )
=( )
= − −⎛ − ⎝ ⎜ ⎞ ⎠ ⎟ ⎛ ⎝ ⎜ ⎜ ⎞ ⎠ ⎟ ⎟ min min F F n 0 1 0 exp (a) (b) (c) (d)Fig. 4. (a) Comparison between the results of the model and exper-imental tensile curves of the studied steels (b) Comparison between the results of the model and experimental evolu-tion of the slopes of the tensile curves as a funcevolu-tion of true stress (c) Evolution of the adjusted σ0 parameters for each
studied steel compared to evolution predicted by Eq. (12) (d) Adjusted stress spectrum of the studied steels.
.... (13)
In that case, the order of magnitude for σmin + σfriction is about
450–500 MPa for the studied steels, more consistent with a highly deformed ferritic structure without carbon in solid solution.
In addition, the approach has been tested to describe the behaviour in compression of a Fe–0.6 wt.%C–1.5 wt.%Mn steel deformed in uni-axial compression in order to test the modelling for higher carbon content avoiding brittle fracture in tension. The equivalent true stress as a function of the equivalent true strain is represented in Fig. 5. The σ0 value
estimated by Eq. (12) is somewhat too low to reproduce the stress levels achieved experimentally and has been adjusted independently (4 092 MPa instead of 3 193 MPa predicted by Eq. (12)). The results of the model have been represented in Fig. 5 with a reasonable agreement.
3.3. Validation of the Approach on Non-monotonous Loading (Bauschinger)
Finally the CCA is assessed for predicting the behaviour along Bauschinger test presented in Fig. 2. The model has
been first applied with the adjusted parameters determined above only for a monotonic loading. The Young modulus has been adjusted to reproduce experimental data (Y = 140 GPa) in the direct loading part. The forward loading behaviour in Bauschinger test predicted by the model is pre-sented in Fig. 6 and is here again in excellent agreement with experiment. The calculations of the backward loading path relies on the Eq. (13) considering a new forward load-ing except that the stress spectrum should be adapted to take into account internal stresses generated during initial for-ward loading path.14) The necessary adaptations of the stress
spectrum are clearly out-of-scope of this first presentation of the model and will be detailed in further publications. The predicted behaviour during the backward loading path is also represented in Fig. 6 in a reasonable agreement with experimental data. The model predicts not only with a reli-able Bauschinger effect (810 MPa instead of 650 MPa) but also the continuous and transient yielding process classical-ly observed during reverse loading of Bauschinger experi-ments. The description of this last feature with an empirical equation would have required a large number of fitting parameters for similar prediction accuracy.19)
The model appears however to be slightly too stiff. It could be link to the assumption that all the phases compos-ing the microstructure show a perfectly plastic behaviour. This assumption is probably reasonable as all martensitic structures are saturated with quench dislocations but maybe too rough. It imposes that the whole macroscopic work-hardening is explained by the presence of phases remaining elastic. Introducing a limited work-hardening in each phase of spectrum will surely help to improve the prediction of the models in term of internal stresses.
4. Conclusions and Perspectives
An original vision of the behaviour of martensitic steels considered as a continuum composite (CCA) has been pro-posed and validated. The approach is suitable to explain their main experimental characteristics:
• a rather low microplasticity yield strength • a very high work-hardening rate,
• a large Bauschinger effect.
This modelling succeeds where the traditional approaches based on dislocation storage of work-hardening fail in describing perfectly the elastic-plastic transitions, the simul-taneous high strengths and high strain-hardening rates or behaviour along non-monotonous loading (Bauschinger tri-als) without any complimentary parameters or internal vari-ables.
The model introduces the notion of stress spectrum, which gives a vision of the distribution of local yield strengths in the martensitic microstructures. The yield strength of the softest is about 450–500 MPa whatever the nominal carbon content of the steels and could correspond well to the strength of a deformed ferrite depleted in carbon. This spectrum spreads over a large range of stresses higher than 4 GPa in a 0.4 wt.%C martensitic steel. The adjustment of the model on various martensitic steels with varying car-bon content has permitted to establish a relationship corre-lating the width of the spectrum as a function of the nominal carbon content of the steel for a practical use.
Fig. 5. Comparison between the model and experimental true stress – true strain compression curves of high carbon mar-tensitic steels (Fe–0.6 wt.%C). The parameters used for the model are indicated.
Fig. 6. Comparison between predicted and experimental behaviour of a Fe–0.1wt%.C–2.3 wt.%Mn–0.3 wt.%Si–0.8 wt.%Cr martensitic steels during a Bauschinger trial. The parame-ters used for the calculations are deduced strictly from the previous adjustment procedure.
ifσ σ σ then σ 0 else σ σ σ σ < +
( )
=( )
= − − − + min friction min frictio F F 1 exp nn n(
)
⎛ ⎝ ⎜ ⎜ ⎞ ⎠ ⎟ ⎟ ⎛ ⎝ ⎜ ⎜⎜ ⎞ ⎠ ⎟ ⎟⎟ σ0ISIJ International, Vol. 52 (2012), No. 4
Despite the added value of this contribution, the actual knowledge about the local deformation mechanisms of mar-tensitic steels does not permit to establish a seamless link between the local flow stress distribution (stress spectrum) and microstructure features (carbon distribution, laths, block, packet, ..). So this new approach should be completed by detailed quantitative observations of the different possi-ble microstructural heterogeneities reported in as-quenched martensite:
• A first possible source of dispersion of local yield stress-es in the microstructure is the distribution of lath/plate thickness. Nevertheless, the associated dispersion of local flow stresses is far from being sufficiently scat-tered to give rise to sufficiently high internal stresses alone.
• Kelly20) has for instance pointed out that carbon content
will control in martensitic structure the proportion of twinned (soft) and untwined (hard) fractions through the Ms temperature. He also claimed that this interpre-tation is able to explain the effect of ausforming. • The recent progress in 3D Atom Probe Tomography
highlighted that carbon is far from being homoge-neously distributed within martensitic laths even in fresh as-quenched martensite.2,18,21) Local carbon
seg-regation on planar and linear microstructure defects such as martensite laths, quench dislocations or twins can lead to high dispersions of local flow stress. The areas depleted in carbon (mainly a ferritic phase hard-ened by quench dislocations) could well explain the low microplasticity yield strength reported for these steels, whereas areas containing higher carbon contents will correspond to the hard phases. Nevertheless, the main weakness of this explanation is that the scale of this dispersion is fine and of the order of magnitude of elastic interaction between dislocations.
Other possible ways to improve the model would be the introduction of a weak work-hardening rate in each phase of the composite instead of considering perfectly-plastic behaviour for a better description of the internal stresses. A second improvement would be a numerical determination of
the localization parameter (β) thanks to self-consistent or FEM simulations in order to justify the arbitrary choice made in the present paper.
Acknowlegements
The authors want to thank Mohamed Gouné and Jean-Philippe Masse from ArcelorMittal, Guillaume Badinier and Chad Sinclair from the University of British Columbia, Fréderic Danoix from the University of Rouen and Hatem Zurob from Mc Master University for their fruitful and stim-ulating discussions.
REFERENCES
1) G. B. Olson and W. S. Owen: Martensite A tribute to Morris Cohen, ASM Int. Publishers, USA, (1992).
2) G. Krauss: Mater. Sci. Eng., A273–275 (1999), 40.
3) K. S. Choi, W. N. Liu, X. Sun and M. A. Khaleel: Metall. Mater.
Trans. A, 40A (2009), 796.
4) M. Delincé, Y. Bréchet, J. D. Embury, M. G. D. Geers, P. J. Jacques and T. Pardoen: Acta Mater., 55 (2007), 2337.
5) R. Blondeau: Soudage et Techniques Connexes, 34 (1980), 21. 6) K. Hasegawa, K. Kawamura, T. Urabe and Y. Hosoya: ISIJ Int., 44
(2004), 605.
7) I. Pushkareva: PhD report, INPL, (2010).
8) U. F. Kocks and H. Mecking: Progress in Mater. Sci., 48 (2003), 171. 9) H. Mecking and U. F. Kocks: Acta Metall., 29 (1981), 1865. 10) G. Ghosh and G. B. Olson: Acta Mater., 50 (2002), 2655. 11) A. Seeger, S. Mader and H. Kronmüller: Electron Microscopy and
Strenght of Crystals, ed. by Thomas&Washburn, Interscience, New-York, (1963), 665.
12) A. Keh and S. Weisman: Electron Microscopy and Strenght of Crys-tals, ed. by Thomas&Washburn, Interscience, New-York, (1963), 231.
13) G. S. Ansell and A. Arrot: Technical Report, contract NONR, 591 (15), Office of Naval Research, Defence documentation center for sci-entific and technical information, Cameron station, Alexandria, Virginia, USA, (1963).
14) R. J. Asaro: Acta Metall., 23 (1975), 1255.
15) J. Polàk and M. Klesnil: Fatigure Eng. Mater. Struct., 5 (1982), 19. 16) C. Holste and H.-J. Burmeister: Phys. Status Solidi A, 57 (1980), 269. 17) M. Saeglitz and G. Krauss: Metall. Mater. Trans. A, 28A (1997), 377. 18) B. Hutchinson, J. Hagström, O. Karlsson, D. Lindell, M. Tornberg, F. Lindberg and M. Thuvander: Acta Mater., (2011), doi: 10.1016/ j.actamat.2011.05.061.
19) J. Lemaitre and J. L. Chaboche: Mécanique des matériaux solides, 2nd ed., Dunod, Paris, (2004).
20) P. M. Kelly: Electron Microscopy and Strenght of Crystals, ed. by Thomas&Washburn, Interscience, New-York, (1963), 917. 21) F. Danoix: Rouen university, private communication, (2011).