2013 — Towards an active hearing protection device for musicians
196
0
0
Texte intégral
(2) © Copyright reserved It is forbidden to reproduce, save or share the content of this document either in whole or in parts. The reader who wishes to print or save this document on any media must first get the permission of the author..
(3) BOARD OF EXAMINERS THIS THESIS HAS BEEN EVALUATED BY THE FOLLOWING BOARD OF EXAMINERS:. Mr. Jérémie Voix, Memorandum Director Département de génie mécanique, École de technologie supérieure Mr. Ghyslain Gagnon, Committee President Département de génie électrique, École de technologie supérieure Mr. Frédéric Laville, Examiner Département de génie mécanique, École de technologie supérieure Mr. Marc Schönwiesner, External Examiner International Laboratory for Brain, Music & Sound Research. THIS THESIS HAS BEEN PRESENTED AND DEFENDED IN THE PRESENCE OF A BOARD OF EXAMINERS AND PUBLIC ON SEPTEMBER 23RD, 2013 AT ÉCOLE DE TECHNOLOGIE SUPÉRIEURE.
(4)
(5) ACKNOWLEDGEMENTS. First and foremost, I would like to thank Jérémie Voix for giving me the opportunity to do research in a field I am passionate about: audio. This has certainly changed me forever. I am grateful for his guidance and support throughout this project, and the few yet incredibly encouraging times he rolled up his sleeves to help me. I would like to thank Sonomax Technologies Inc., its Sonomax-ÉTS Industrial Research Chair in In-ear Technologies (CRITIAS) and the MITACS-Accelerate research internship program for their financial support. I would also like to acknowledge the help of Michael Turcot and Ian McIntosh in building certain prototypes. I would like to thank my colleagues at CRITIAS for their support, company and friendship, notably Cédrik Bacon, companion-in-arms in the war to finish our masters by August. I would like to thank my parents for their love and outstanding support. Many thanks to my friends for being there when I need them and understanding that I sometimes disappeared from the face of the earth for days, weeks, or months to hole myself up somewhere and work on this thesis and project. Thanks to Mérani Baril-Gilbert, whose love and encouragement fill me with happiness. Without her, I might very well have died from starvation while writing this thesis. Merci à vous tous..
(6)
(7) TOWARDS AN ACTIVE HEARING PROTECTION DEVICE FOR MUSICIANS Antoine BERNIER ABSTRACT Professional musicians are oftentimes exposed to high levels of sound. Prolonged or severe exposure to high sound levels could lead to permanent hearing loss and compromise their career. The logical solution would be to wear hearing protection devices (HPDs) when appropriate. However, perceptual discomfort associated with wearing HPD can discourage their use by musicians. The perceptual discomfort is caused by two detrimental effects: the occlusion effect and the isolation effect. The occlusion effect is often reported as an augmented, unnatural and annoying perception of one’s own voice or instrument mechanically coupled to the head when wearing HPDs. The isolation effect is the unnatural sensation of being isolated from a given sound environment and can be caused by wearing HPDs that do not compensate for psychoacoustical factors and therefore alter the wearer’s auditory perception. Both effects are highly unfavorable to the musicians’ auditory perception and compromise their capacity to perform to the best of their abilities for their audience. They are among the reasons most often reported by musicians to decide not to wear HPDs. This master’s project presents the concept and first prototype of an active HPD for musicians that aims at solving the detrimental effects while protecting the musician’s hearing. A solution for the occlusion effect is presented in the form of an earplug complemented with in-ear active noise control. Practical design issues and required trade-off are analyzed through a literature review and the implementation and characterization of an active occlusion effect reduction system, allowing reduction of the occlusion effect between 8.5 and 12 dB at 250 Hz. A solution for the isolation effect is presented in the form of an earplug complemented with digital signal processing capabilities. Factors that may cause the isolation effect are identified through a literature review and corresponding algorithms that aim at re-establishing the naturalness of the auditory perception while wearing HPDs are presented through the design and implementation of an isolation effect compensation system, allowing up to 15 dB of variable uniform attenuation when used by itself. Both systems working simultaneously in the same device would result in an active HPD for musicians that reduces the occlusion effect and offers uniform variable attenuation up to 25 dB and perceived uniform attenuation up to 25 phons. The aim of this active HPD for musicians is to cause the least perceptual discomfort while protecting a musician’s most precious tool: his hearing.. Keywords:. Musicians, earplug, hearing protection device, active noise control, in-ear active noise reduction, active occlusion effect reduction, occlusion effect, isolation effect.
(8)
(9) VERS UN PROTECTEUR AUDITIF ACTIF POUR MUSICIENS Antoine BERNIER RÉSUMÉ Les musiciens professionels sont exposés à de forts niveaux sonores et devraient protéger leur audition afin d’éviter des pertes auditives permanentes qui pourraient potentiellement compromettre leur carrière. Étant donné que de forts niveaux sonores sont souvent inévitables dans le cadre de leur travail, la solution logique serait de porter des protections auditives lorsque nécessaire. Cependant, un inconfort perceptuel est associé au port de protecteurs auditifs et freine leur adoption par les musiciens. Cet inconfort découle de deux effets indésirés : l’effet d’occlusion et l’effet d’isolement. L’effet d’occlusion est souvent décrit comme une perception augmentée, dénaturée et désagréable de sa propre voix ou de son instrument couplé mécaniquement à la tête. L’effet d’isolement est la sensation souvent désagréable d’être isolé de son environnement sonore. L’effet d’occlusion et l’effet d’isolement compromettent la capacité des musiciens d’offrir une performance musicale à la mesure de leurs habiletés losqu’ils portent des protecteurs auditifs. Ils font partie des raisons les plus souvent évoquées par les musiciens pour justifier leur décision de ne pas porter de tels protecteurs. Ce projet de maîtrise présente le concept et premier prototype d’un bouchon d’oreille actif pour musiciens qui vise à réduire l’inconfort causé par les deux effets néfastes tout en protégeant l’audition du musicien. Une solution pour contrer l’effet d’occlusion est présentée sous la forme d’une protection auditive dotée d’un contrôle actif du bruit intra-auriculaire. Les considérations pratiques et compromis associés à la conception d’un tel contrôle sont analysés à travers une revue de littérature ainsi que par l’implémentation et la caractérisation d’un système actif de réduction de l’effet d’occlusion, permettant d’obtenir une réduction de 8.5 ou 12 dB à 250 Hz. Une solution pour l’effet d’isolement est présentée sous la forme d’une protection auditive dotée d’un traitement numérique de signal. Les principales causes de l’effet d’isolement sont identifiées par le biais d’une revue de littérature et des algorithmes visant à rétablir une perception auditive naturelle lors du port de protections auditives sont présentés à travers la conception et l’implémentation d’un système de compensation de l’effet d’isolement, permettant d’obtenir une attenuation uniforme variable jusqu’à 15 dB. Les deux systèmes combinés forment un protecteur auditif actif pour musiciens permettant de réduire l’effet d’occlusion et de fournir une attenuation uniforme et variable jusqu’à 25 dB, ainsi qu’une attenuation perçue comme uniforme jusqu’à 25 phons. Le but de ce nouveau protecteur auditif est de minimiser l’inconfort perceptuel tout en protégeant l’outil de travail le plus important du musicien : son audition.. Mot-clés :. Musiciens, bouchon, protecteur auditif, contrôle actif du bruit, contrôle actif de l’effet d’occlusion, effet d’occlusion, effet d’isolement.
(10)
(11) CONTENTS. Page INTRODUCTION . . . . . . . . . . . . . . . . . . . . . . . . . . . . . . . . . . . . . . . . . . . . . . . . . . . . . . . . . . . . . . . . . . . . . . . . . . . . . .. 1. CHAPTER 1 LITERATURE REVIEW . . . . . . . . . . . . . . . . . . . . . . . . . . . . . . . . . . . . . . . . . . . . . . . . . . . 1.1 Context of the problem . . . . . . . . . . . . . . . . . . . . . . . . . . . . . . . . . . . . . . . . . . . . . . . . . . . . . . . . . . . . . . . . 1.1.1 Music-induced hearing loss . . . . . . . . . . . . . . . . . . . . . . . . . . . . . . . . . . . . . . . . . . . . . . . . . 1.1.2 Legislation and recommendations regarding risk of hearing loss . . . . . . . . . 1.1.3 Efficiency of commercially available hearing protection devices . . . . . . . . . 1.2 The occlusion effect . . . . . . . . . . . . . . . . . . . . . . . . . . . . . . . . . . . . . . . . . . . . . . . . . . . . . . . . . . . . . . . . . . . 1.2.1 Characteristics of the occlusion effect . . . . . . . . . . . . . . . . . . . . . . . . . . . . . . . . . . . . . . 1.2.2 Measuring the occlusion effect. . . . . . . . . . . . . . . . . . . . . . . . . . . . . . . . . . . . . . . . . . . . . . 1.2.3 Solutions to the occlusion effect . . . . . . . . . . . . . . . . . . . . . . . . . . . . . . . . . . . . . . . . . . . . 1.3 Active noise control. . . . . . . . . . . . . . . . . . . . . . . . . . . . . . . . . . . . . . . . . . . . . . . . . . . . . . . . . . . . . . . . . . . . 1.3.1 Feedback active noise control . . . . . . . . . . . . . . . . . . . . . . . . . . . . . . . . . . . . . . . . . . . . . . . 1.3.2 Analog implementation of compensators. . . . . . . . . . . . . . . . . . . . . . . . . . . . . . . . . . . 1.3.3 Digital implementation of compensators . . . . . . . . . . . . . . . . . . . . . . . . . . . . . . . . . . . 1.4 Active noise reduction in the ear canal . . . . . . . . . . . . . . . . . . . . . . . . . . . . . . . . . . . . . . . . . . . . . . . 1.4.1 The effect of ear canal variability on the plant response . . . . . . . . . . . . . . . . . . . 1.4.2 Transducers technologies in regard to active noise control . . . . . . . . . . . . . . . . 1.4.2.1 Moving-coil loudspeakers . . . . . . . . . . . . . . . . . . . . . . . . . . . . . . . . . . . . . . . 1.4.2.2 Balanced armatures loudspeakers . . . . . . . . . . . . . . . . . . . . . . . . . . . . . . . 1.4.2.3 Electrostatic loudspeakers . . . . . . . . . . . . . . . . . . . . . . . . . . . . . . . . . . . . . . . 1.4.2.4 Piezoelectric loudspeakers . . . . . . . . . . . . . . . . . . . . . . . . . . . . . . . . . . . . . . 1.4.2.5 Electret condenser microphones . . . . . . . . . . . . . . . . . . . . . . . . . . . . . . . . 1.4.2.6 MEMS microphones. . . . . . . . . . . . . . . . . . . . . . . . . . . . . . . . . . . . . . . . . . . . . 1.5 The isolation effect . . . . . . . . . . . . . . . . . . . . . . . . . . . . . . . . . . . . . . . . . . . . . . . . . . . . . . . . . . . . . . . . . . . . 1.5.1 The open and occluded ear responses . . . . . . . . . . . . . . . . . . . . . . . . . . . . . . . . . . . . . . 1.5.2 Attenuation and acceptance of commercially available hearing protection devices . . . . . . . . . . . . . . . . . . . . . . . . . . . . . . . . . . . . . . . . . . . . . . . . . . . . . . . . . . . . . . . . . . 1.5.2.1 Commercially available earplugs for musicians. . . . . . . . . . . . . . . . 1.5.2.2 Acceptance of commercially available earplugs for musicians 1.5.3 Loudness and its impact on the perceived attenuation . . . . . . . . . . . . . . . . . . . . . 1.5.3.1 Loudness of pure tones . . . . . . . . . . . . . . . . . . . . . . . . . . . . . . . . . . . . . . . . . . 1.5.3.2 Loudness of complex sounds. . . . . . . . . . . . . . . . . . . . . . . . . . . . . . . . . . . . 1.5.3.3 The impact of loudness and sound pressure level on music perception . . . . . . . . . . . . . . . . . . . . . . . . . . . . . . . . . . . . . . . . . . . . . . . . . . . . . . . . 1.6 Summary of the literature review . . . . . . . . . . . . . . . . . . . . . . . . . . . . . . . . . . . . . . . . . . . . . . . . . . . . . 1.6.1 Regarding the occlusion effect . . . . . . . . . . . . . . . . . . . . . . . . . . . . . . . . . . . . . . . . . . . . . . 1.6.2 Regarding the isolation effect . . . . . . . . . . . . . . . . . . . . . . . . . . . . . . . . . . . . . . . . . . . . . . .. 7 7 7 9 11 13 13 15 16 19 20 23 25 30 31 35 35 37 38 38 39 40 43 43 45 46 51 54 55 57 61 63 63 64.
(12) XII. CHAPTER 2 DEFINITION OF THE REQUIREMENTS OF THE SYSTEM . . . . . . . . . 2.1 Design Background . . . . . . . . . . . . . . . . . . . . . . . . . . . . . . . . . . . . . . . . . . . . . . . . . . . . . . . . . . . . . . . . . . . . 2.1.1 The SonoFit technology . . . . . . . . . . . . . . . . . . . . . . . . . . . . . . . . . . . . . . . . . . . . . . . . . . . . . 2.1.2 The Auditory Research Platform . . . . . . . . . . . . . . . . . . . . . . . . . . . . . . . . . . . . . . . . . . . 2.2 Requirements of the solution to occlusion effect . . . . . . . . . . . . . . . . . . . . . . . . . . . . . . . . . . . . . 2.2.1 Performance requirements . . . . . . . . . . . . . . . . . . . . . . . . . . . . . . . . . . . . . . . . . . . . . . . . . . 2.2.2 Controller requirements . . . . . . . . . . . . . . . . . . . . . . . . . . . . . . . . . . . . . . . . . . . . . . . . . . . . . 2.2.3 Plant’s requirements . . . . . . . . . . . . . . . . . . . . . . . . . . . . . . . . . . . . . . . . . . . . . . . . . . . . . . . . . 2.2.3.1 Physical interfaces to the ear . . . . . . . . . . . . . . . . . . . . . . . . . . . . . . . . . . . . 2.2.3.2 The internal loudspeaker and microphone components. . . . . . . . 2.2.3.3 Gain and phase margins requirements . . . . . . . . . . . . . . . . . . . . . . . . . . 2.3 Requirements of the solution to isolation effect . . . . . . . . . . . . . . . . . . . . . . . . . . . . . . . . . . . . . . 2.3.1 Uniform attenuation . . . . . . . . . . . . . . . . . . . . . . . . . . . . . . . . . . . . . . . . . . . . . . . . . . . . . . . . . 2.3.2 Variable attenuation . . . . . . . . . . . . . . . . . . . . . . . . . . . . . . . . . . . . . . . . . . . . . . . . . . . . . . . . . 2.3.3 Requirements of the loudness compensation solution . . . . . . . . . . . . . . . . . . . . .. 65 66 66 68 69 70 73 73 74 76 77 77 79 80 81. CHAPTER 3 A SOLUTION TO THE OCCLUSION EFFECT . . . . . . . . . . . . . . . . . . . . . . . . . 3.1 Proposed architecture and design . . . . . . . . . . . . . . . . . . . . . . . . . . . . . . . . . . . . . . . . . . . . . . . . . . . . . 3.1.1 Moldable-fit earpiece . . . . . . . . . . . . . . . . . . . . . . . . . . . . . . . . . . . . . . . . . . . . . . . . . . . . . . . . 3.1.2 Universal-fit earpiece . . . . . . . . . . . . . . . . . . . . . . . . . . . . . . . . . . . . . . . . . . . . . . . . . . . . . . . . 3.1.3 Design of the controller . . . . . . . . . . . . . . . . . . . . . . . . . . . . . . . . . . . . . . . . . . . . . . . . . . . . . 3.2 Implementation and experimental validation . . . . . . . . . . . . . . . . . . . . . . . . . . . . . . . . . . . . . . . . . 3.2.1 Implementation . . . . . . . . . . . . . . . . . . . . . . . . . . . . . . . . . . . . . . . . . . . . . . . . . . . . . . . . . . . . . . 3.2.2 Experimental validation using the moldable-fit earpiece . . . . . . . . . . . . . . . . . . 3.2.3 Experimental validation using the universal-fit earpiece . . . . . . . . . . . . . . . . . . 3.3 Discussion regarding the solution to occlusion effect . . . . . . . . . . . . . . . . . . . . . . . . . . . . . . . .. 83 83 84 86 88 91 91 93 95 97. CHAPTER 4 A SOLUTION TO THE ISOLATION EFFECT. . . . . . . . . . . . . . . . . . . . . . . . . . . 4.1 Proposed architecture and modelling of components . . . . . . . . . . . . . . . . . . . . . . . . . . . . . . . . 4.1.1 The electro-acoustic path . . . . . . . . . . . . . . . . . . . . . . . . . . . . . . . . . . . . . . . . . . . . . . . . . . . . 4.1.1.1 External microphone . . . . . . . . . . . . . . . . . . . . . . . . . . . . . . . . . . . . . . . . . . . . 4.1.1.2 Digital signal processor . . . . . . . . . . . . . . . . . . . . . . . . . . . . . . . . . . . . . . . . . 4.1.1.3 Playback. . . . . . . . . . . . . . . . . . . . . . . . . . . . . . . . . . . . . . . . . . . . . . . . . . . . . . . . . . 4.1.1.4 Occluded ear canal. . . . . . . . . . . . . . . . . . . . . . . . . . . . . . . . . . . . . . . . . . . . . . . 4.1.1.5 Validation of the electro-acoustic path model . . . . . . . . . . . . . . . . . . 4.1.2 The attenuation path . . . . . . . . . . . . . . . . . . . . . . . . . . . . . . . . . . . . . . . . . . . . . . . . . . . . . . . . . 4.1.2.1 Passive attenuation. . . . . . . . . . . . . . . . . . . . . . . . . . . . . . . . . . . . . . . . . . . . . . . 4.1.2.2 Active attenuation . . . . . . . . . . . . . . . . . . . . . . . . . . . . . . . . . . . . . . . . . . . . . . . 4.2 Development of the algorithms and preliminary validation . . . . . . . . . . . . . . . . . . . . . . . . . 4.2.1 Uniform magnitude transfer function compensation. . . . . . . . . . . . . . . . . . . . . . . 4.2.2 Open ear correction . . . . . . . . . . . . . . . . . . . . . . . . . . . . . . . . . . . . . . . . . . . . . . . . . . . . . . . . . . 4.2.3 Variable gain and combination correction . . . . . . . . . . . . . . . . . . . . . . . . . . . . . . . . . . 4.2.4 Preliminary experimental validation . . . . . . . . . . . . . . . . . . . . . . . . . . . . . . . . . . . . . . . . 4.2.5 Loudness compensation . . . . . . . . . . . . . . . . . . . . . . . . . . . . . . . . . . . . . . . . . . . . . . . . . . . . .. 101 101 104 104 105 105 108 108 110 111 111 113 115 115 116 118 119.
(13) XIII. 4.3 4.4. Isolation effect compensation system in conjunction with the active occlusion effect reduction system . . . . . . . . . . . . . . . . . . . . . . . . . . . . . . . . . . . . . . . . . . . . . . . . . . . . . . . . . . . . . . . . 122 Discussion regarding the solution to isolation effect . . . . . . . . . . . . . . . . . . . . . . . . . . . . . . . . . 126. CONCLUSIONS . . . . . . . . . . . . . . . . . . . . . . . . . . . . . . . . . . . . . . . . . . . . . . . . . . . . . . . . . . . . . . . . . . . . . . . . . . . . . . . 129 APPENDIX I. VARIABILITY OF PLANT RESPONSE BETWEEN INSERTIONS . . . 133. APPENDIX II. SYSTEM IDENTIFICATION PROCEDURE . . . . . . . . . . . . . . . . . . . . . . . . . . . . . 135. APPENDIX III CONTROLLER CIRCUITS . . . . . . . . . . . . . . . . . . . . . . . . . . . . . . . . . . . . . . . . . . . . . . . . 137 APPENDIX IV LOUDNESS COMPENSATION SCRIPT . . . . . . . . . . . . . . . . . . . . . . . . . . . . . . . . . 143 APPENDIX V PICTURES . . . . . . . . . . . . . . . . . . . . . . . . . . . . . . . . . . . . . . . . . . . . . . . . . . . . . . . . . . . . . . . . . . 145 APPENDIX VI PUBLICATIONS . . . . . . . . . . . . . . . . . . . . . . . . . . . . . . . . . . . . . . . . . . . . . . . . . . . . . . . . . . . . 151 REFERENCES . . . . . . . . . . . . . . . . . . . . . . . . . . . . . . . . . . . . . . . . . . . . . . . . . . . . . . . . . . . . . . . . . . . . . . . . . . . . . . . . . 165 BIBLIOGRAPHY . . . . . . . . . . . . . . . . . . . . . . . . . . . . . . . . . . . . . . . . . . . . . . . . . . . . . . . . . . . . . . . . . . . . . . . . . . . . . . 165.
(14)
(15) LIST OF TABLES. Page Table 1.1. Comparison of occlusion effect for shallow and deep insertion . . . . . . . . . . . . . . . 16. Table 1.2. Distribution of negative sensations reported by musicians while using the HiFi ER-20 hearing protector . . . . . . . . . . . . . . . . . . . . . . . . . . . . . . . . . . . . . . . . . 53. Table 2.1. Defining the required performances of the occlusion effect reduction system. . . . . . . . . . . . . . . . . . . . . . . . . . . . . . . . . . . . . . . . . . . . . . . . . . . . . . . . . . . . . . . . . . . . . . . . . . . . . 71. Table 2.2. Minimum and maximum performance requirements of the OER system to be designed, in target reduction of ear canal SPL caused by OE . . . . . . . . . . . . . . . . . . . . . . . . . . . . . . . . . . . . . . . . . . . . . . . . . . . . . . . . . . . . . . . . . . . . . . . . . . . . . 72. Table 3.1. Summary of the performances of the two prototypes of active occlusion effect reduction. . . . . . . . . . . . . . . . . . . . . . . . . . . . . . . . . . . . . . . . . . . . . . . . . . . . . . . . 97. Table 3.2. Estimated residual occlusion effect with the universal-fit prototype compared with shallow and deep insertion devices. . . . . . . . . . . . . . . . . . . . . . . . . . . . . 98.
(16)
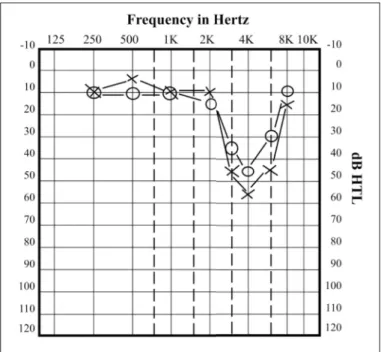
(17) LIST OF FIGURES. Page Figure 1.1. Audiogram showing a severe music-induced or noise-induced hearing loss. . . . . . . . . . . . . . . . . . . . . . . . . . . . . . . . . . . . . . . . . . . . . . . . . . . . . . . . . . . . . . . . . . . . . . . 8. Figure 1.2. Cause of the occlusion effect . . . . . . . . . . . . . . . . . . . . . . . . . . . . . . . . . . . . . . . . . . . . . . . . . . . 14. Figure 1.3. Sound pressure level in an unoccluded ear canal and an occluded ear canal when a subject is vocalizing /i/ . . . . . . . . . . . . . . . . . . . . . . . . . . . . . . . . . . . . . . 14. Figure 1.4. Pathways from a source to the inner ear . . . . . . . . . . . . . . . . . . . . . . . . . . . . . . . . . . . . . . . 15. Figure 1.5. Relative occlusion effect per occluded volume based on the type and fit of hearing protectors . . . . . . . . . . . . . . . . . . . . . . . . . . . . . . . . . . . . . . . . . . . . . . . . . . . . 18. Figure 1.6. Active control of the occlusion effect using an internal microphone, a controller to process the sound into an anti-sound and a speaker to sum the anti-sound to the sound, tending to silence . . . . . . . . . . . . . . . . . . . . . . . . 18. Figure 1.7. Physical block diagram of a feedback control system for the suppression of an acoustic disturbance . . . . . . . . . . . . . . . . . . . . . . . . . . . . . . . . . . . . . . . . 20. Figure 1.8. Block diagram of a feedback control system having a servo action . . . . . . . . . . 22. Figure 1.9. Nyquist plot of an open-loop frequency response . . . . . . . . . . . . . . . . . . . . . . . . . . . . . 25. Figure 1.10. A simple lag analog compensator . . . . . . . . . . . . . . . . . . . . . . . . . . . . . . . . . . . . . . . . . . . . . . 26. Figure 1.11. Block diagram of a feedback control system with a discrete-time controller, with emphasis on the disturbance rejection ability of the system . . . . . . . . . . . . . . . . . . . . . . . . . . . . . . . . . . . . . . . . . . . . . . . . . . . . . . . . . . . . . . . . . . . . . . . . . . . 27. Figure 1.12. Effect of delay on the performance of a feedback ANC . . . . . . . . . . . . . . . . . . . . . . 28. Figure 1.13. Complete dynamic model of deep insertion ANR earplug obtained by cascading four-pole network matrices representing each part of the system . . . . . . . . . . . . . . . . . . . . . . . . . . . . . . . . . . . . . . . . . . . . . . . . . . . . . . . . . . . . . . . . . . . . . . . 31. Figure 1.14. Magnitude of the closed loop response for the feedback control system for different occluded space volumes. . . . . . . . . . . . . . . . . . . . . . . . . . . . . . . . . . 33. Figure 1.15. Magnitude of the closed loop response for the feedback control system for different occluded eardrum impedances . . . . . . . . . . . . . . . . . . . . . . . . . . . 33.
(18) XVIII. Figure 1.16. Simulated magnitude of the pressure frequency response at the error microphone location for different ears . . . . . . . . . . . . . . . . . . . . . . . . . . . . . . . . . . . 34. Figure 1.17. Measured magnitude of the pressure frequency response at the error microphone location for different combination of ear canal sizes and eardrum impedance . . . . . . . . . . . . . . . . . . . . . . . . . . . . . . . . . . . . . . . . . . . . . . . . . . 34. Figure 1.18. Components of a moving-coil loudspeaker . . . . . . . . . . . . . . . . . . . . . . . . . . . . . . . . . . . . 36. Figure 1.19. Balanced armature driver components . . . . . . . . . . . . . . . . . . . . . . . . . . . . . . . . . . . . . . . . . 38. Figure 1.20. Equivalent circuit schematic for a three-lead electret microphone capsule. . . . . . . . . . . . . . . . . . . . . . . . . . . . . . . . . . . . . . . . . . . . . . . . . . . . . . . . . . . . . . . . . . . . . . . . . . . 40. Figure 1.21. The natural amplification of the outer ear, primarily caused by the ear canal resonance and the pinna effect . . . . . . . . . . . . . . . . . . . . . . . . . . . . . . . . . . . . . . . 44. Figure 1.22. Bone-conduction limits to HPD attenuation and an example of the attenuation provided by an earplug, an earmuff, and the two devices worn together. . . . . . . . . . . . . . . . . . . . . . . . . . . . . . . . . . . . . . . . . . . . . . . . . . . . . . . . . . . 46. Figure 1.23. Construction of the ER-15 earplug . . . . . . . . . . . . . . . . . . . . . . . . . . . . . . . . . . . . . . . . . . . . . 47. Figure 1.24. Expected eardrum SPL when the ear is open and when it is occluded with the ER-15 for three scenarios . . . . . . . . . . . . . . . . . . . . . . . . . . . . . . . . . . 48. Figure 1.25. Cross-sectional view of a ER-20 earplug . . . . . . . . . . . . . . . . . . . . . . . . . . . . . . . . . . . . . . 50. Figure 1.26. Attenuation of the ER-20 compared to foam E-A-R plugs for shallow and deep insertion . . . . . . . . . . . . . . . . . . . . . . . . . . . . . . . . . . . . . . . . . . . . . . . . . . . . . 50. Figure 1.27. Mean and standard deviation of the attenuation of the ER-15 earplugs obtained in a sound field and via headphones as well as the manufacturer’s specification obtained with an artificial head. . . . . . . . . . . . . 52. Figure 1.28. Equal loudness contours according to ISO226:2003 . . . . . . . . . . . . . . . . . . . . . . . . . . 56. Figure 1.29. Shape of the auditory filter centered at 1 kHz, plotted for input sound levels ranging from 20 to 90 dB(SPL)/ERB as a function of frequency . . . . . . . . . . . . . . . . . . . . . . . . . . . . . . . . . . . . . . . . . . . . . . . . . . . . . . . . . . . . . . . . . . . . . . . . 59. Figure 1.30. Example of deriving an excitation pattern from auditory filter shapes, for a tone at 1 kHz . . . . . . . . . . . . . . . . . . . . . . . . . . . . . . . . . . . . . . . . . . . . . . . . . . . . . 60. Figure 1.31. Curves relating specific loudness to excitation level . . . . . . . . . . . . . . . . . . . . . . . . . . 60.
(19) XIX. Figure 1.32. Example of frequency equalization performed by a loudness control on a home audio system, depending on the volume setting . . . . . . . . . . 62. Figure 2.1. The SonoFit technology . . . . . . . . . . . . . . . . . . . . . . . . . . . . . . . . . . . . . . . . . . . . . . . . . . . . . . . . 67. Figure 2.2. Parts composing the Sonomax V4 earpiece: a) Ready for custom moulding V4 earpiece; b) parts of the earpiece without inflating skin . . . . . . . . . . . . . . . . . . . . . . . . . . . . . . . . . . . . . . . . . . . . . . . . . . . . . . . . . . . . . . . . . . . . . . . . . . . . . . 67. Figure 2.3. Block diagram of the concept of the Auditory Research Platform; a belt pack providing signal processing capabilities is connected to earpieces containing transducers . . . . . . . . . . . . . . . . . . . . . . . . . . . . . . . . . . . . . . . . . . . . . . . 68. Figure 2.4. Providing uniform attenuation through the use of an active HPD . . . . . . . . . . . . 79. Figure 3.1. Architecture of the proposed system for active occlusion effect reduction . . . . . . . . . . . . . . . . . . . . . . . . . . . . . . . . . . . . . . . . . . . . . . . . . . . . . . . . . . . . . . . . . . . . . . . . 84. Figure 3.2. Top, side, and cross-sectional view of the moldable-fit earpiece, showing the internal loudspeaker and microphone assembly . . . . . . . . . . . . . . . . . 85. Figure 3.3. Frequency response of the moldable-fit plant in a human ear canal . . . . . . . . . . 85. Figure 3.4. Cross-sectional view of the universal-fit earpiece . . . . . . . . . . . . . . . . . . . . . . . . . . . . . 86. Figure 3.5. Frequency responses of the universal-fit plant in a human ear canal, with and without porous material . . . . . . . . . . . . . . . . . . . . . . . . . . . . . . . . . . . . . . . . . . . . . . 87. Figure 3.6. Comparison of the frequency responses of the two plants . . . . . . . . . . . . . . . . . . . . 87. Figure 3.7. Frequency response of the two lead-lag compensators, the complete compensator, and the moldable-fit plant . . . . . . . . . . . . . . . . . . . . . . . . . . . . 89. Figure 3.8. Frequency response of the uncompensated moldable-fit plant, the compensator, and the compensated moldable-fit plant . . . . . . . . . . . . . . . . . . . . . . . . 89. Figure 3.9. Nyquist diagram of the compensated moldable-fit plant by design . . . . . . . . . . 90. Figure 3.10. Expected active occlusion effect reduction of the moldable-fit prototype by design . . . . . . . . . . . . . . . . . . . . . . . . . . . . . . . . . . . . . . . . . . . . . . . . . . . . . . . . . . . . . 90. Figure 3.11. Frequency response of the compensated moldable-fit plant from design and implementation . . . . . . . . . . . . . . . . . . . . . . . . . . . . . . . . . . . . . . . . . . . . . . . . . . . . . 91. Figure 3.12. Nyquist diagram of the compensated moldable-fit plant from design and implementation . . . . . . . . . . . . . . . . . . . . . . . . . . . . . . . . . . . . . . . . . . . . . . . . . . . . . 92.
(20) XX. Figure 3.13. Expected active occlusion effect reduction from design and implementation . . . . . . . . . . . . . . . . . . . . . . . . . . . . . . . . . . . . . . . . . . . . . . . . . . . . . . . . . . . . . . . . . 93. Figure 3.14. Transfer function between the sounds resulting from occlusion effect in the left and right ear canals for inactive earpieces . . . . . . . . . . . . . . . . . . . 94. Figure 3.15. Measured occlusion effect reduction; transfer function between the left and right ear canals, with and without correction, compared with the theoretical occlusion effect reduction by design and after implementation . . . . . . . . . . . . . . . . . . . . . . . . . . . . . . . . . . . . . . . . . . . . . . . . . . . . . . . . . . . . . . . . . 94. Figure 3.16. Passive attenuation and attenuation in active mode, obtained using narrow band audiometry on two human subjects. . . . . . . . . . . . . . . . . . . . . . . . . . . . . . 96. Figure 3.17. Measured active attenuation compared to theoretical performance by design . . . . . . . . . . . . . . . . . . . . . . . . . . . . . . . . . . . . . . . . . . . . . . . . . . . . . . . . . . . . . . . . . . . . . . . . 96. Figure 4.1. Architecture of the proposed system, incorporating both active control of the occlusion effect and the hardware for the isolation effect compensation. . . . . . . . . . . . . . . . . . . . . . . . . . . . . . . . . . . . . . . . . . . . . . . . . . . . . . . . . . . .102. Figure 4.2. Modified universal-fit earpiece including an external microphone . . . . . . . . . .102. Figure 4.3. Conceptual view of the isolation effect solution from a design perspective . . . . . . . . . . . . . . . . . . . . . . . . . . . . . . . . . . . . . . . . . . . . . . . . . . . . . . . . . . . . . . . . . . . . .103. Figure 4.4. External microphone model frequency response . . . . . . . . . . . . . . . . . . . . . . . . . . . . .105. Figure 4.5. Frequency response of the modeled input to output group delay caused by the DSP . . . . . . . . . . . . . . . . . . . . . . . . . . . . . . . . . . . . . . . . . . . . . . . . . . . . . . . . . . . . .106. Figure 4.6. Frequency response of the first playback model, the uncompensated plant . . . . . . . . . . . . . . . . . . . . . . . . . . . . . . . . . . . . . . . . . . . . . . . . . . . . . . . . . .107. Figure 4.7. Frequency response of the second playback model, the sensitivity function of the occlusion effect reduction system . . . . . . . . . . . . . . . . . . . . . . . . . . . .107. Figure 4.8. Measured transfer function and frequency response of the model of the occluded ear canal . . . . . . . . . . . . . . . . . . . . . . . . . . . . . . . . . . . . . . . . . . . . . . . . . . . . . .108. Figure 4.9. Differences between the model and the measure when using a reference microphone . . . . . . . . . . . . . . . . . . . . . . . . . . . . . . . . . . . . . . . . . . . . . . . . . . . . . . . . . .109. Figure 4.10. Accordance between the model and the measure when correcting for the external microphone frequency response . . . . . . . . . . . . . . . . . . . . . . . . . . . . .110.
(21) XXI. Figure 4.11. Measured and modeled frequency response of the passive attenuation. . . . . . . . . . . . . . . . . . . . . . . . . . . . . . . . . . . . . . . . . . . . . . . . . . . . . . . . . . . . . . . . . . . . . .111. Figure 4.12. Measured and modeled active attenuation . . . . . . . . . . . . . . . . . . . . . . . . . . . . . . . . . . . .112. Figure 4.13. Comparison of the attenuation path with and without active attenuation. . . . . . . . . . . . . . . . . . . . . . . . . . . . . . . . . . . . . . . . . . . . . . . . . . . . . . . . . . . . . . . . . . . . . .112. Figure 4.14. Compensation strategy and its explicit steps . . . . . . . . . . . . . . . . . . . . . . . . . . . . . . . . .114. Figure 4.15. Example of uniform magnitude transfer function compensation for electro-acoustic path with playback by the uncompensated plant . . . . . . . . . . .115. Figure 4.16. Example of an open ear canal correction . . . . . . . . . . . . . . . . . . . . . . . . . . . . . . . . . . . . .116. Figure 4.17. Example of obtaining a transfer function corresponding to a uniform attenuation of 15 dB within the constraints of the system. . . . . . . . . .117. Figure 4.18. Achievable transfer functions using the automatic combination correction compared with target transfer functions corresponding to attenuation values between 0 and 20 dB . . . . . . . . . . . . . . . . . . . . . . . . . . . . . . . . . . .118. Figure 4.19. Comparison of target, predicted, and measured overall transfer functions, corresponding to quasi-uniform attenuation values of 5, 10, 15 and 20 dB . . . . . . . . . . . . . . . . . . . . . . . . . . . . . . . . . . . . . . . . . . . . . . . . . . . . . . . . . . . . . . .119. Figure 4.20. Effect of uniformly reducing a sound from 90 dB(SPL) to 70 dB(SPL) on its perceived loudness as a function of frequency. . . . . . . . . . .120. Figure 4.21. Required SPL decrease to ellicit a constant 20 phons loudness decrease between two equal loudness curves of different level. . . . . . . . . . . . . .120. Figure 4.22. Required attenuation curves to achieve a perceived uniform attenuation in loudness derived from ISO226:2003 . . . . . . . . . . . . . . . . . . . . . . . . . .121. Figure 4.23. Comparison between target and achieved loudness corrections . . . . . . . . . . . . .122. Figure 4.24. Example of uniform magnitude transfer function compensation for the electro-acoustic path with playback by the complementary sensitivity function . . . . . . . . . . . . . . . . . . . . . . . . . . . . . . . . . . . . . . . . . . . . . . . . . . . . . . . . . . . . .122. Figure 4.25. Example of obtaining a transfer function corresponding to a uniform attenuation within the new constraints of the system . . . . . . . . . . . . . . .123. Figure 4.26. Example of obtaining a transfer function corresponding to a uniform attenuation within the new constraints of the system . . . . . . . . . . . . . . .124.
(22) XXII. Figure 4.27. Example of obtaining a transfer function corresponding to a perceived uniform attenuation between 0 and 25 phons within the new constraints of the system . . . . . . . . . . . . . . . . . . . . . . . . . . . . . . . . . . . . . . . . . . . . . . . . .125.
(23) LIST OF ABBREVIATIONS ADC. Analog to digital converter. ANC. Active noise control. ANR. Active noise reduction. AOER. Active occlusion effect reduction. ARP. Auditory Research Platform. ATF. Acoustic test fixture. BRAMS. International Laboratory for Brain, Music & Sound Research. CB. Critical bands. CIRMMT. Centre for Interdisciplinary Research in Music, Media and Technology. CRITIAS. Sonomax-ÉTS Industrial Research Chair in In-ear Technologies. DAC. Digital to analog converter. DC. Direct current. ECM. Electret condenser microphone. ERB. Equivalent rectangular bandwidth. ETS. École de Technologie Supérieure. FET. Field effect transistor. FIR. Finite impulse response. GM. Gain margin. HPD. Hearing protection device. HTL. Hearing threshold level.
(24) XXIV. IC. Integrated chip. IEM. Inner-ear microphone. IIR. Infinite impulse response. ILS. Internal loudspeaker. ISO. International Standard Organization. MEMS. Micro-electro-mechanical system. MIHL. Music-induced hearing loss. NIHL. Noise-induced hearing loss. NIOSH. National Institute for Occupational Safety and Health. OE. Occlusion effect. OEM. Outer-ear microphone. OER. Occlusion effect reduction. OSHA. Occupational Safety and Health Administration. PEL. Permissible exposure limit. PM. Phase margin. REAT. Real-ear attenuation at threshold. REL. Recommended exposure limit. ROE. Residual occlusion effect. SNR. Signal to noise ratio. SPL. Sound pressure level. WHO. World Health Organization.
(25) LIST OF SYMBOLS dB. deciBel. dB(A). A-weighted deciBel. dB(HTL). deciBel of hearing threshold level. dB(SPL). deciBel of sound pressure level. R. Resistance. L. Inductance. C. Capacitance. Leq. Equivalent sound level. j. Imaginary unit. ω. Frequency in rad/s. ζ. Damping factor. 1/gc. The gain that drives a closed loop system into instability. φc. The phase shift that drives a closed loop system into instability. ∞. Infinity. Z. z-transform. L−1. Inverse Laplace transform.
(26)
(27) INTRODUCTION. Musicians are noise-exposed workers who heavily rely on their auditory sense and should protect it by wearing hearing protectors. However, many musicians do not protect their hearing because they find that the use of hearing protectors is detrimental to their performance, as they cause perceptual discomfort. This master’s project presents the concept of a new active hearing protection device (HPD), an earplug for musicians that aims at solving the perceptual discomfort associated with HPDs to enable musicians to protect their hearing. This introduction defines the problem, states the objectives and exposes the methodology of this master’s thesis. Problem statement Professional musicians are exposed to high levels of sound and should protect their hearing to avoid permanent hearing loss that could compromise their career. Since high sound pressure levels are often required by a musician’s work, the logical solution would be to wear HPDs when required. However, perceptual discomfort associated with wearing HPDs can discourage musicians from using them. This perceptual discomfort is assumed to be caused by two detrimental effects: the occlusion effect and the isolation effect. The occlusion effect is often reported as an augmented, unnatural and annoying perception of one’s own voice when wearing HPDs. It affects all musicians whose instrument induces vibrations to the skull, including singers and musicians whose instrument is pressed against any part of the head, such as a trumpet or violin. The isolation effect is defined, in this work, as the unnatural sensation of being isolated from a given sound environment. It can be caused by wearing HPDs that do not compensate for psychoacoustical factors and therefore modify the wearer’s auditory perception. To the author’s knowledge, the exact underlying factors that cause one to feel isolated from its sound environment when wearing HPDs have not been exhaustively exposed..
(28) 2. The isolation and occlusion effects are highly unfavorable to the musicians’ auditory perception and compromise their capacity to perform to the best of their abilities for their audience. The isolation effect can make it difficult for musicians to judge the sound quality that is being presented to their audience. When, as a consequence of the occlusion effect, an augmented and unnatural perception of one’s own voice or instrument is predominantly what is heard, musicians cannot hear the subtle cues that they depend on to adjust their playing. Cues such as knowing how their timbre blends with their colleague’s or how loudly their instrument sounds and resonates in a given space can potentially make a big difference in one’s performance. These adverse effects are causing some musicians to decide not to wear HPDs. Solutions to these effects have been proposed in the past. The occlusion effect can be partially addressed by the use of deep insertion earplugs, but this solution causes problems of physical comfort and seems insufficient according to musicians’ complaints. The isolation effect can be partially addressed by the use of specialized hearing protection devices, but surveying professional musicians reveals recurring complaints of feeling isolated from their sound environment. Objectives The general objective of this master’s project is to define the characteristics of an earplug that has the least possible negative impact on a wearer’s auditory perception. From the hypothesis that the occlusion effect and the isolation effect cause musicians to decide not to wear HPDs, in regard to the general objective, the following specific objectives are derived:. 1. Design a method for a system that minimizes the adverse impact of the occlusion effect; 2. Identify the main psychoacoustical factors that can cause the isolation effect when wearing HPDs; 3. Design a method for a system that minimizes the adverse impact of the isolation effect;.
(29) 3. 4. Investigate the implementation of an electro-acoustic system incorporating the above solutions and allowing further characterization of the occlusion effect and isolation effect experienced by musicians.. Methodology The methodology of this work starts with a brief review of studies on musicians’ hearing loss, exposure to sound, usage rate of currently available hearing protectors and complaints about the perceptual discomfort that they cause. The purpose of this introductory literature review is to factually expose the motivations behind this work and confirm the preponderance of the occlusion and isolation effects. The occlusion effect is characterized through a literature review that includes a comparison of established solutions as well as a novel approach to solving this effect. This novel approach, inear active noise control of the occlusion effect, is reviewed in-depth. The gathered information is used to define the requirements of a system that would minimize the adverse impact of the occlusion effect without compromising physical comfort, like the traditional deep insertion solution. An electro-acoustic system that would solve this effect is designed according to these requirements, fulfilling objective 1. Regarding the isolation effect, a literature review serves to identify the main psychoacoustical factors that can cause this detrimental effect. The reason for such a review is to fulfill objective 2, an important objective since the causes behind the isolation effect have not been exhaustively defined before, to the author’s knowledge. The review on the isolation effect includes the study of established solutions to the isolation effect and their acceptance by musicians. The gathered information is used to define the requirements of a system that would minimize the adverse impact of the isolation effect. An electro-acoustic system that would solve this effect is designed according to these requirements, fulfilling objective 3. Both systems are implemented separately while ensuring their flexibility and compatibility with each other, and are validated objectively, fulfilling objective 4..
(30) 4. In summary, the methodology outlined below is used, where elements consisting of a literature review have been regrouped:. 1. Perform a literature review of topics related to the objectives, specifically: a) the perceptual reasons reported by musicians for not wearing HPDs; b) the occlusion effect: i. the occlusion effect experienced by musicians and solutions that have been devised to reduce the occlusion effect; ii. the investigation of in-ear active noise control, a promising solution to the occlusion effect; c) the isolation effect: i. the psychoacoustical factors that are likely to cause the isolation effect; ii. the acceptance of established solutions to the isolation effect; 2. Define the requirements of a system to address and further characterize the occlusion effect and the isolation effect; 3. Design, implement, and validate objectively an electro-acoustic system to reduce the adverse impact of the occlusion effect; 4. Design, implement, and validate objectively an electro-acoustic system to reduce the adverse impact of the isolation effect.. The content of this master’s thesis very closely follows the methodology. Chapter 1 consists of a literature review and contains information that was used to identify the elements of the problem and the solution. Based on this information, the requirements and design choices of an active hearing protection device for musicians are presented in chapter 2. The design is presented in two parts: a solution to the occlusion effect, in chapter 3, and a solution to the isolation effect, in chapter 4. Conclusions are then presented and followed by proposed further research..
(31) 5. Contributions The original contributions of this work include the following:. 1. Several prototypes of a hearing protection device for musicians that provide solutions to the occlusion and isolation effects and that have been objectively validated; 2. The hardware, method and design required to answer further research questions, allow for further characterization of the occlusion effect and isolation effect experienced by musicians and improve the prototypes; 3. A significant contribution to the design and implementation of a reconfigurable hardware platform that facilitates in-ear research; 4. One invited presentation, Bernier and Voix (2011), one article in a periodical, Bernier and Voix (2013, article in press), and one article in conference proceedings with an invited presentation, Bernier and Voix (2013). The aforementioned articles are available in appendix VI..
(32)
(33) CHAPTER 1 LITERATURE REVIEW. Many different fields are involved in this master’s project and are studied in this literature review, divided in 5 sections. Section 1.1 explains the context of the problem, section 1.2 reviews the occlusion effect, section 1.3 reviews active noise control theory and practical concerns, section 1.4 reviews specific practical considerations for active noise reduction in the ear canal and section 1.5 surveys the literature about the isolation effect. Finally, section 1.6 summarizes the literature review. 1.1. Context of the problem. This section covers the context of the problem, reviewing music-induced hearing loss (1.1.1), the legislations and recommendations to prevent hearing loss and how musicians are at risk (1.1.2), and the current efficiency of commercially available HPDs in protecting the hearing of musicians (1.1.3). 1.1.1. Music-induced hearing loss. Noise-induced hearing loss (NIHL) is a condition that affects many workers, where exposure to noise is identified as the cause that led to the hearing loss. Likewise, music-induced hearing loss (MIHL) is a term that applies when the cause of the hearing loss is exposure to music. Chasin (2005, p.15) notes how similar their consequence is:. Hearing losses from a wide range of music and noise sources have similar audiometric patterns on a hearing test. The low-frequency sensitivity is either normal or near normal, whereas the hearing sensitivity in the 3000 Hz to 6000 Hz region is reduced. Yet, the hearing sensitivity of an individual to a 8000 Hz sound is much better, and like the lower frequencies can be normal or near normal..
(34) 8. An audiogram is a measure of one’s hearing sensitivity. Octave bands sounds can be used to measure one’s thresholds of hearing in deciBel (dB) of hearing threshold level (HTL). A low value in dB(HTL), either negative or null, indicates a superior or perfect hearing in reference to theoretical absolute threshold of audibility for human audition. A value of 30 dB(HTL) at a given frequency indicates that one has lost 30 dB of sensitivity at that frequency. Figure 1.1 shows the typical shape of an audiogram revealing severe noise-induced or music-induced hearing loss.. Figure 1.1 Audiogram showing a severe music-induced or noise-induced hearing loss, where a notch in sensitivity is apparent around 4 kHz (O = Left ear, X = Right Ear) Figure courtesy of Dr. Marshall Chasin. Used with permission.. Meanwhile, audiometric examination of professional musicians reveals notches in 25% of cases, according to Eaton and Gillis (2002), 52.5%, according to Royster et al. (1991), and up to 70% according to Fabiocchi (2010). Toole (2008, p. 436) claims that "no amount of experience can compensate for the inability to hear the lowest 20 or 40 dB of musical dynamics, timbral subtleties, distortions, and noises.".
(35) 9. 1.1.2. Legislation and recommendations regarding risk of hearing loss. Recommendations and legislation regarding occupational noise exposure have been issued around the world. Although different in their details, the different recommendations and legislation aim at limiting the cumulative sound exposure level that workers are subject to, during a full day of work, to be inferior to a hazardous sound exposure threshold, usually weighted in dB(A). On one hand, organisms such as the World Health Organization (WHO) or the National Institute for Occupational Safety and Health (NIOSH) define recommended exposure limits (REL) based on scientific studies relating hearing loss to the level and duration of noise exposures, according to Niquette (2012). The recommendations of WHO and NIOSH are different because their goal is different. WHO aims at defining recommendations that would protect all workers, while NIOSH aims at defining recommendations that would protect the majority of workers. Since some humans are more at risk than others because of genetic predisposition as well as other factors, following NIOSH’s recommendation does not guarantee that one will not develop NIHL. On the other hand, organisms such as the Occupational Safety and Health Organization (OSHA) enforce a legislation and define a permissible exposure limit (PEL) resulting from "debates and compromises that are part of enacting any legislation", according to Niquette (2012). Therefore, some legislations may not adequately protect a significant portion of worker. NIOSH defines the REL as the exposure to an equivalent sound level of 85 dB(A) for a duration of 8 hours, corresponding to a cumulative daily noise dose of 100%. The term "equivalent sound level" (Leq ) means that the variations in sound level over time are accounted for, using time averaging, and that the overall exposure is equivalent to the exposure to a steady sound of a given value, 85 dB(A) in this case. As the equivalent sound level increases, the recommended exposure duration decreases. NIOSH defines this time-intensity trade-off, called exchange rate, as 3 dB(A). For example, if the equivalent sound level increases by 3 dB(A), the recommended exposure duration halves. Exposure to an equivalent sound level of 88 dB(A) for 8 hours.
(36) 10. corresponds to a daily noise dose of 200%, and a daily noise dose of 100% for 4 hours. In most European countries and most of Canada’s provinces, the legislation is similar to the NIOSH recommendation. OSHA defines the PEL, by legislation, as the exposure to an equivalent sound level of 90 dB(A) during an 8-hour day for 5 days a week. An exchange rate of 5 dB is used: as the equivalent sound level increases by 5 dB(A), the allowed exposure duration halves. Exposure to an equivalent sound level of 95 dB(A) for 8 hours corresponds to a daily noise dose of 200%, and a daily noise dose of 100% for 4 hours. Professional musicians are noise exposed workers and the PEL and REL, although defined in an industrial context, should also apply to musicians. As opposed to typical steady industrial noises, music can vary greatly in intensity, over time. Many studies have aimed at characterizing the sound levels that musicians are exposed to. The literature review of Patel (2008) compiled the results of different researches and concluded that classical musicians are exposed to sound levels between 80 dB(A) and 110 dB(A), while rock/pop musicians are exposed to higher sound levels, between 88 dB(A) and 117 dB(A). These findings indicate that musicians can be routinely exposed to hazardous levels of sound. When exposed to these levels, the allowed safe exposure duration can very well be below the duration of a normal concert. For example, an equivalent sound level of 100 dB(A) is allowed for 2 hours by the Occupational Safety and Health Association (OSHA) legislation and recommended for less than 15 minutes by the National Institute for Occupational Safety and Health (NIOSH). While concerts are potentially the main source of sound exposure for musicians, hazardous sound exposure is also likely during practice. Hagberg et al. (2005) found a correlation between the amount of practice hours and hearing disorder when surveying 407 former music students: "There was a 1.75 times higher incidence [...] of impaired hearing for musicians with more than 20 h practicing per week before onset of symptoms." Additionally, O’Brien et al. (2013) found that 53% of musicians in their study group would exceed recommended exposure levels in their solitary practices alone, without even considering group rehearsal and performances..
(37) 11. The sound exposure that a marching band composed of music students is subjected to during a performance was measured using dosimeters configured to OSHA’s and NIOSH’s criteria by Miller et al. (2007): "The daily noise dose values using the OSHA criteria ranged from approximately 200 to 700%, while the values using the NIOSH criteria varied from approximately 1600 to 17000%. The significantly higher noise dose values obtained using the NIOSH criteria were expected due to the different criterion levels and exchange rates used by the two methods." The sound pressure level and exposure duration to which professional musicians are exposed as part of their duties indicate that professional musicians are noise exposed workers and should therefore take necessary measures to protect their hearing. 1.1.3. Efficiency of commercially available hearing protection devices. Although specialized HPDs have benefited several musicians, many studies show that professional classical musicians generally do not use hearing protection devices. In France, out of 190 professional classical musicians surveyed by Richoux et al. (1998), none used hearing protection devices while 47% reported suffering from symptoms associated to sound overexposure. Similar populations were surveyed in other European countries, and the use of HPDs was found to be 6% in Finland, 15% in Denmark and about 10% in Germany, as reported by Huttunen et al. (2013). The highest usage rate of the studied populations was in the Netherlands, with 52% of the musicians reporting using HPDs in rehearsal, but only 29% using them in concerts. HPDs seem to be generally more accepted in amplified music, although musicians still find problems with them. Santoni and Fiorini (2010) studied the acceptance of pre-molded musicians earplugs in a Brazilian population of contemporary musicians that were trained with their use, and asked to try them for a period of 3 months. Although general satisfaction towards the earplug was reported by 73.4% of the population, 43.5% reported they disagreed, or strongly disagreed, with using earplugs when performing in shows. Only 4.3% of musicians.
(38) 12. reported having no negative sensation from wearing the HPD, and "dampened voice" was the most reported negative sensation, with an occurrence of 43%. Patel (2008), Fabiocchi (2010), Santoni and Fiorini (2010) and Huttunen et al. (2013) inquired as to musicians’ reasons for not using HPDs, including specialized ones. Here are some of the most prevalent reasons given by musicians as to why they do not wear HPDs:. 1. They hinder the musician’s performance; 2. They prevent musicians from hearing their colleagues playing; 3. They block out timbre, nuances and dynamics information; 4. They cause communication difficulties; 5. They modify the perception of a musician’s own instrument; 6. They protect from loud sounds but that means not being able to hear soft sounds; 7. They are uncomfortable to wear.. All these reasons except comfort indicate a perception shift caused by HPDs. They can be regrouped into two categories. First, modified perception due to the occlusion effect: a musician playing an instrument mechanically coupled to his head while wearing HPDs will hear himself differently. Second, modified perception due to the isolation effect: HPDs reduce the acuteness and reliability of a musician’s auditory perception and causes one to feel isolated from his environment. Ultimately, both the occlusion effect and the isolation effect can hinder a musician’s performance..
(39) 13. 1.2. The occlusion effect. This section presents the causes and characteristics of the occlusion effect (1.2.1), how the occlusion effect is measured (1.2.2), and a review of solutions to occlusion effect (1.2.3). 1.2.1. Characteristics of the occlusion effect. The occlusion effect (OE) is often reported as an unnatural and annoying perception of one’s own voice when wearing HPDs. It will affect all musicians whose instrument induces vibrations to the skull, including singers and musicians whose instrument is pressed against any part of the head, such as a trumpet or violin. Although there is a direct solid borne sound path to the cochlea, it is generally accepted that the main objective occlusion effect is due to the existence of another solid borne sound path that ultimately reaches the cochlea by sound generation due to the vibrations of the ear canal walls that cause pressure fluctuations in the air contained in the ear canal. When the ear canal is unoccluded, less energy is transferred to the ear canal by bone conduction as the ear canal has an open-end, hence a lower acoustic impedance, and what is heard is predominantly the sound wave arriving from the air conduction path between the source (e.g. vocal tract) and the ear. However, when the ear canal is occluded, the walls have a strong coupling with the cavity and thus the ear canal sound level is greater and is picked up by the auditory system while the air conduction path is blocked, so what is heard is predominantly the sound wave traveling by bone conduction. Since this effect is more pronounced at low frequencies, below 1000 Hz, the result is an augmented and unnaturally "boomy" perception of one’s own voice. Figure 1.2 illustrates how the occlusion effect occurs. It is apparent from figure 1.3 that the sound pressure level (SPL) increase caused by occlusion effect occurs in the lower frequencies of the speech bandwidth, as measured by Killion (1988). Killion (1988) states that SPL in the occluded ear canal when one is speaking typically amounts to 90 to 100 dB(SPL), and that the occlusion effect results in an amplification of the low frequencies of the talker’s own voice by sometimes 20 to 30 dB. Kuk et al. (2005) reported a sound pressure increase caused by occlusion effect between 10 and 27 dB for the self-vocalization of /i/, with most of the energy below 800 Hz, and the energy peak around 300 Hz on average..
(40) 14. Unfortunately, to the author’s knowledge, no extensive measurement of sound pressure level increase in relation to the occlusion effect has been conducted on musicians.. Figure 1.2 Cause of the occlusion effect: a) the air conduction path prevails; b) the bone conduction path prevails, leading to an unnatural and augmented perception of one’s own voice. Figure 1.3 Sound pressure level in an unoccluded ear canal and an occluded ear canal when a subject is vocalizing /i/ Adapted with permission from Killion (1988).
(41) 15. 1.2.2. Measuring the occlusion effect. In the literature, the occlusion effect is not measured in SPL by audiologists. It is defined by Henry and Letowski (2007, p.70, 72) as an "increase in the loudness of a bone-conducted sound because of the closing of the ear canal by an earphone, earplug, or other object [...] The physical measure of the occlusion effect does nothing to indicate the degree to which the occlusion can be adversely experienced by the listener." The objective occlusion effect is thus measured by obtaining the difference between hearing threshold values of bone conducted sound when the ear is occluded and when it is open. Figure 1.4 accurately indicates the different pathways from a given source to the inner ear, showing that body or bone conduction can bypass the ear canal, and how the excitation from a forehead bone vibrator, the vocal cords, turbulences or a mouth speaker travels to the inner ear.. Figure 1.4 Pathways from a source to the inner ear Reproduced with permission from Le Cocq et al. (2010). Attempts to characterize the relationship between the increase in SPL in the ear canal caused by occlusion effect and the occlusion effect in hearing thresholds difference were notably performed by Goldstein and Hayes (1965), Fagelson and Martin (1998) and Reinfeldt et al. (2013). In all studies, a positive correlation is found between the two measures, but the relationship is not unity, and the placement of the bone vibrator is one of the factors that greatly affects the results. Goldstein and Hayes (1965) generally measured greater SPL than hearing threshold.
(42) 16. OE below 1 kHz, Fagelson and Martin (1998) measured less SPL than hearing threshold OE at 250 Hz, and Reinfeldt et al. (2013) generally measured more SPL than hearing threshold OE at 250 Hz and opposing tendencies at 500 Hz and 1 kHz depending on the bone vibrator placement. The large standard deviations obtained by Reinfeldt et al. (2013) indicate that some individuals exhibited an opposing tendency when compared to the average relationship between SPL in the ear canal and hearing threshold occlusion effect. Hence, though the magnitudes of the objective occlusion effect in SPL and the occlusion effect in hearing thresholds difference are strongly correlated, their relationship is not obvious to characterize mathematically. Typically, the occlusion effect is measured at 250 Hz and 500 Hz, that is, the range where it is perceived the most, and is generally higher at 250 Hz than at 500 Hz. High sound pressure levels below 200 Hz are less perceived because the human ear has a low sensitivity below this point, according to Henry and Letowski (2007). Henry and Letowski (2007, p.72) state that the occlusion effect "is considered negligible if it is less than 10 dB, mild to moderate when it is between 10 and 20 dB, and severe when it is larger than 20 dB." The magnitude of the occlusion effect depends on the insertion depth of the occluding device, as discussed in section 1.2.3. Dean and Martin (2000) measured the OE for a shallow insertion and a deep insertion of the same earphone. Their findings are compared in table 1.1.. Table 1.1 Comparison of occlusion effect for shallow and deep insertion as measured by Dean and Martin (2000) Frequency (Hz) 250 500 1000. 1.2.3. Occlusion effect (dB) Shallow Insertion Deep Insertion 17 9 14 8 6 -1. Solutions to the occlusion effect. Several types of solutions to the occlusion effect are found in the literature and can yield good results depending on the situation..
(43) 17. First, inserting the occluding device deeply in the ear canal can reduce the occlusion effect, as could be deduced from table 1.1. The magnitude of the increased SPL caused by occlusion effect depends on the remaining volume of the occluded canal, as shown in figure 1.5. Deep insertion tends to reduce the occlusion effect, but is likely to render uncomfortable the actions of speaking, singing, or any action involving mandibular movement since this movement affects the shape of the ear canal. The magnitude of ear canal deformation caused by mandibular movement has been shown to be approximately between 0.2 mm and 2.3 mm, according to Darkner et al. (2007), so inserting a device that restricts this deformation can be uncomfortable. On the other hand, earmuffs leaving a large volume in their cup also reduce the occlusion effect, but are bulky and more severely impede localization. Second, drilling a small hole through the occluding device will significantly decrease the occlusion effect, as studied by Kuk et al. (2005). While this method is often applied to hearing aids, hearing protection devices that use such a vent do not offer uniform attenuation, and the method is equivalent to introducing a leak, limiting the achievable attenuation at low frequencies. Third, the wearer might get accustomed to the occlusion effect, an approach that was listed by Killion (1988) in the context of hearing aids. However, this solution does not seem effective in the context of musician’s HPDs. According to Laitinen and Poulsen (2008), the occlusion effect has been found to cause 43% of musicians of a study group to stop wearing hearing protection. The effect has been reported as annoying by 20% of respondents and very annoying by 50% of them. Therefore, it seems that there is a strong tendency to stop using HPDs when the occlusion effect is a problem, rather than becoming accustomed to it. Fourth, the SPL in the ear canal caused by occlusion effect can be reduced by active noise control. This method seems promising in the case of musicians. The idea is to cancel the sound present in the ear canal by acquiring that sound with an in-ear microphone and processing the sound into an anti-sound to be played by a loudspeaker inside the ear canal, as shown in figure 1.6. The sum of the sound and anti-sound tends to silence. This method has been demonstrated by Mejia et al. (2008) to be a promising solution, at least for speech. A prototype was tested.
(44) 18. on 12 subjects, measuring a peak reduction of the SPL caused by occlusion effect of 15 dB on average, at 300 Hz.. Figure 1.5. Relative occlusion effect per occluded volume based on the type and fit of hearing protectors Reproduced with permission from Berger (2003). Figure 1.6 Active control of the occlusion effect using an internal microphone, a controller to process the sound into an anti-sound and a speaker to sum the anti-sound to the sound, tending to silence.
(45) 19. 1.3. Active noise control. Kuo and Morgan (1999) explain the basic principle of active noise control (ANC) as follows:. Active noise control involves an electroacoustic or electromechanical system that cancels the primary (unwanted) noise based on the principle of superposition; specifically, an antinoise of equal amplitude and opposite phase is generated and combined with the primary noise, thus resulting in the cancellation of both noises. The ANC system efficiently attenuates low-frequency noise where passive methods are either very expensive or bulky.. There are two main types of ANC: feedforward and feedback. The feedforward ANC uses an upstream reference microphone to acquire the signal to be canceled, thus gaining advanced information on the noise to be canceled before it reaches the point where its cancellation is desired. Adaptive feedforward ANCs usually use a digital controller to compute the anti-noise, and if the reference microphone is upstream enough, the propagation time to the cancellation point can be used to perform calculations to obtain a suitable anti-noise. Adaptive feedforward controllers use a second microphone at the point where cancellation is desired to verify how well the noise is being canceled. This information serves to adapt calculation on the anti-noise to maximize cancellation. Feedforward controllers are usually efficient and stable, and are used whenever the reference signal is available. In some cases, however, the reference signal cannot be acquired beforehand, most likely because it is too close to the cancellation point and there is no or too little propagation time. In that case, a feedback ANC can be used. A single microphone is used to acquire the signal to be canceled, and a loudspeaker close to the microphone plays an anti-noise. A short response time is crucial in feedback ANC, and the ideal control should send the anti-noise instantaneously, otherwise its performance is compromised. If delay is present, the anti-noise and noise are not completely synced, and constructive interference can occur and even lead the feedback into instability..
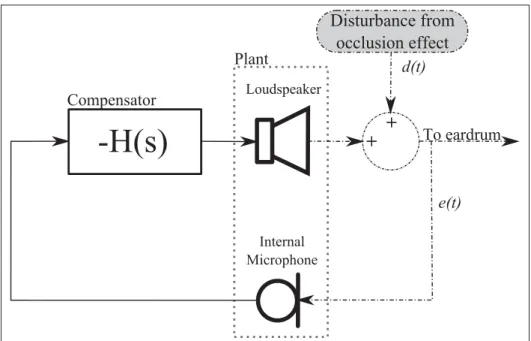
(46) 20. In the case of occlusion effect control, the reference signal is not easy to acquire in practice. A piezoelectric microphone on the throat of a singer or on an instrument could be used to provide advanced information on the signal, but would be in the way of a musician’s performance. Therefore, a feedback control strategy is more suitable to this application: a microphone inside the ear canal could pick up the sound resulting from the occlusion effect and a loudspeaker could play a suitable anti-sound. This section reviews the principle of feedback active noise control (1.3.1), its analog implementation (1.3.2) and its digital implementation (1.3.1). 1.3.1. Feedback active noise control. An equivalent block diagram of a feedback ANC is shown in figure 1.7. The loudspeaker and microphone assembly is called the plant, and the transfer function between the loudspeaker’s input and the microphone’s output, G(s), is the plant transfer function. The disturbance signal d(t) is the signal that must be canceled to obtain a zone of quiet and the error signal e(t) is the error, or residual signal. A controller H(s) acts explicitly as a negative feedback gain, feeding the plant with a command to produce a control signal, or anti-signal.. Figure 1.7 Physical block diagram of a feedback control system for the suppression of an acoustic disturbance (a) and its equivalent block diagram (b) Adapted with permission from Elliot (2001). In the system from figure 1.7, the Laplace transform of the error signal is given by equation 1.1 E(s) = D(s) − H(s)G(s)E(s). (1.1).
(47) 21. The transfer function between the disturbance and the error or residual signal can be derived from equation 1.1. This transfer function is referred to as the sensitivity function, S(s), expressed in equation 1.2. S(s) =. E(s) 1 = D(s) 1 + H(s)G(s). (1.2). To ensure that the control provides good rejection of the disturbance, the sensitivity function needs to be small. Inspection of equation 1.2 reveals that if the combined plant and controller frequency response is positive and of high amplitude, the disturbances will be rejected efficiently. On the other hand, if the combined frequency response is negative, the disturbances will be amplified and instability will occur if H(s)G(s) = −1. In practice, the plant frequency response will vary greatly across the frequency range. The frequency response of the loudspeaker and the microphone and the acoustic delay due to the distance between them introduces phase shift. As the phase shift approaches 180◦ , the feedback becomes positive and the system becomes potentially unstable. The role of the controller H(s), also called compensator, is to compensate the plant’s frequency response so that the system is stable and performs well. Typically, it means obtaining high amplitude and a phase around zero in the bandwidth where cancellation is desired and small amplitude where the plant is out of phase, so that the effect of constructive feedback is kept as small as possible. The term disturbance implies straying from a desired situation, in that case silence or a null signal, is implicit in figure 1.7 to emphasize on the disturbance rejection ability of the system. Figure 1.8 emphasizes on its tracking ability, but it is equivalent to figure 1.7 if c(t) = 0 and the plant output, renamed y(t) to be consistent with control literature, contains implicit disturbance. In the system from figure 1.8, the Laplace transform of the plant output y(t) is expressed by equation 1.3. Y (s) = H(s)G(s)[C(s) − Y (s)]. (1.3).
(48) 22. Figure 1.8 Block diagram of a feedback control system having a servo action, in which the output y(t) is arranged to follow the command signal c(t) Reproduced from Elliot (2001). The ability of the system to track a command signal is characterized by equation 1.4, the transfer function between the plant output and the command signal, often referred to as complementary sensitivity function, T (s). Y (s) H(s)G(s) = = T (s) C(s) 1 + H(s)G(s). (1.4). If T (s) is large, the system will provide efficient tracking. The sensitivity function and complementary function sum to unity, and the output signal due to both the command signal and the disturbance is shown in equation 1.5. Y (s) = S(s)D(s) + T (s)C(s).. (1.5). In general, a small positive sensitivity function is required for good disturbance rejection and provides a large positive complementary sensitivity function that implies good tracking. However, since the plant is an electro-mechanical and acoustical system that has complex dynamics including resonances and phase shifts, the choice of a good compensator, or controller, is critical. In any ANC application, plants have uncertainties and variabilities that can cause the feedback to become unstable, so a trade-off between performance and safety rules the design of a compensator. The next section explains controller design and implementation using analog compensators..
Figure


+7


Documents relatifs
(A) The Zipper process is initiated by an interaction between a host cell receptor and a bacterial surface protein which allows the activation of RhoGTPases and actin
L’archive ouverte pluridisciplinaire HAL, est destinée au dépôt et à la diffusion de documents scientifiques de niveau recherche, publiés ou non, émanant des
Hearing aids manufacturers, in recent years, have improved signal processing options such as adaptive microphone directivity and noise reduction.. The most recent
Inspired by this artistic process, that brings the visual and the sonic into an interpretive relationship with each other, we invited artists to develop visual work with
Musicians use multi-sensory feedback to control their sound production. In this context, auditory feedback plays a major role in identifying changes in dynamics, pitch, duration,
The effects of the control in the sound are studied investigating the coupling between this mode and the second partial of the A string of the guitar since its frequency is 220 Hz
Cette étude nous montre que la Dimedone et l’ortho-phénylènediamine deux produits commerciaux et bon marché, réagissent pour donner l’intermédiaire
Our density data analyses (14-17), performed in order to improve the first models which were mainly based on orbital data of satellites with perigee greater than 250 km,
