HAL Id: tel-02513386
https://tel.archives-ouvertes.fr/tel-02513386
Submitted on 20 Mar 2020
HAL is a multi-disciplinary open access archive for the deposit and dissemination of sci-entific research documents, whether they are pub-lished or not. The documents may come from teaching and research institutions in France or abroad, or from public or private research centers.
L’archive ouverte pluridisciplinaire HAL, est destinée au dépôt et à la diffusion de documents scientifiques de niveau recherche, publiés ou non, émanant des établissements d’enseignement et de recherche français ou étrangers, des laboratoires publics ou privés.
Analyse et optimisation technico-économiques des
nouveaux services de mobilité basés sur l’usage des
véhicules autonomes
Jaâfar Berrada
To cite this version:
Jaâfar Berrada. Analyse et optimisation technico-économiques des nouveaux services de mobilité basés sur l’usage des véhicules autonomes. Economies et finances. Université Paris-Est, 2019. Français. �NNT : 2019PESC1002�. �tel-02513386�
Thèse de doctorat d’Université Paris-Est
Jaâfar BERRADA
TECHNICAL-ECONOMIC ANALYSIS OF SERVICES BASED ON
AUTONOMOUS VEHICLES
Thèse dirigée par Fabien Leurent
Soutenue le 12 Février 2019
Jury :
Rémi Maniak.Professeur Ecole Polytechnique (Rapporteur)
Jakob Puchinger. Professeur Centrale Supélec (Rapporteur)
Patrice Aknin. Directeur de recherche IRT SystemX (Examinateur)
Zoi Christoforou. Professeur Université de Patras (Examinatrice)
Goknur Sirin. Docteur Responsable projets R&D Renault (Examinatrice)
Fabien Leurent. Professeur ENPC (Directeur de thèse)
J. Berrada, VEDECOM and LVMT 3
This thesis is dedicated to my first source of inspiration, strength and confidence, to my Dad, without whom nothing in my life would be possible, to my Mom, the reason I am who I am and to my beloved Noussaiba, for her unwavering support and boundless affection.
J. Berrada, VEDECOM and LVMT 5
First and foremost, my deepest gratitude goes to my advisor Prof. Fabien Leurent. Over the last years, he has served as an excellent teacher and mentor, providing guidance, reviewing my work and stretching my abilities. His knowledge, passion and rich curiosity have motivated, and will continue to motivate, my research pursuits. I would also like to extend my gratitude to my supervisor at VEDECOM, Nadège Faul, for her unconditional support of my research project. Her leadership made this thesis an enjoyable work.
Additionally, the help provided by Prof. Ingmar Andreasson invaluably progress this research. Its vision has helped guide the project to its current state, and I am continually grateful to have access to his wisdom. Also, I must particularly thank Shadi Sadeghian for her invaluable contribution to the launch of this research thesis at VEDECOM.
I want also to thank Alexis Poulhès, my colleague at LVMT, for his availability to discuss and advise me to deal with demand simulation issues, Wilco Burghout, for sharing with me its knowledge and experience in developing supply simulation tools, and Zoi Christoforou, for her precious advises and valuable tips throughout my thesis, including to achieve the stated-preference survey. I am sure that we will continue to work together during next years. Thanks also to Nicolas Doucet and Florence Prybyla for their support on demand modelling using PTV VISUM model.
More generally, I would like to thank my colleagues of LVMT, Xavier for the good time we had last years, but also Luc, Cyril, Bachar, Gaële, Mallory, Virginie(s), Sophie, Sandrine(s), Florent, Nicolas, Xioyan, Maylis and many others who had made my past three years so enjoyable. My precious experience has been marked furthermore by the incredible people of VEDECOM: Maxime (1 and 2), Bofei, Toussaint, Tatiana, Abishek, Charlotte, Vincent, Younes, Leurent, Ronan, etc.
To my dear friends: Naoufel, our discussions over these years were instructive. Your ambition, your resolution and your sacrifices for people you care about make of you an exceptional person. Zakaria, Alae and Hamza, I admire you each in such different ways. I can never get enough of discussing with you. Assem, your permanent presence is invaluable. Brahim, Hassan, Ayoub, Abdessamad, Asmaa, Hajar, Hafssa, Sara; all my friends of the association “Les Chaines d’Or”, and all others who encouraged me during these years, thank you: I wish you success in your respective projects.
Finally, thank you to my incredible family. My Grandmother, aunts and uncles, thanks for your inconditional support. Si Mohamed and Khadija, thanks for your encouragements. Your unconditional kindness is exceptional. Oumayma and Zaynab, you are wonderful sisters. Thanks for your joyful spirit, your assistance as well as your efforts to make us happy. Hamza, Marwa and Douae, thanks for always believing in me. I admire your energetic and ambitious nature. Keep working and never give up your dreams. My
father-in-J. Berrada, VEDECOM and LVMT 6
law, my mother-in-law, thanks for your unconditional love and for always pushing me to be better. My dad, my mom, and my beloved Noussaiba, I owe you everything. Thank you.
J. Berrada, VEDECOM and LVMT 7
Abstract
Autonomous Vehicles (AV) are becoming more of a reality, promising beneficial yet potentially disrupting changes to our urban transportation systems. This technology presents the potential to reduce energy consumption and crash occurrences, cut travel costs and minimize urban space occupancy for parking purposes. Yet barriers to implementation and mass-market penetration remain. Economically, the upfront costs in the initial stage will likely lack affordability. Socially, users could be reluctant to change their daily travel routines. Technically, the interactions with the other components of the transportation system remain uncertain. There are other challenges regarding liability, security, ethics and data privacy, too.
This thesis contributes to the ex-ante study of AV-based mobility systems through the identification, design and assessment of upcoming Business Models (BM) articulated around AVs. In particular, it brings about a systemic analysis of “new” mobility services (especially car-sharing, carpooling and ride-sourcing services) in order to identify autonomous taxis (aTaxis) and autonomous shuttles (aTransit) as two of the most relevant forms of services that may enjoy wide spreading. Then, we focus on a service of aTaxis and we put forward a microeconomic model framework to evaluate strategic setups of aTaxis provider. The model framework comprises three levels (operational, tactical and strategic), and integrates three pressure forces (regulation, unit costs and demand preferences). An application is then conducted on a stylized area (Orbicity) and a real urban case (Palaiseau, a city in Paris area).
Simulation results show that automation has the potential to improve both the mobility performances and the economic efficiency of the urban transportation system. Additionally, the density economies of supply and demand are evaluated by controlling both the fleet size and the number of users for a fixed study area. In particular, the framework application on Palaiseau proved that increasing by ten the fleet size of aTaxis involves 1 % more users (+15 passengers) yet 50 % less of profit. A stated-preference survey supports the model framework and suggests that aTaxis will likely be used for short-distance (2 to 5 km) commuting trips by two user profiles: (1) non-motorized young users (less than 30 years old) and (2) motorized active population between 30 and 50 years old.
The thesis takes an interdisciplinary approach combining (1) a qualitative analysis that starts from a review of existing works and adds first a marketing analysis of Business Models based on AVs and second a systemic analysis of an aTaxis service, and (2) a quantitative analysis, situated midway between microeconomics and spatial simulation.
Keywords: Autonomous vehicles, Shared Mobility, Business Models, Qualitative
J. Berrada, VEDECOM and LVMT 8
Contents
Dedication... 3 Acknowledgements ... 5 Abstract ... 7 Contents ... 1 List of Figures ... 11 List of Tables ... 14List of Abbreviations ... Erreur ! Signet non défini. Introduction ... 15
1. Context: From technology to services ... 15
2. Problem statement ... 21
3. Purpose and Contributions ... 21
4. Approach and Methodology ... 23
5. Overview of the thesis ... 26
References ... 32
Section I. State of the art ... 35
Chapter.1 Modeling Transportation Systems involving Autonomous Vehicles: A State of the Art ... 36
Abstract ... 36
1. Introduction ... 36
2. Spatial models of AV-based services ... 37
3. Socio-economic models of AV development ... 42
4. Impacts of Autonomous Vehicles ... 45
5. Outreach, limitations and some recommendations ... 47
References ... 48
Chapter.2 Shared Mobility services: Review of existing services and findings of spatial and socio-economic models... 52
Abstract ... 52
1. Introduction ... 52
2. Overview classification of SM services ... 53
3. Overview presentation of existing SM Business Models ... 54
4. Review of models simulating Shared Mobility services ... 68
5. Impacts of SM services: models results and current feedbacks ... 76
6. Summary and recommandations ... 78
References ... 81
appendix: comparison between uber and lyft ... 88
Section II. Exploration of pertinent form(s) of services based on Autonomous Vehicles ... 91
Chapter.3 Between private cars and mass transit: the rise of intermediate modes in the urban setting ... 92
Abstract ... 92
1. Introduction ... 93
2. A typology of urban travel modes ... 94
J. Berrada, VEDECOM and LVMT 9
6. Global effects and the community perspective ... 103
7. Conclusion ... 104
References ... 105
Chapter.4 Business Models for services based on Autonomous Vehicles: design and comparison with urban conventional modes and Shared Mobility services ... 107
Abstract ... 107
1. Introduction ... 107
2. Design and classification of BM based on an analysis of pss ... 108
3. Classification based on the category of users and/or the service provider ... 112
4. The impact of AV on B2C Business Models and their integration into a multimodal universe ... 115
5. Conclusion ... 122
References ... 122
Section III. Construction of a microeconomic model for assessment of management strategies with application on Orbicity taxi service ... 123
Chapter.5 Strategic framework for determination and assessment of management decisions for an autonomous taxis business ... 124
Abstract ... 124
1. Introduction ... 124
2. Technical composition and institutional organization of an autonomous for-hire service ... 126
3. Pressure forces... 129
4. Management decisions setups ... 134
5. Performance indicators ... 136
6. Summary, discussion and next steps ... 138
References ... 140
Chapter.6 From strategic framework to microeconomic model. Mathematical abstraction with a numerical application on Orbicity taxi service. ... 143
Abstract ... 143
1. Introduction ... 143
2. Model’s architecture ... 144
3. Formulation and model composition ... 149
4. Application case: Orbicity taxi service ... 162
5. Discussion and conclusion ... 178
References ... 180
Appendix ... 182
Section IV. Application case ... 185
Chapter.7 Towards practical implementation of autonomous taxis service: Territorial diagnostic, network design and social acceptance ... 186
Abstract ... 186
1. Introduction ... 186
2. Territorial diagnostic ... 187
J. Berrada, VEDECOM and LVMT 10
4. Acceptance of autonomous taxis in palaiseau ... 200
5. Discussion and conclusions ... 211
References ... 212
Appendix: Interview ... 210
Chapter.8 Demand modelling of autonomous shared taxis mixed with scheduled transit with application of the strategic framework on Palaiseau area ... 219
Abstract ... 219
1. Introduction ... 219
2. Demand-supply connection framework ... 220
3. Simulation case study ... 227
4. Conclusion ... 238
References ... 239
Conclusion ... 241
1. Summary ... 241
2. Limitations ... 245
3. Recommendations for future works ... 247
J. Berrada, VEDECOM and LVMT 11
List of Figures
Figure 1 SAE levels of automation ... 17Figure 2 Synthesis of literature review ... 48
Figure 3 Models of carsharing services and main impacts findings ... 80
Figure 4 Models of ridesharing services and main impacts findings ... 80
Figure 5 Models of for-hire services and main impacts findings... 81
Figure 6 Investment costs versus line capacity. ... 96
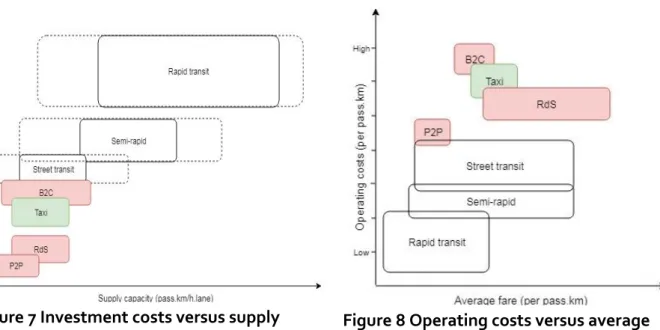
Figure 7 Investment costs versus supply capacity. ... 99
Figure 8 Operating costs versus average fare. ... 99
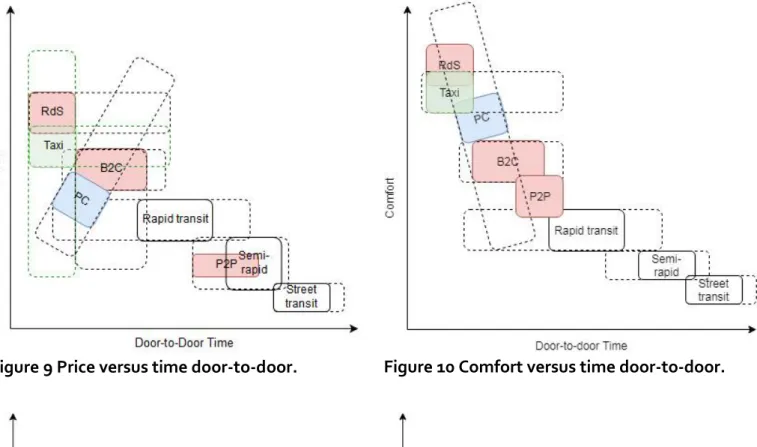
Figure 9 Price versus time door-to-door. ... 101
Figure 10 Comfort versus time door-to-door. ... 101
Figure 11 Waiting time versus Access time. ... 101
Figure 12 Real-time flexibility versus physical connectivity. ... 101
Figure 13 Externalities, accessibility and impact of blockage for different services. ... 103
Figure 14 Synthesis of characteristics for planners, operators and users. ... 105
Figure 15 Categories of Business Models applied on vehicles ... 112
Figure 16 Market size versus barriers ... 114
Figure 17 Line capacity versus investment costs ... 118
Figure 18 Supply capacity versus investment costs ... 119
Figure 19 Average fare versus operating costs ... 119
Figure 20 Door-to-door time vs average fare per use ... 120
Figure 21 Door-to-door time versus comfort ... 120
Figure 22 Access time versus waiting time... 120
Figure 23 Physical connectivity versus real-time flexibility ... 120
Figure 24 Externalities versus accessibility ... 121
Figure 25 Technical components, institutional structure and relations between major stakeholders of an autonomous taxi industry ... 129
Figure 26 Overview of the strategic framework ... 139
Figure 27 Scheme of interrelations (1) between operational, tactical and strategic layers and (2) between strategic layers and pressure forces. ... 146
Figure 28 Scheme of demand-supply equilibrium achieved in the operational layer .. 152
Figure 29 Overview of interrelations between LOS and demand components ... 156
Figure 30 Scheme of the economic equilibrium achieved in the tactical layer as well as relations between tactical and operational layers ... 157
Figure 31 Scheme of the optimization process led by the strategic layer to determine the service commercial positioning ... 160
Figure 32 Results of profit maximization w.r.t demand and AV penetration levels ... 172
Figure 33 Results of welfare maximization w.r.t demand and AV penetration levels ... 173
Figure 34 Satellite map of Paris ... 174
Figure 35 Satellite map of Saint-Malo ... 175
J. Berrada, VEDECOM and LVMT 12
Figure 37 Palaiseau City ... 187
Figure 38 Topography altitudes at Palaiseau ... 188
Figure 39 Land use in Palaiseau city (IAU, 2012) ... 189
Figure 40 Population in Palaiseau area (based on (DRIEA, 2010)) ... 190
Figure 41 Density of population in Palaiseau area (based on (DRIEA, 2010)) ... 191
Figure 42 Jobs in Paris Palaiseau area (based on data of (INSEE, 2017)) ... 192
Figure 43 Commuting trips emitted from Palaiseau (based on (DRIEA, 2010)) ... 193
Figure 44 Commuting trips attracted by Palaiseau (based on (DRIEA, 2010)) ... 193
Figure 45 Distribution of public modes subscriptions for users of transit in Palaiseau area ... 194
Figure 46 Three zones representing main sources of emission and attraction in Palaiseau ... 197
Figure 47 Traffic state during peak period in Palaiseau (Tuesday, 09h00), Google Maps ... 198
Figure 48 Traffic state during off-peak period in Palaiseau (Tuesday, 12h00), Google Maps ... 199
Figure 49 Infrastructures of BRT (green) and cars (red) ... 199
Figure 50 Point A requiring civil works ... 200
Figure 51 Point B, with two directions ... 200
Figure 52 Network scheme ... 200
Figure 53 Distribution of respondents during the day ... 202
Figure 54 Distribution of main used modes by respondents according to the interview location ... 203
Figure 55 Distribution of respondents ages by gender... 204
Figure 56 Socio-professional categories of respondents ... 204
Figure 57 Correlation between the willingness to use the service and the potential frequency of using it ... 205
Figure 58 Relation between users’ age and the interest in the service ... 206
Figure 59 Willingness to use the service with respect to gender (women inner circle and men outer circle) ... 206
Figure 60 Socio-professional category and potential frequency of using the service .. 207
Figure 61 Potential frequency of using the service, a focus on non-active population 207 Figure 62 Travel purpose of aTaxis users ... 208
Figure 63 Travel distances by purpose for aTaxis users ... 208
Figure 64 Frequency of aTaxis use depending on the most used means of transport . 209 Figure 65 Frequency use of aTaxis before and after learning that vehicles are autonomous ... 210
Figure 66 Willingness of ridesharing ... 211
Figure 67 Empty (green) and full (blue) vehicles destined to one of the stations... 222
Figure 68 VIPSIM output window showing main KPIs and average passenger waiting times at stations ... 223
Figure 69 Overview of the integrated framework: (a) Integration of VIPSIM in the four-step model of VISUM, (b) Feedback loop between VIPSIM and VISUM ... 226
Figure 70 Palaiseau network for autonomous taxis ... 228
J. Berrada, VEDECOM and LVMT 13
Figure 73 Variation of hourly demand and profit with respect to aTaxis fleet size ... 233
Figure 74 Variations of ridesharing and empty vehicle kilometers with respect to fleet size ... 233
Figure 75 Profit with respect to fleet size and fare. Zero profit corresponds to BRT profit. ... 234
Figure 76 Demand with respect to fleet size and fare. Demand of BRT before implementation of aTaxis is 460. ... 235
Figure 77 Ratio of loaded driven distances with respect to fleet size and fares. ... 235
Figure 78 Emissions with respect to fleet size and fares. ... 236
Figure 79 Impact of demand level and technology on profitability and ratio of loaded driven distances ... 237
Figure 80 Overview of the evolution of the thesis and used approaches ... 243
Figure 81 Price versus door-to-door time considering aTaxis + rapid transit ...248
Figure 82 Waiting versus access time considering aTaxis + rapid transit ...248
Figure 83 Feedback loops between VIPSIM and VISUM to deal with two aTaxis services (a) parallel scheme, (b) sequential scheme ... 250
J. Berrada, VEDECOM and LVMT 14
List of Tables
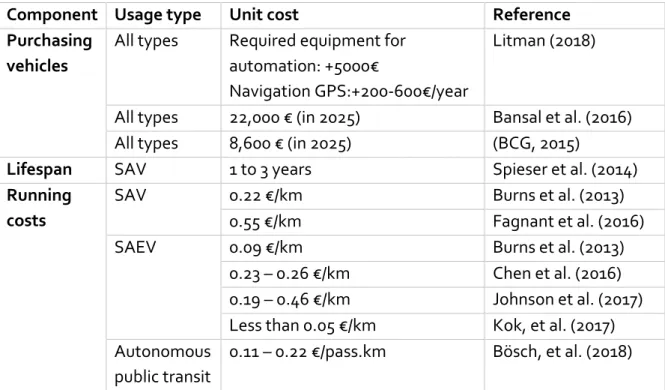
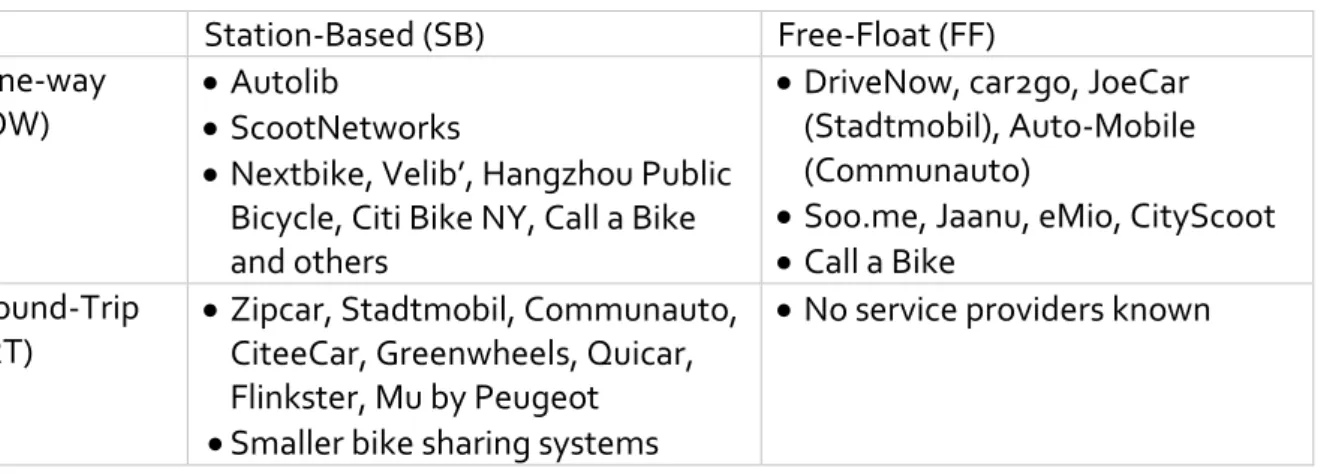
Table 1 Values of production costs based on literature review ... 44Table 2 Classification of carsharing services (Hardt & Bogenberger, 2016) ... 55
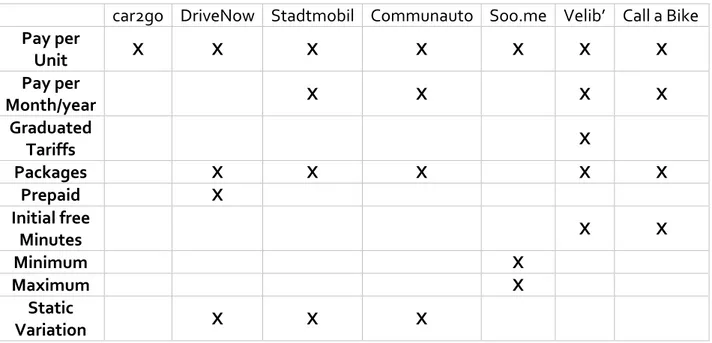
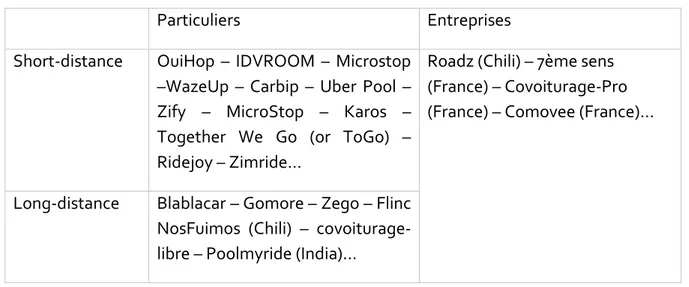
Table 3 Pricing structures applied by different providers (Hardt & Bogenberger, 2016) . 56 Table 4 Classification of current carpooling providers... 59
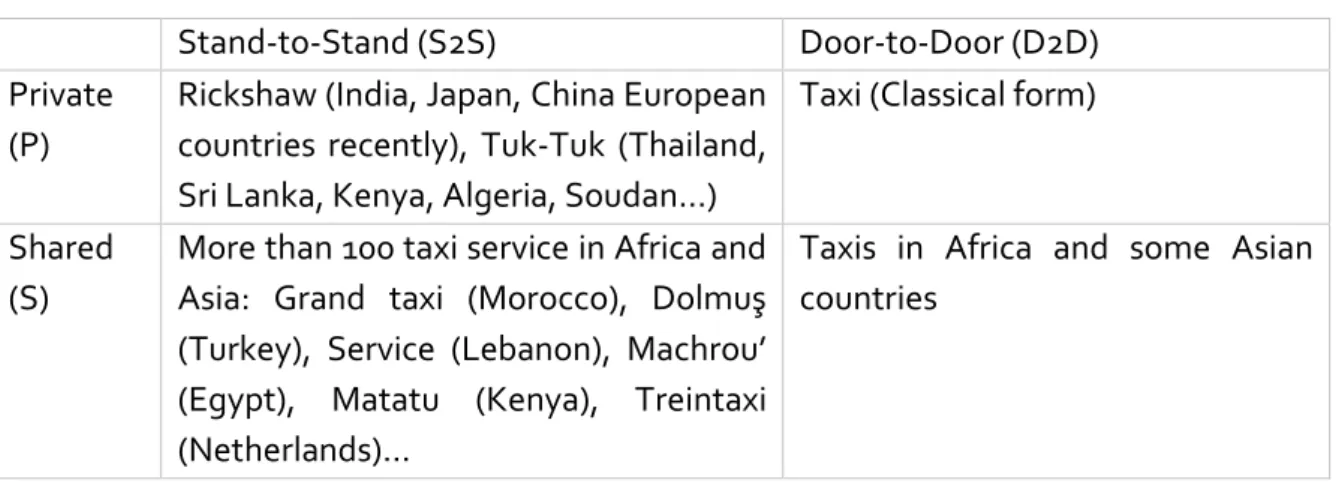
Table 5 Classification of traditional for-hire services ... 64
Table 6 Classification of current for-hire service providers ... 64
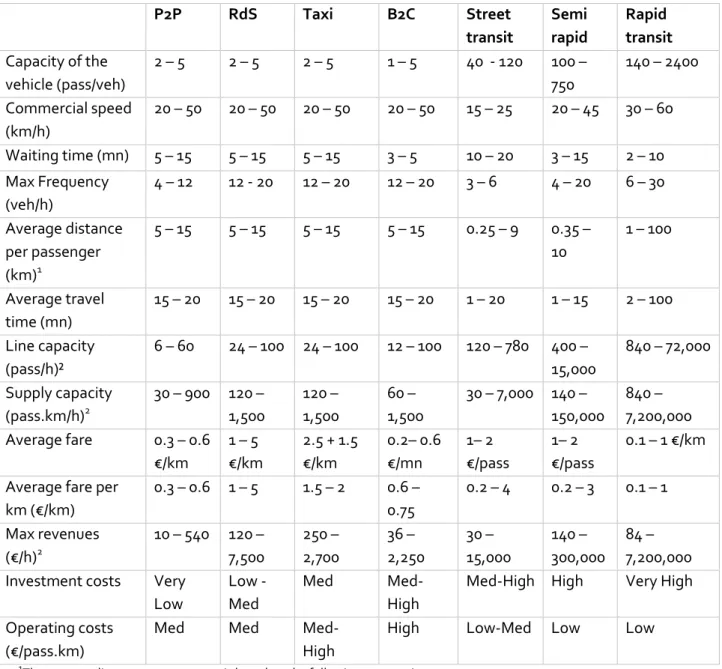
Table 7 Technical and economic characteristics of urban travel modes. ... 97
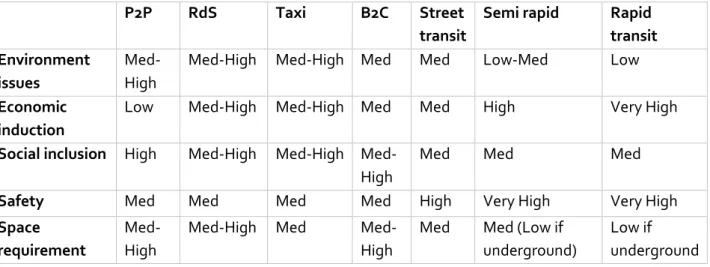
Table 8 Environmental and social characteristics of urban travel modes in the community perspective. ... 104
Table 9 Classification of PSS services into P2P, B2C and B2B Business Models ... 113
Table 10 Characteristics of B2C services ... 115
Table 11 Characteristics of aTaxis and aTransit ... 116
Table 12 Technical and economic characteristics of aTaxis and aTransit services in comparison with urban travel modes. ... 117
Table 13 Global effects from the community standpoint ... 121
Table 14 Interests and concerns of major stakeholders of an autonomous taxi industry ... 128
Table 15 Perceived values of level of service from literature review ... 150
Table 16 Performance indicators of the strategic framework ... 161
Table 17 Demand assumption for Orbicity taxis service applied around Paris area ... 165
Table 18 Performance indicators for the maximization profit. Orbicity applied on Paris area. ... 168
Table 19 Results of social welfare maximization and comparison with results of profit maximization ... 169
Table 20 Demand and supply inputs for Saint-Malo, Rennes and Paris ...177
Table 21 Results of profit maximization for three French cities and two automation scenarios (0% and 100% of fleet) ... 178
Table 22 Results of social welfare maximization for three French cities and two automation scenarios (0% and 100% of fleet) ... 178
Table 23 Activity ratios of the Palaiseau population: 2011-2015 evolution ... 190
Table 24 Population and jobs of three zones ... 197
Table 25 Main travel mode used by respondents ... 202
Table 26 Travel characteristics of the sample ... 203
Table 27 BRT technical characteristics ... 227
Table 28 Coefficients of the utility for modes ... 229
Table 29 Mode split between private cars and public modes before and after introducing aTaxis ... 231
Table 30 Performances of two ridesharing strategies ... 237
J. Berrada, VEDECOM and LVMT 15
Introduction
1. Context: From technology to services
Autonomous Vehicles (AVs), broadly defined, are vehicles used to move passengers or freight with some level of automation that aims to assist or replace human control (Stocker & Shaheen, 2017). They are capable of sensing their surroundings by combining a variety of techniques and sensors, including radar, 3D cameras, light detection and ranging (LIDAR), advanced GPS, odometers and machine vision. Many AV systems are in operation today, mainly in controlled environments: automated metro lines have constituted the main instance since Paris-Orly-Val opened in 1987. On the other hand, hundreds of experiments have been undertaken worldwide to prepare the integration of autonomous cars in public roadways.
History of vehicle automation and state of practice
Since the beginning of prosperity of the automotive era, the automation of car-driving has attracted specific studies: let us quote the car-to-car communication system using radio waves in Milwaukee during the 1920s (The Milwaukee Sentinel, 1926), the electromagnetic guidance of vehicles in the 1930s and 1940s, or the testing of smart highways by adding magnets to vehicles during the 1950s and 1960s (The Victoria Advocate, 1957). In 1980, Mercedes-Benz and Bundeswehr University Munich created the first autonomous car in the world, enabling to start thinking about legislation adaptation (Davidson & Spinoulas, 2015). Addition impetus was provided by the DARPA Grand Challenges I (2004), II (2005) and III (2007).
Since then, many automakers launched themselves in the quest for the perfect car or autonomous system. As of September 2018, over 45 companies around the world were developing AV technology (CB Insights, 2018), including most major auto manufacturers and many technology companies.
For instance:
- Daimler (Mercedes-Benz owner) and Bosh announced in July 2018 the launch a small fleet of autonomous taxis in California in the second half of 2019 (Bomey, 2018).
- Toyota invested $1 billion over five years to develop robotics and AI technology (Vincent, 2015).
- In August 2018, Tesla promised to provide full-driving features with the new version of Autopilot V9 (Hawkins, 2018a).
- Last year BMW announced a collaboration with Intel and Mobileye to develop autonomous cars. The official goal is to get “highly and fully automated driving into series production by 2021.” (Walker, 2018)
Context: From technology to services
J. Berrada, VEDECOM and LVMT 16
- In February, Ford announced an investment of $1 billion in Argo AI1. The company plans to combine the expertise of Argo AI with Ford’s existing self-driving car efforts to have a “fully autonomous vehicle” coming in 2021 (Korosec, 2018).
- As of July 2018, Waymo had self-driven 13 million kilometers on public roads, today at a rate of 40,000 kilometers per day (Hawkins, 2018b). The company currently has over 600 self-driving Chrysler minivans (Hawkins, 2018b). In addition, they announced in March 2018 (Hawkins, 2018c) and May 2018 (Ohnsman, 2018) a deal with Jaguar Land Rover and Fiat Chrysler respectively for an additional 20,000 electric SUV and 62,000 minivans.
- Last year, Uber entered into a $300 million joint venture with Volvo to develop next generation autonomous driving cars. Uber CEO, Dara Khosrowshahi, promised to offer passengers the option to ride with automated cars in the first half of 2019 (Pettit, 2018). For now, Uber has tested its AVs on public roads as part of a number of US pilot projects, including Pittsburgh, Tempe, Phoenix and San Francisco (Pettit, 2018).
- The alliance of Renault, Nissan and Mitsubishi plans to release 10 different self-driving cars by 2020. As of September 2018, they proposed 3 models of self-self-driving cars (JDG, 2018).
Levels of automation
The Society of Automotive Engineers (SAE) has defined six levels of automated functionality (SAE, 2018), ranging from fully manual (Level zero) to full automation (Level five). The classification is based on the degree of driver intervention required rather than the vehicle capabilities. It implies no particular order of market introduction. Figure 1 presents characteristics of the six levels as proposed by SAE:
1
Argo AI is an artificial intelligence company, based in Pittsburgh in 2017. It aims to tackle AV related applications in computer science, robotics and artificial intelligence (Crunchbase, 2018b).
J. Berrada, VEDECOM and LVMT 17
Figure 1 SAE levels of automation
As of 2018, automakers have reached Level 3, and Level 4 automation has been tested without a human in the driver seat on public roads.
Lexicology
In this new era of the automobile, “autonomous”, “automated”, “self-driving” and “driverless” are all terms often used interchangeably to designate the same technology. Culturally they have the same meaning to most people, however, there are slight differences factually.
Autonomous cars are theoretically cars which benefit of an autonomy when making decisions. Thus, a truly autonomous car would act alone and independently. It would decide, without any human, device or entity input, when and where to go. Levinson (2017) stated it as: “A truly autonomous car would decide on destination and route as well as control within the lanes”.
Automated cars do not have the level of intelligence or independence to make decisions by themselves. Well-defined instructions of destination and route are stated by the passenger or by the vehicle’s owner. Then, automated cars execute these instructions without any intervention of human driver.
Context: From technology to services
J. Berrada, VEDECOM and LVMT 18
Self-driving cars have an autopilot that can temporary replace the human driver at some stages of the drive. Yet, the “driver” can take the control at any time of the car. In SAE terms, self-driving cars correspond to Level 4 and below.
Driverless cars are capable of analyzing their environment and fully navigating safely without a human in the driver’s seat. They refer to the Level 5 of automation.
As a result, a vehicle with autonomous technology is automated; yet an automated vehicle is not necessarily autonomous. Similarly, driverless cars are self-driving while the converse is not true.
In this thesis, we use the term “autonomous” instead of the term “automated”, even if the latter term is arguably more accurate. This choice is based on a twofold reason: firstly, the term “autonomous” is currently the most widespread, even within the profession, and thus is more familiar to readers. Secondly, we believe that these slight linguistic differences between existing terms will be overcome.
Motivations of AV technology development
There are many reasons for the flurry of interest to AV technology.
Probably one of the most important motivations of developing AV technology is the wide believe that there are major safety consequences of motorized vehicles that could be overcame thanks to automation. According to the World Health Organization (WHO), over 3,400 people die on the world’s roads every day and 20 to 50 millions of people are injured or disabled every year (WHO, 2018). The National Highway Traffic Safety Administration (NHTSA) (2008) found that 93 % of crashes in USA between 2005 and 2007 were human caused. Hence, if AVs eliminate all human causes of crashes, accident rates could drop by as much as 90 %.
Social benefits include furthermore the potential to increase the trip comfort, enabling
people, not obliged to drive the car, to be less stressed and more productive while travelling. Mobility costs would be dramatically lower due to the drastic cut of driving costs. Moreover, accessibility to jobs, education and health care will be improved, especially of those restricted in today’s transport system model, such as elderly and disabled persons, which benefits to the economy at large.
From an environmental perspective, automation would likely be combined to an energy transition which promotes electric vehicles based on the sustainable use of renewable energy. Consequently, Autonomous Vehicles would bring in this case dramatic reductions or elimination of air pollution and greenhouse gases from the transport sector, and then improved public health.
J. Berrada, VEDECOM and LVMT 19
Autonomous Vehicles are also expected to involve systemic changes in urban mobility and then likely to reshape cities. For the past century, the private car has played the major role in structuring cities, expending their limits and increasing travel speed and comfort. However, the population explosion especially in urban cities has putted tension on already congested urban roadways. Similarly, AVs would enable to manage parking spaces and then decongesting downtown areas because will be able to park themselves. On the other hand, by providing better convenience to passengers, the adoption of AVs is likely to increase car travel (i.e. caused by the switch of people from public transport or the increase of daily trips). Today, planners advocate for reducing congestion and improving urban mobility. In Paris, policymakers want to halve the number of private cars in the city center (Guillot, 2017). In Madrid, they decide to ban in November 2018 all non-resident vehicles, except taxis, public transport, and zero-emission delivery vehicles (Anon., 2018). The mayor of London is aiming for 80 per cent of all trips to be made on foot, by cycle or using public transport by 2041 (Greater London Authority, 2018). Potential benefits of Autonomous Vehicles to contribute to cleaner, safer and more equitable transport system should be considered by planners as well. In addition, the dramatic cut in driving costs should be an additional motivation to make public transportation systems, often unprofitable, financially viable. Consequently, we expect that planners will be highly concerned in the near future by autonomous transportation systems’ operators. Probably, their role will change drastically from owning and managing transportation assets to managing autonomous transportation systems’ providers to ensure equitable access to autonomous travel modes with high quality of service and low externalities.
On the economic side, reduction of transportation costs will induce a significant increase of users’ purchasing power. In addition, reclaimed driving hours would result in higher productivity gains for the society. On the other hand, demand of new vehicles will plummet, which could result in total disruption of the car value chain (manufacturers, maintenance companies, insurance companies, etc.), while new categories around autonomous driving will emerge, including mobile apps, special equipment, mobility services, and infrastructure (ATKearney, 2016). For car manufacturing stakeholders, two adaptation options are conceivable: becoming high-volume assemblers of Autonomous Vehicles, or providers of AV-based services (Kok, et al., 2017). The first option is supported by the fact that since the lifespan of vehicles will pass from about 10 years to 3 years (Zhang, et al., 2015a; Spieser, et al., 2014), their manufacturing while updating the automation technology will be critical to ensure the model’s sustainability. The second option is based on the almost unanimous believe that AV-based services will assert themselves among urban travel modes. Goldman Sachs Group Inc. predicts that autonomous taxis will help the Shared Mobility services grow from $5 billion in revenue today to $285 billion by 2030 (Phys, 2017). Moreover, without drivers, operating margins could be in the 20 percent range, more than twice what
Problem statement
J. Berrada, VEDECOM and LVMT 20
automakers generate today. In any case, both strategies will be characterized by high levels of competition and with new entrants from other industries.
Shared Mobility services and AVs
Recently, the advent of the internet and then of the smartphone, in terms both of facilities and range of services, have contributed to the development of a sharing economy. The sharing economy is “a developing phenomenon based on renting and borrowing goods and services, rather than owning them” (Shaheen, et al., 2016). There are numerous benefits of the sharing economy, as improving the use efficiency of goods, providing costs saving, strengthening communities, and offering other social and environmental benefits. During the late 2,000s, numerous sharing Business Models emerged, such as peer-to-peer marketplaces (e.g. Airbnb, CouchSurfing…), crowdfunding (e.g. CrowdCube), media sharing (e.g. Spotify, SoundCloud…) and Shared Mobility (e.g. Uber, Zipcar and so on).
Shared Mobility (SM) is the shared use of motor vehicles, bicycles or other low-speed transportation modes, that enable users to obtain short-term access to transportation as needed, rather than requiring ownership (Shaheen, et al., 2016). SM includes carsharing (e.g. Car2Go, Zipcar), carpooling (e.g. UberPOOL, Blablacar), bikesharing and scooter-sharing (e.g. Lime, Bird) and ridesourcing (e.g. Uber, Lyft). SM services have grown rapidly in the world. Some key figures of SM development include for instance:
car2go vehicles are used by over three million members in 26 locations in Europe, North America and China while over one million members of Zipcar have access to more than 14,000 vehicles in more than 500 cities and towns.
As of September 2018, Uber have achieved over 10 billion rides while Lyft approaches the 1 billion.
In September 2018, Lime and Bird, scooter-sharing service providers, have reached 10 million rides in US cities one year after their launch.
Combined to AV technology, SM services may provide even more attractive and sustainable transportation solutions economically, socially and environmentally as well. Numerous small-scale experiments are tested around the world. Uber is partnering with Volvo while Lyft was approached by General Motors in order to test autonomous taxis in public roads. On the other hand, Navya and EasyMile contribute to the research on autonomous shuttles, which were tested in several cities as of the end of 2018.
One of the reasons of this interest to Shared Autonomous Vehicles (SAV) is based on the belief that private AVs might not be affordable for the average customer when first brought to market. In addition, it is conceivable that SAV, unlike private AVs, would probably reduce congestion and GHG emissions, increase accessibility and improve the land use.
J. Berrada, VEDECOM and LVMT 21
2. Problem statement
Automation is becoming more of a reality. In the meantime, it will be necessary to prepare the development of autonomous roadway mobility by anticipating the potential impacts on the spatial organization of cities, on the quality of life of inhabitants and on the local and global economy. In other worlds, the three pillars of sustainable development are involved. The impacts will depend on the shape of AV-based travel modes to constitute a multimodal universe for the urban mobility, from privately-owned and privately-used AVs to AV-based SM services, the latter including autonomous modes of public transit as well as autonomous taxis and autonomous shuttles. As such, what forms of service deploying Autonomous Vehicles would assert themselves in the urban mobility universe? What would be their benefits both to their customers and their operator? Would they be complementary or competitive with the current transportation supply? How would they affect the operators’ businesses, people quality of travel by all modes, the residents’ daily life, as well as social and environmental concerns of collectivities?
The analysis of the actual context guided us to observe the particular interest of combining the AV technology with SM. In addition, the majority of experimentations are particularly devoted to exploring impacts of low-capacity SAV, which would strengthen the supply of SM services and then improve the overall mobility and economic performances of the urban transport system. Therefore, SAV based on (1) small to mid-sized vehicles (2-7 seats), known as autonomous taxis or robo-taxis, and (2) large vehicles (10-25 seats), known as autonomous shuttles, capture the attention of academic and industrial research works. In Palaiseau, France, the implementation by VEDECOM of a service of autonomous taxis in 2019, is one of a series of experimentations that are conducted worldwide. It should make it possible to ask the questions above in a concrete way. Yet, it is required, before that, to determine operational and commercial strategies, including the fleet size, the level of fare, the regulation constraints and so on. To that end, it will be necessary to propose a simulation model that describes the impacts with respect to the service’s features from the perspective of each stakeholder. Additionally, the proposed model should be capable of carrying on any type of application sites. As such, what results does it show, in the specific case of Palaiseau, on terms of the economic, social and environmental impacts considering different short, medium and long-term strategies explored by the service provider?
3. Purpose and Contributions
The thesis aims to (1) identify, (2) conceptualize and (3) assess potential Business Models (BM) for urban services based on AV. In particular, this threefold objective consists of: (1) The identification: brings together previous research works and studies that were conducted to describe and evaluate impacts of AV in particular and of SM services in
Purpose and Contributions
J. Berrada, VEDECOM and LVMT 22
general. We put forward a classification of these services according to their technical, economic and social features while considering conventional urban travel modes (transit and private cars). Two business-to-customer (B2C) BM have captured our attention: autonomous taxis and autonomous shuttles. We then focus on autonomous taxis (aTaxis) for the rest of the thesis.
(2) The conceptualization: explores the technical and organizational features of aTaxis service. It describes the main pressure forces of the environment that affect the business. Then, a technical-economic model framework is constructed, which covers operational, tactical and strategic levels of the service management.
(3) The assessment of particular instances of BM: is achieved according to main social actors (stakeholders): operators, users and public authorities. In particular, the performance indicators are mathematically formulated and used to extend the previously defined technical-economic model. An application case on a stylized area (Orbicity) and a real case (Palaiseau, a city in Paris area), explore economic, social and environmental performances of aTaxis.
Concretely, this thesis brings about (1) theoretical contributions by:
Proposing a literature review of developed simulation models that describe technical and social performances of AV-based services2.
Constructing characteristic diagrams to analyze SM services in a multimodal universe3.
Analyzing qualitatively BM of AV-based services in a multimodal universe4. Additionally, the thesis proposes (2) methodological approaches, by:
Suggesting a framework to optimize economic strategies of autonomous taxis, based on a systemic analysis.
Coupling an agent-based model developed by VEDECOM and KTH (VIPSIM), which describes technical features of the supply, and a four-step model, which considers the behavior of the demand5.
Using a stylized urban area proposed by (Leurent, 2017) that describes taxi movements and operational strategies to assess management decisions6.
2
Berrada, J. & Leurent, F., 2017. Modeling Transportation Systems involving Autonomous Vehicles: A State of the Art. Transportation Research Procedia, Volume 27, pp. 215-221. DOI:10.1016/j.trpro.2017.12.077
3
Berrada, J., Leurent, F., Lesteven, G. & Boutueil, V., 2017. Between private cars and mass transit: the room for intermediate modes in the urban setting. Transforming Urban Mobility Conference (Mobil.TUM),Munich, Germany, July 4-6
4
Berrada, J., Christoforou, Z. & Leurent, F., 2017. Which Business Models for Autonomous Vehicles?, ITS Strasbourg Conference, Strasbourg, France, June 19-22
5
Berrada, J., Andreasson, I., Burghout, W. & Leurent, F., 2019. Demand modelling of autonomous shared taxis mixed with scheduled transit. Proceedings of the 98th edition of Transportation Research Board (TRB) Annual meeting, Accepted.
J. Berrada, VEDECOM and LVMT 23
The thesis uses a case-based approach to:
Suggest a stated-preference survey that explores the acceptancy of autonomous taxis by passengers.
Analyze the impact of demand density and vehicles’ technology on profitability and social welfare7.
In parallel, the thesis enables to explore alternative solutions that will not be presented in this manuscript:
Construction of an agent-based model, which describes the behavior of ridesourcing services by maximizing the utility of vehicles/ drivers8.
Economic assessment of a ridesourcing service in comparison with a service of bus. In particular, the ridesourcing service fare is determined in order to maintain the same level of subsidies provided by public authorities. Results show that for the same fare of buses and ridesourcing, subsidies drops dramatically for ridesourcing9.
Analysis of two assignment strategies: the single-vehicle strategy, where the taxi is only concerned with its own performance and seeks to maximize its utility without consideration for other vehicles in the system; and the dispatching strategy, where vehicles communicate through a dispatcher and collaborate to maximize the utility of all the system. Results of an application on Saclay area found that the dispatcher provides better quality of service and higher economicefficiency10.
4. Approach and Methodology
This thesis adopts a twofold approach:
The first one is a qualitative approach. It explores Business Models (BM) based on AVs and defines a strategic framework that assesses autonomous taxis services. In particular, it consists of:
(a) A large literature review which explores at the same time:
+ Modelling transport systems involving Autonomous Vehicles and Shared Mobility services (carsharing, carpooling and for-hire). This review explores the major approaches
6
Leurent, F. & Berrada, J., 2018. Towards a microeconomic theory of Shared Mobility, Transport Research Arena (TRA), Vienna, Austria, April 16-19
7
Berrada, J. & Leurent, F., 2017. Density economies and the profitability of demand responsive services.», European Transport Conference (ETC), Barcelona, Spain, October 4-6
8
Poulhès, A., Berrada, J., 2017. User assignment in a smart vehicles’ network: dynamic modelling as an agent-based model., Transport Research Procedia, Volume 27, pp 865-872, DOI:10.1016/j.trpro.2017.12.153
9
Berrada, J. & Poulhès, A., 2018. Quelle place pour les modes de taxis partagés ? Comparaison économique de différents modes de transport concurrents à l’aide d’une simulation multi-agent, 1ères Rencontres
Francophones Transport Mobilité (RFTM), Vaulx-en-Velin, Lyon, June 6-8
10
Poulhès, A. & Berrada, J., 2018. Single Vehicle Network Versus Dispatcher: User assignment in an agent-based model. Transportmetrica A: Transport Science. Under review.
Approach and Methodology
J. Berrada, VEDECOM and LVMT 24
and methodologies of scholars (algorithms, simulation tool, etc.) and brings together their findings, especially obtained economic, social and/ or environmental impacts.
+ Behavioral studies. They are based on stated-preference (SP) surveys and
revealed-preference (RP) surveys. Most of these surveys define the profile of potential users, their preferences and the possible restraints for using the service.
+ Microeconomic models. These models have been developed to analyze performances of
taxis service. The analysis of (Wong and Yang, 1998-2017) and more particularly that of (Leurent, 2017) is the basis of our autonomous taxis microeconomic model.
+ Marketing and strategic studies. These studies, mostly consulting reports, address
different strategic issues, from the prevision of AVs development to the analysis of SM services, passing by the servicizing theory and the shared economy theory.
+ Official publications, mainly of OECD and ITF dealing with development issues of AVs
and for-hire services.
(b) A marketing analysis of BM based on AVs
+ To explore BM, this analysis starts from a product-service system (PSS) analysis, which enables to classify BM according to the degree of the product/service tangibility. In fact, a BM could be based on the sale of products, on the sale of services or on the sale of the product use.
+ The PSS analysis is then combined with a classification according to the type of
user/provider and to spatial-temporal constraints. (c) A systemic analysis
+ The analysis of BM in a multimodal universe relies on the construction of characteristic
bi-diagrams, which confront economic, social and environmental indicators while considering
the perspective of public authorities, operators, users and residents.
+ The systemic analysis is applied in particular on autonomous taxis. It explores one by one the main technical components of the service, and the major stakeholders that affect directly or indirectly the service production. More globally, it identifies the constraints and pressures that are applied by the service environment.
Then, this analysis classifies the operator’s strategies and builds up the structure of a strategic framework that assesses economically, socially and environmentally an aTaxi service.
Finally, the qualitative approach enables to:
- Identify approaches and methodologies for supply modelling of AV-based services. - Understand and assimilate the methodology of building a microeconomic model. - Compare different kinds of services in the same multimodal universe and according
to common indicators.
- Show the interest of studying autonomous taxis and autonomous shuttles. - Define a strategic framework for autonomous taxis.
J. Berrada, VEDECOM and LVMT 25
The second approach of the thesis is quantitative. It aims to carry forward the findings of the qualitative approach. By focusing on autonomous taxis, it is purported to quantify the impact of strategies introduced previously by the strategic framework. In particular, it combines microeconomics, simulation models and behavioral studies.
(a) Microeconomics
Microeconomics enables to express the strategic framework into mathematical problems that could be resolved numerically or analytically. In particular, it defines the supply function and the demand function and then the traffic equilibrium problem. At a tactical level, a cost function and revenues function make up the profit and social welfare functions. The maximization problems of profit and social welfare are furthermore defined and resolved. The regulation issues could also be considered by applying constraints to maximization problems. The constructed microeconomic model is highly inspired from (Leurent, 2017).
As a result, the strategic framework constructed qualitatively give a rise to a microeconomic model, which is general, robust and suitable for different aTaxis implementation cases.
(b) Spatial simulation models
The application of the microeconomic model is based on a simulation on Palaiseau (a city in Paris region). The demand is estimated using the VISUM four-step model while the supply is simulated using an agent-based model developed by VEDECOM. By connecting the two models, we analyze mobility performances of the service, but also economic performances and automation strategies. The coupling between the two models is achieved in VISUM, which calls VIPSIM at the mode choice step and in each iteration until the verification of the convergence criterion. The connection is based on a Python program.
On the other hand, the assessment of the microeconomic model is also achieved by using the model of Orbicity that was proposed by Leurent (2018). In particular, the model is used to approach real cases by incorporating French cities data. Then, the optimal supply conditions at tactical (i.e. fleet size and fare level) and strategic (i.e. penetration of automation, demand density) levels are determined in order to maximize the economic and social indicators.
(c) Territorial and behavioral studies
Territorial and behavioral studies constitute a major input of the microeconomic model and simulation models as well. The territorial study determines geographic topology of Palaiseau and demographic and socio-professional characteristics of its population. In addition, it explores mobility needs and provides the basis to the design of an aTaxis network.
The behavioral study aims to determine the potential future behavioral response of users to the implementation of an aTaxis service. This study is based on a stated-preference (SP)
Overview of the thesis
J. Berrada, VEDECOM and LVMT 26
survey that was conducted with the population living and/or working/studying in Palaiseau. The study is composed of three parts: firstly, the acceptance of a ridesourcing public mode, then the acceptance of a service of aTaxis, before introducing a set of games that includes different modes in order to explore the main mode choice factors.
To sum up, the quantitative approach aims to:
- Construct a microeconomic model for aTaxis based on the strategic framework defined previously.
- Assess the acceptance of an aTaxi service.
- Evaluate the economic, social and environmental impacts of an aTaxi service for a fictive study case and a real territory.
5. Overview of the thesis
The thesis is organized into four sections; each one structured in two chapters:
Section I. State of the Art.
This Section presents a state of the art of SM services and services involving Autonomous Vehicles. It is organized into two Chapters:
Chapter.1 Modeling Transportation Systems involving Autonomous Vehicles: A State of the Art
This Chapter reviews the main modeling works on transportation systems involving AVs that were published in the academic literature up to the end of 2017. In particular, it provides some examples of applications and addresses their respective outreach and limitations. The literature review is furthermore organized into two categories of studies:
- Spatial modeling represents (i) in detail the technical specifications, and ii) the spatial features of the area in which the system is implemented.
- Socio-economic modeling addresses the conditions of market penetration and diffusion using mathematical methods with commercial or social orientation.
The Chapter finds that major existing models focus on the supply operations and set-ups without detailing the demand side beyond statistical and spatial description in the form of an origin-destination matrix of trip-flows. The Chapter outlines moreover the need of conducting acceptability studies with the various stakeholders (users but also transport authorities, transit operators, insurance companies, car manufacturers and so on). Since operating costs and commercial revenues cannot be observed for AV-based services as of today, they must be inferred from comparison bases, and simulated by means of an ad hoc model.
J. Berrada, VEDECOM and LVMT 27
Chapter.2 Shared Mobility services: Review of existing services and findings of spatial and socio-economic models
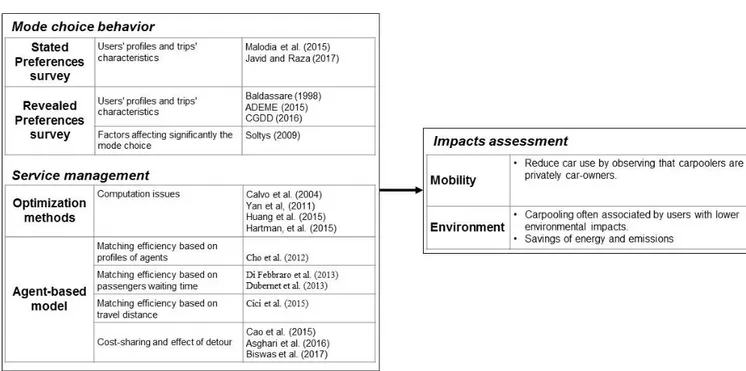
This Chapter synthesizes existing literature on definitions and types of SM services that are available at present. It focuses on carsharing, ridesharing and for-hire services and their technical-economic features and socio-economic impacts. Technical-economic features are determined based on the observation of existing providers. Socio-economic impacts derive mainly from scientific studies. They are organized according to two categories of models, similar to those of Chapter.1:
- Spatial models which are mostly agent-based.
- Socio-economic models including marketing analysis, revealed and stated-preferences surveys.
Empirical results indicate that shared modes can provide environmental and social benefits. Moreover, the Chapter identifies the major barriers to development of each service and gives recommendations for the development of Business Models based on AVs. In particular, it outlines that:
- Different kinds of Business Models are possible. Each business model depends on the category of the actor (companies or individuals) and has its own technical and organizational constraints;
- The development of Business Models based on AVs should knocking down technological locks, but also social and psychological barriers. That could be achieved through proposing attractive prices;
- The implementation of AVs should taking into account competition and complementarities with other existing services.
Section II. Exploration of pertinent form(s) of AV-based services
This Section explores and designs the main Business Models that could emerge for services based on Autonomous Vehicles. It is organized into two Chapters:
Chapter.3 Between private cars and mass transit: the rise of intermediate modes in the urban setting
This Chapter explores in urban settings the potential for Shared Mobility services, which are intermediate modes between public modes and private cars. It put forward characteristic diagrams to depict the range of modal solutions and assess their respective value in several perspectives that pertain respectively to Users, Operators, Planning authorities and Residents. In particular, it investigates the profitability trade-offs between operating costs and commercial revenues, the political trade-offs between modes based of the full array of their environmental, social and economic impacts, the Users’ trade-off between quality and price and the Residents’ trade-off between accessibility and local environmental externalities.
Overview of the thesis
J. Berrada, VEDECOM and LVMT 28
The main outcome is that there is room available for Shared Mobility services in each of these competitions since in bi-criteria diagrams none of them is dominated by the conventional modes.
Chapter.3 is written in (Berrada et al., 2017).
Chapter.4 Business Models for services based on Autonomous Vehicles with a comparison with urban mobility services
This Chapter uses a Product-Service-System (PSS) analysis to describe and classify main existing Business Models. The list of PSS Business Models is then crossed with a classification according to the type of the service user/ provider (individual or company). Three categories are then considered: P2P, B2C and B2B.
By focusing on B2C services and by incorporating specific features of AV technology (e.g. no driver required), two main forms of Business Models are identified: aTaxis and aTransit. The first one is based on mid-sized and/or small vehicles, which ensure a door-to-door on-demand service, probably in a limited operating area, and with the option of ridesharing. The second form of service uses larger vehicles, with fixed route service and loosely scheduled or on-demand service.
An analysis of aTaxis and aTransit services in a multimodal universe is achieved by tracing their positions in characteristic bi-diagrams constructed in Chapter.3. The Chapter found out that these new services compete with emergent services and for several attributes, they propose even better performances.
Chapter.4 is based on (Berrada et al., 2017).
As a result, the Section II:
- Presents the main conceivable kinds of AV-based Business Models
- Shows that B2C services are more inclined to assert themselves in the near future - Identifies aTaxis and aTransit as two main forms of service to analyze in detail
- Defines common indicators for urban travel modes (conventional, emergent and future modes)
- Draws a comparison between these modes using bi-diagrams and considering perspectives of major stakeholders.
Section III. Construction of a microeconomic model for assessment of management strategies with application on Orbicity taxi service.
This Section proposes a strategic framework to assess and optimize economic strategies from the perspective of the provider of an autonomous taxi (aTaxi) service. Then, the strategic framework gives a rise to a microeconomic model which describes the operator’s problems mathematically. The Section is organized into two Chapters:
J. Berrada, VEDECOM and LVMT 29
Chapter.5 Strategic framework for determination and assessment of management decisions for an autonomous taxis service.
This Chapter describes technical components of the aTaxi service, specifically main features of vehicles, road infrastructure, stations, dispatcher and operating resources. The analysis of social actors explores interests and powers of the service provider, but also of passengers, public authorities, suppliers of operating supplies and competitors. As a result, three main pressure forces of the service environment are identified: regulation, unit costs of production and demand preferences.
Strategic setups are then introduced to explore main facets of aTaxis service: vehicles’ technology to area’s properties and assignment strategies. Three levels of operator’s decision are considered:
- Strategic decisions define the structure of the activity and its overall direction and commercial positioning.
- Tactical decisions design the technical components of the service in order to optimize operating and economic performances.
- Operational decisions concern regular actions aiming to manage technical components of the service.
These decisions are furthermore assessed using performance indicators, which include from the operator’s perspective the profitability and technical efficiency, from users’ perspective the quality of service and from regulator’s perspective the social welfare and environmental impacts.
Chapter.6 From strategic framework to a microeconomic model: Mathematical abstraction and a numerical application on Orbicity taxi service.
This Chapter proposes a mathematical abstraction of relations that exist between the framework’s components. The description of each relation is supported by an explanatory scheme. The mathematical formulation is supported by the literature review.
A numerical application based on Orbicity, a stylized urban area introduced by (Leurent, 2017), enables to evaluate impacts of each model’s layer. In Orbicity, taxis are running along the contour with a constant speed and only when requests are emitted. The supply function is described by the availability of vehicles. On the hand, the demand function includes fare and quality of service. It assumes that passengers have same trips preferences and are generated uniformly along the study period.
The profit and social welfare are maximized firstly for Paris area and then with comparison with two other French cities having different demand characteristics. Results show that automation halves the fleet size and the fare and then has significant impacts quality of service and profit as well. On the other hand, the demand density and its sensitivity to the
Overview of the thesis
J. Berrada, VEDECOM and LVMT 30
generalized cost are affecting the service performances. In particular, the comparison between the three cities have shown that bigger cities, often characterized by higher density and greater transport budget of travelers (i.e. Paris in our application case), are attracting more demand and then allowing more profits.
As a result, the Section III:
- Defines a strategic framework for managing aTaxis service using a systemic analysis - In particular, it defines three levels of operator’s decisions (operational, tactical and
strategic) and three types of pressure forces.
- Constructs a microeconomic model which defines the traffic equilibrium (i.e. supply-demand equilibrium) and the economic equilibrium (i.e. profit maximization) problems.
- Applies the microeconomic model on a stylized urban area by considering demand features of three French cities. It determines the supply conditions (fleet and fare) that maximize the profit and the social welfare.
- Shows the impact of automation and demand features on the operational, economic and social performances of the service.
- Recommends to apply the microeconomic model on a real network.
Section IV. Application case.
This section presents an application case of the model developed in Section III on a real area: Palaiseau, a city in Southwest of Paris region. It is organized into two Chapters:
Chapter.7 Towards practical implementation of autonomous taxis service: Territorial diagnostic, network design and social acceptance.
This Chapter introduces Palaiseau through describing the geographic typology, the demographic structure, mobility needs and existing transport supply. In terms of urbanization, the Chapter outlines a heterogeneity (i.e. 31 % of the territory dominated by rural areas), which is confronted to the rapid development since the area is part of the growing French scientific cluster. From sociodemographic perspective, population and jobs are clearly imbalanced. Considering intern mobility performance, we observe that transit modes are competing with private cars (62 % for private cars and 38 % for transit modes). However, we identify the existence of only one BRT line and one bus line that connect the train station to the growing scientific cluster.
Based on results of the territorial diagnostic, the constraints involved by the spatial geography, the demand needs and the existing supply are identified. Then, a network of aTaxis is proposed with the purpose of connecting the main train station in the city to the scientific cluster, while ensuring the feeding in residential areas.
J. Berrada, VEDECOM and LVMT 31
Finally, the Chapter investigates the social acceptance of such a service by conducting a stated-preference survey in Palaiseau. Results suggest that the service would attract mainly two users profiles: (1) non-motorized young users less than 30 years old, and (2) active population between 30 and 50 years old and that is mostly motorized. The service would be used for trips of 2 to 5 km and shared by almost 3/4 of passengers.
Chapter.8 Demand modelling of autonomous shared taxis mixed with scheduled transit. Application of the strategic framework on Palaiseau area.
This Chapter proposes an application of the strategic framework to the city of Palaiseau (Chapter.7) where 60 aTaxis are implemented to replace a BRT service while ensuring moreover a feeding service. It develops a framework for modeling demand and supply interactions for aTaxis mixed with scheduled transit. In particular, it couples a dynamic microscopic supply model for aTaxis (VIPSIM) with a static and macroscopic model for demand (VISUM). Transfers between aTaxis and transit modes are incorporated in a combined utility for public modes. The feedback between these two models reflects the supply-demand equilibrium. It was obtained after 2 to 3 iterations.
Results show that by replacing a line of BRT by an aTaxis network, the level of service of public modes is improved, while operating costs are reduced for reasonable loading rates. In particular, aTaxis would compete with the level of service of the BRT in areas that are served exclusively by aTaxis. At the tactical level, it found that using ten more vehicles involves 1% more of users (+15 passengers) and 50% less of profit (-200€/hour). At the strategic level, a sensitivity analysis with respect to demand density and taxis’ automation has ascertained the results of the Orbicity application case.
Chapter.8 is based on (Berrada and al., 2019).
As a result, the Section IV:
- Proposes a territorial diagnostic for Palaiseau,
- Designs the network of aTaxis by considering main spatial and transport constraints, - Conducts a stated-preference survey in Palaiseau and presents the main results, - Constructs a framework that combines a four-step model (VISUM) and an
agent-based model (VIPSIM) and then enables to forecast the demand behavior and in turn the performances of strategies introduced by the technico-economic model.
- Shows the effect of aTaxis on mobility (demand share of public modes, quality of service, etc.), operational (fleet size, loading ratios), economic (fare, profit), social (users’ surplus) and environmental performances (emissions).