Science Arts & Métiers (SAM)
is an open access repository that collects the work of Arts et Métiers Institute of
Technology researchers and makes it freely available over the web where possible.
This is an author-deposited version published in: https://sam.ensam.eu
Handle ID: .http://hdl.handle.net/10985/17736
To cite this version :
Louise LE BARBENCHON, JeanBenoit KOPP, Jérémie GIRARDOT, Philippe VIOT
-Reinforcement of cellular materials with short fibres: Application to a bio-based cork multi-scale foam - Mechanics of Materials - Vol. 142, p.103271 - 2020
Any correspondence concerning this service should be sent to the repository
Reinforcement of cellular materials with short fibres: application to a
bio-based cork multi-scale foam
Louise Le Barbenchon1?, Jean-Benoît Kopp1, Jérémie Girardot1, and Philippe Viot1
1Arts et Métiers Institute of Technology, CNRS, I2M Bordeaux, Esplanade des Arts et Métiers, F-33405 Talence Cedex, France
Abstract. A bio-sourced foam, agglomerated cork, was chosen to evaluate the influence of short fibres on the mechanical behaviour of cellular materials. The final material was obtained by mixing cork particles with a thermoset resin. Rigid short fibres were then added before uni-axial compression. Enhancing the foam’s mechanical properties without increasing the density is a current problem in transport industries. In this article, we demonstrate how the addition of short fibres strongly modifies the mechanical behaviour of agglomerated foam materials. Dynamic Mechanical Analysis technique revealed that the glass temperature was greater for reinforced foams and more energy loss by heat in visco-elasticity was also noticed for this material. In quasi-static compression, rigidity was strongly enhanced, causing absorbed energy before densification to increase. Maximal force and displacement before fracture were studied by applying Mode I fracture tests, and both were improved by the addition of short fibres. The mesoscopic and microscopic observations revealed it was linked to fracture mechanisms, most of which happen inside cork beads for the reinforced cellular material. The properties of agglomerated foams may then be improved and tailoblack by the addtion of short fibres and make weight saving possible in several industrial applications.
Keywords: Cellular Material, Microstructure, Cork Agglomerate, Short fibres, Visco-elastic behaviour, Me-chanical Properties, Fracture
1 Introduction
Cellular materials are today widely used for a large range of application domains like transport, health, energy and sport. Their main characteristics are their low density, damping properties, thermal insulation and a capability to dissipate energy during impact loadings [1]. This last feature is especially interesting when considering passive safety applications. Depending on the level of stress re-quiblack, it is possible to modify their composition or structure [2]. However, today this is mainly done by changing the density of the cellular material [3]. As with low-density materials, it is always important to minimise the weight while enhancing the mechanical strength for specific applications [4]. The introduction of reinforce-ments is one of the most commonly used methods to im-prove the mechanical properties in usual composite mate-rials [5].
Fibres can be added while the foam is expanding. For rigid closed-cell polyurethane foams reinforced by glass fibres, fibres are located inside foam struts and cause lo-calised changes in the foam morphology [6, 7]. Young’s modulus is increased for reinforced foams. When fibres are organised in large bundles, they are not effective as a reinforcing agent because they cause stress concentration, thus weakening the structure. On the other hand, cellular materials in small bundles or lone fibres show longer frac-ture paths and pull-out fragments because of shear in the
?e-mail: louise.le_barbenchon@ensam.eu
radial struts. A toughening in the mechanical behaviour in then observed with the modification of the mechanism caused by the addition of fibres [8]. However, at extreme temperatures, reinforced foams are more brittle probably because of the difference in the thermal expansion coeffi-cients between fibres and polyurethane [7]. The addition of glass or aramid short fibres to an epoxy foam also im-proves the mechanical properties globally in shear and to a lesser extent in compression. Increasing fibre length does not have a significant benefit [9].
One of the main drawbacks of adding fibres while ex-panding foams is the difficulty in controlling fibre disper-sion and their layout in the material. Fibres also cause changes in the foam morphology during the foaming pro-cess [6, 7, 9].
To overcome these problems, cellular composites rein-forced with short fibres can be of interest [4]. They could ensure that the mechanical properties of foams could be tailoblack by controlling the compositions and microstruc-tures of the constituent phases, and also the fibre orienta-tion. Multi-scale foams [10] are also conceivable and are investigated here. They consist in agglomerated beads of foam [11]. Before agglomeration, short fibres are added to the preparation [12].
This study focuses on the influence of these short fibres on the foam microstructure and the mechanical behaviour of a multi-scale cellular material, agglomerated cork.
As such materials are mainly used in compression, the compressive mechanical behaviour of reinforced foam was first studied. The influence of the short fibres on the visco-elastic mechanical behaviour was studied using dynamic mechanical analysis (DMA). The mechanical behaviour for large strains was then studied in quasi-static regime only as it shows the same trends as in dynamic regime when comparing several type of cork agglomerate [13].
The reinforced foam interface, besides containing cork particles and resin, is enriched with short fibres. To know if this involves premature fracture of the material as al-ready observed for composite materials [14], mode I frac-ture tests were performed. In this kind of multiphase poly-mer cellular material, it is known that strong non-linear effects can occur during crack initiation and propagation as visco-plasticity effects [15, 16] and sometimes inertia effects [17]. A material parameter such as the critical en-ergy release rate GIc will therefore not be estimated here
as only the tensile strength will be analysed along with post-mortem fractographies.
In both compression and tensile loadings, microstruc-ture was studied after testing in order to determine associ-ated strain and failure mechanisms.
This article demonstrates how the addition of rigid short fibres increases the compressive stiffness of the ma-terial but also improves the fracture behaviour of cellular materials without changing the material mean density.
2 Material & Methods
2.1 Materials
Cork is a natural polymeric cellular material with a closed-cell structure [18]. It is formed by small anisotropic pris-matic cells arranged in successive layers exhibiting a rel-atively homogeneous honeycomb structure. The mean length of the cells is around 40 µm and the cell wall thick-ness around 1 µm.
Two agglomerated foam panels were studied, supplied by the Lieges HPK company: this is a classical cork ag-glomerate and one where short fibres have been added dur-ing the material preparation process. This material will be called the reinforced foam and was developed by Lieges HPK and Safran Power Unit for a common project. To obtain agglomerated cork, small beads of cork (with ini-tial diameter ∅c = 0.5 - 1 mm, density ρc= 170 kg m−3
and rigidity Ec = 20 MPa [18]) were mixed together in
a tank with polyfurfuryl alcohol (PFA), a bio-based ther-moset resin (with density ρr= 1128.5 kg m−3and rigidity
Er= 2.1 GPa [19]). For the reinforced material, rigid short
fibres from milled ex-PAN fibres were added afterwards (with diameter ∅f = 7 ± 2 µm, median length lf = 270 µm
and rigidity Ef= 230 GPa) while the mixing step was
con-tinued. This addition is the only difference between the two manufacturing methods.
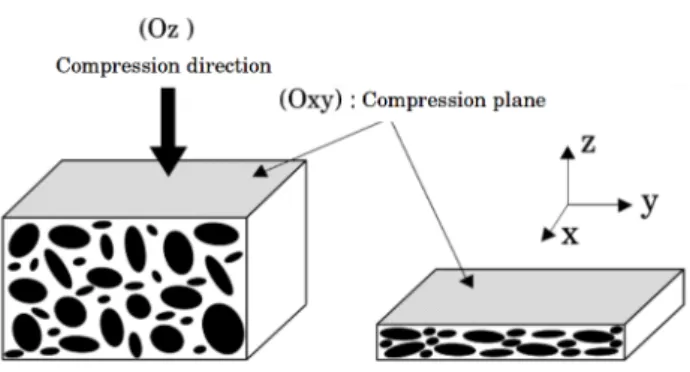
The material was then uni-axially compressed into a 1000×500×150 mm3 block. The compression caused a
preferential orientation in the bead shape. Fig. 1(a) shows the two resulting directions: directions in the (Oxy) plane are called in-plane directions (IP) and (Oz) direction is
called out-of-plane direction (OP) [20]. Afterwards the cross-linking was made under compression in an auto-clave. Slabs were then machined from the block where samples were collected.
Both materials were made with a cork/resin volume ra-tio of around 28:1 before compression. The volume frac-tion of short fibres added to the blending is around 0.02 % of the total volume for the reinforced agglomerate. The relative density is around 0.42, which is a high value in comparison to other cork agglomerates studied previously [21].
A multi-scale cellular material was thus obtained. Fig.1(b) shows the three scales that are consideblack here. First, the structure scale from which the material parame-ters will be deduced. After this the bead scale has milli-metric lengths. Beads can be defined by orientation, vol-ume and shape descriptors [20]. This scale shows several porosities between beads. Finally each bead is made of a cellular material. Therefore by looking more closely at the beads, cells can be spotted, here with a Scanning Elec-tron Microscope (SEM). This cell scale is characterised by micrometric lengths. Each bead has a specific cellular orientation [20]. Cork cells have variable dimensions [22] but also variable chemical compositions [23].
2.2 SEM observations
In order to observe the structure of cells and interfaces, SEM samples were cut with a razor blade, which was replaced for each cut. This was done in order to cause as little damage as possible to the cell walls [18]. Each cube was cut over-size and then trimmed to the final size (roughly 5 mm sides). Samples were then lightly coated with conductive gold to allow electron conduction at the sample surface. The device used was a Cressington 108 auto. The gold layer was presumed constant on the sample surface.
Samples were then observed with a SEM (Zeiss EVO HD 15). An accelerated tension of 10 keV was used with a current of 200 pA.
2.3 Visco-elastic behaviour
The viscoelastic behaviour was determined by means of Dynamic Mechanical Analysis (DMA) in compression mode with a Mettler Toleda I controlled by STARe soft-ware. The sample underwent repeated small-amplitude strains in a cyclic manner. Molecules perturbed in this way store a portion of the imparted energy elastically and dissipate a portion in the form of heat [24]. In this xas, the modulus acquires a complex form, E∗= E’ + iE”. The quantity E’, the storage modulus, is a measure of the en-ergy stoblack elastically, whereas E”, the loss modulus, is a measure of the energy lost as heat or molecular rear-rangements during the deformation [25]. The loss factor is defined as tan δ= E”/E’, δ being the angle between the in-phase and out-of-in-phase components in the cyclic motion.
Temperature scans were performed from -80 ◦C to
(a)Compression step in the fabrication process.
(b)Agglomerated cork observed at several magnifications.
(c)Reinforced agglomerated cork observed at several magnifications.
Figure 1. a) Compressive process and principal orientations of the material. b) Different observation scales demonstrating the multi-scale structure of the agglomerated cork obtained. c) Reinforced cork agglomerate observed at different scales. For both b) and c) at the agglomerate and bead scales, pictures are taken with a light microscope in the out-of-plane direction. Cells scale is illustrated with a SEM image of cork cells.
measurement at a 1 Hz frequency and an imposed dis-placement of 5 µm . Samples were cubic with a 5 mm side length, the corresponding nominal strain was then 0.1 %. and a pre-strain of 0.01 % was chosen. Such samples are consideblack as representative of the thermo-mechanical behaviour of such cork agglomerates because of the small grain size (especially after the fabrication process) [20]. As hygrometry deeply influences the me-chanical behaviour of polymers and thus cork [26], sam-ples were conditioned beforehand at a relative humidity of 50 %.
2.4 Mechanical behaviour under large strain 2.4.1 Quasi-static compressive tests
An electromechanical traction/compression machine (Zwick Roell 250 from Allround-Line, controlled com-pliance calibration certified by Cofrac) with a load cell capacity of 250 kN was used. Conditioned cubic samples with a side length of 20 mm were cut. The loading speed was set at 5 mm min−1. Mechanical behaviour was investigated in both directions (in-plane and out-of-plane) at room temperature (around 23◦C). For each experiment,
5 to 8 samples were tested. A good repeatability was observed provided that samples were preconditioned.
2.4.2 Post-processing of the compression tests From the force/machine displacement data, stress/strain curves were deduced by calculating macroscopic nom-inal stress (σ = F/S0) and macroscopic true strain
(ε = ln(l/l0)). As Poisson’s ratio for cork is close to 0, the
cross-section did not change during the compression test. As it can be challenging to clearly distinguish the linear part in polymeric cellular materials [27], the stress/strain curve was fitted with a seven degree polyno-mial. The end of the linear part of the curve was found with its second derivative minimum, i.e. when the tan-gent starts to decrease. A one degree polynomial was then calculated between ε= 0.01 and this point. Its slope cor-responds to Young’s modulus E given in this article. The tangent module Epwas defined as the slope of the plateau
stage between a 0.1 and a 0.3 strain. The elastic collapse stress σelmarks the end of the linear regime and the start of
the plateau stage. It was defined as the stress at which two first degree polynomials with a slope of E and Ep meet.
The densification strain εdwas identified as the energy
ef-ficiency maximum strain [3, 28].
Absorbed energy corresponds to the sum of dissipated and elastic energies. It was obtained by integrating along the displacement using the composite trapezoidal rule. Absorbed energy density at densification was calculated by integrating the force/displacement curve as far as the densification displacement dd. The energy found was then
divided by the sample initial volume.
For each material parameter, uncertainty was calcu-lated as the mean deviation. It gives the average of the ab-solute deviations of the observations from their arithmetic mean. Variation va/bof material parameters between two material parameters paand pbwas calculated according to
va/b= (pb− pa)/pa.
2.4.3 Fracture initiation tests
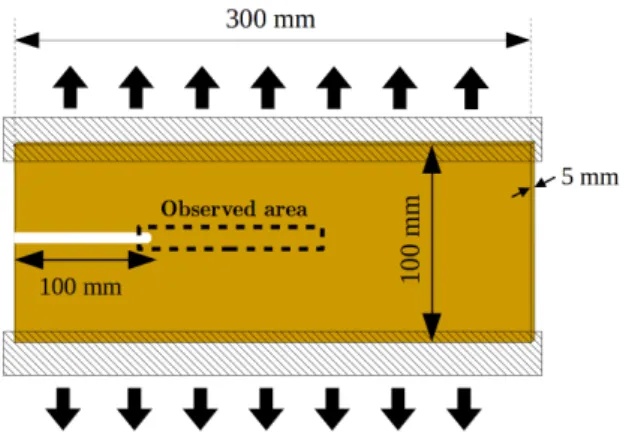
Mode I fracture loading was studied as it is the least energy-consuming mode for the material. Strip Band Specimen geometry (SBS) was chosen to study the frac-ture behaviour of both materials (Fig. 2). It consists in a rectangular slab of 300×100×5 mm3cut with a band-saw. An initial notch of 100 mm was also machined into the sample with the band-saw to disregard border effects as much as possible and to localise crack initiation. The tip was shaped as a u-notch using a rotary tool. This shape was chosen to obtain a larget crack length.
Samples were observed with a Keyence light micro-scope at 100× magnification. The area near the notch was especially carefully observed. It is depicted by the black dotted line in Fig. 2. Pictures of 5500×3000 pixels were obtained. Samples were conditioned after these observa-tions. The same sample was also observed after testing and was compablack to the non-tested picture.
Figure 2. Set-up used to study fracture behaviour with SBS ge-ometry. The black dotted line indicates the area observed with a light microscope before and after testing.
The same electro-mechanical traction/compression machine than previously was used. Displacement was im-posed at a specific displacement rate until total degradation of the plate (10 mm/min). This relatively quick displace-ment rate was chosen in order to limit the activation of the
viscoelastic cork mechanisms (such as stress relaxation) [29].
From the force/displacement curve (Fig.7(a)), the ini-tial slope was measublack and assimilated to the iniini-tial stiffness, K. The maximal force reached during the test was identified as the fracture force Ff rac. The
correspond-ing fracture displacement was called df rac. Due to the
imposed displacement rate, the displacement of the plate kept increasing while the force was decreasing because of the sample fracture. When the plate was fully broken, the force was null and stable. At this stable force, the final dis-placement was called dmax. The difference between df rac
and dmaxwas also calculated and was called∆d.
Crack propagation was observed with a Canon EOS 5D camera at a 2 Hz frequency.
3 Results
& Discussion
3.1 Microstructure
Both cellular materials have a very similar structure as can be observed in Fig.1(b) and 1(c). Apart from the inter-faces, no major discrepancies were observed at the ag-glomerate, bead and cell scales. Macroscopic porosities can be seen in both samples (as in Fig. 3(c)). Using data from a previous study [20], the macroscopic porosity to-tal volume was estimated to represent 10 % of the sample total volume for both materials.
3.1.1 Interphases
Previous work on agglomerated cork revealed that for this kind of materials, interfaces are very thin (around 1 µm) [20].The anisotropic nature of cork cells [18] can help to distinguish one bead from another. Fig. 3(a) shows that in-stead of considering only the sharp resin/particle interface, an interfacial area called the interphase should be conside-black [30]. This is composed of collapsed cells at the bead periphery and resin coating the cork surface [20, 31] and will display a high gradient in its mechanical properties. The thickness of the interphase is variable but is around 30 µm, as shown in Fig. 3(a).
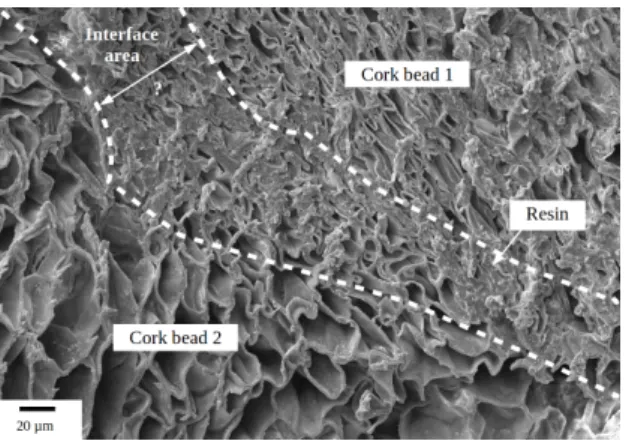
The composite material also presents an interphase with collapsed cells in the vicinity of the interface as shown in Fig.3(b). Resin also forms a thin film at the par-ticle surface. Interphases are thicker, however (around 50 µm) because of the fibres between the cork particles. The fibres appear to be well dispersed and are present between each bead. Like the beads, most of thel seem to be coated with resin. They often organise themselves into bundles of a few coated fibres. Their average diameter (around 20 µm) is much smaller thanthat of the foam beads (around 300 µm [20]).
3.1.2 Fibre placement and orientation
Fig. 3(c) shows that short fibres never damage a foam bead by going across it. For the most part they lie tangentially to the foam beads. As the small mean length of chopped
(a)Intergranular interphases in the unreinforced foam [20].
(b)Intergranular interphases in the reinforced foam.
(c)Short fibres arrangement in the reinforced foam.
Figure 3. SEM pictures of the interphases in cork-based com-posites.
short fibres is around 230 µm, they fit fairly well onto the bead surface.
As already noted, uniaxial compression manufacturing process causes a transversal anisotropy for high density foam agglomerates [20, 31]. Beads of the cellular mate-rial tend to be flattened in the compression plane, i.e. the (Oxy) plane, as shown in the Fig.1(a) and are much more oriented in this plane as proved by X-ray tomography ob-servations [20]. Interphases between beads are then more oriented in this same plane, the in-plane direction. Short fibres are then more oriented in the (Oxy) plane.
3.2 Visco-elastic compressive behaviour
3.2.1 Description of the visco-elastic behaviour of cork agglomerates
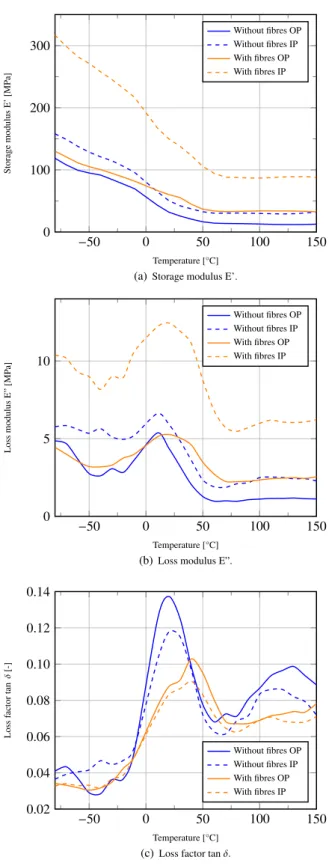
Compressive DMA results are shown in Fig. 4 for the cork agglomerate and the reinforced foam samples tested in the out-of-plane and the in-plane directions. For each type of sample the storage modulus (E’), the loss modulus (E”) and the loss factor (tan δ) are presented in Fig. 4(a), Fig. 4(b) and Fig. 4(c).
Fig. 4(a) shows that for each type of sample, the stor-age modulus decreases with increasing temperature due to the softening of the cell wall material, as already noted for raw cork and other cork agglomerates [24, 26, 32]. A sim-ilar tendency concerning the storage modulus was found for other cork agglomerates with PFA resin [32].
In the early stages of the experiment (ca -80◦C), a
de-crease in E’ is noticed. This is related to the occurrence of a relaxational process. This relaxation is also observed in the tan δ plot in Fig.4(c) and the loss modulus plot in Fig.4(b), where a small peak is observed at this temper-ature. This dynamic transition can be assigned to a β-relaxation of one of the main cork cell wall components, suberin [26].
From -10◦C to 50◦C, a stronger decrease in E’ is ob-served. The broad peak on the tan δ plot indicates the same relaxational process that was previously identified as an α-transition of some of the components of cork cell wall [26]. A glass transition is then identified at the tan δ peak maximum (given in Tab. 1).
The tan δ peak observed in Fig.4(c) from 80◦ C to above 150◦ C could be due to two processes. The first one is the α-relaxation of the resin and was observed for other cork agglomerates with a similar resin [32]. The glass transition temperature of this resin occurs between 70◦ C and 130◦ C depending on the cross-linking condi-tions [32]. However, on the E’ curve, the storage modulus seems to be rather constant in this temperature range as the rubbery plateau of cork components is reached. The α-transition of the resin does not seem to influence the rigidity of the material very much. A relaxation peak was also observed for raw cork at around 80◦C but was shifted
to a higher temperature and decreased in intensity for an annealed sample. The second process could then be des-orption of water molecules in the cork structure [24].
3.2.2 Effect of short fibres on the visco-elastic behaviour of agglomerated foams
When comparing storage moduli E’ of cork agglomerate samples and reinforced foam ones in Fig. 4(a), as ex-pected the storage modulus is greater for the reinforced foam samples. Short fibres are indeed much more rigid (Ef = 230 GPa) than the matrix or cork particles.
A more unexpected result in the modification of the tan δ peak corresponds to the α-relaxation in Fig. 4(c). It is less intense but wider and the maximum is shifted to higher temperatures. Tab. 1 shows that from 20◦ C for
−50 0 50 100 150 0 100 200 300 Temperature [°C] Storage modulus E’ [MP a] Without fibres OP Without fibres IP With fibres OP With fibres IP
(a) Storage modulus E’.
−50 0 50 100 150 0 5 10 Temperature [°C] Loss modulus E” [MP a] Without fibres OP Without fibres IP With fibres OP With fibres IP
(b)Loss modulus E”.
−50 0 50 100 150 0.02 0.04 0.06 0.08 0.10 0.12 0.14 Temperature [°C] Loss factor tan δ [-] Without fibres OP Without fibres IP With fibres OP With fibres IP
(c)Loss factor tan δ.
Figure 4. Compressive DMA spectra of a reinforced cork ag-glomerate and a classic cork agag-glomerate at a 1 Hz frequency in the in-plane (IP) and out-of-plane (OP) directions.
foam. This would mean that polymer chains in cork cell walls are more constrained in the presence of short fibres compablack to a classic cork agglomerate because of the mismatch in thermal expansion coefficient which is rela-tively low for ex-PAN fibres in comparison to polymers [33].
The loss modulus E” in Fig. 4(b) indicates the viscous nature of the material. As reinforced samples loaded in the out-of-plane direction show E” values that are higher but with a similar evolution than the non-reinforced samples, the viscosity of the material does not seem to be changed by the addition of fibres.
The damping tan δ of cork agglomerates is decreased by adding fibres. This suggests a good adhesion in the reinforced agglomerate and interfacial bonding plays its role in transferring the load. It should be noted that the damping capacity associated with the surface area of the tan δ curve in reinforced agglomerates remains close to that of classical cork agglomerate as shown in Tab. 1. The surface in the out-of-plane (in-plane) direction decreases by 17 % (7 %). The first reason is that the tan δ peak is larger for reinforced agglomerates. The other is that even if the rigidity increases with the presence of fibres, E” also increases, as explained previously.
Material Tg[◦C] Area [◦C] Agglomerated cork OP 20.2 7.56 Reinforced foam OP 40.3 6.39 Fibre effect OP - - 17 % Agglomerated cork IP 20.2 6.27 Reinforced foam IP 40.3 5.81 Fibre effect IP - - 7 % Table 1. Data extracted from DMA analysis. Glass transition Tg
measublack at the tan δ maximum. Area under tan δ between -20◦
C and 70◦
C at 1 Hz in compression.
3.2.3 Effect of short fibre orientation on the
visco-elastic behaviour of agglomerated foams The increase in rigidity caused by short fibres is much more obvious for in-plane samples. As the microstruc-ture observations showed, fibres lie along the bead sur-face. Like beads, fibres will tend to align in the in-plane direction. They will be more solicited when loading hap-pens in this direction. As fibres are more solicited, the is likely to be more friction. This explains why the in-plane reinforced sample in Fig. 4(b) shows a much higher E” compablack with the out-of-plane sample loss modulus, which is similar to non-reinforced samples. As in tradi-tional composites, the storage modulus and the loss modu-lus depend strongly on the orientation of the fibres with the direction of oscillation [33]. The contribution of the inter-facial region to the dynamic properties is more significant when the fibre-dominated properties are measublack.
As for the damping properties, it seems that for both materials, samples tested in the out-of-plane direction show a more intense peak in the tan δ plot (Fig. 4(c)) and
thus a greater area underneath. However, the higher rigid-ity in the in-plane direction compensates for the higher en-ergy lost by heat in the in-plane direction and they seem to compensate each other, for both types of material.
3.3 Compressive behaviour for large strains Cellular materials are partly used for their energy ab-sorption properties in compression. The compressive be-haviour of the two materials has thus been studied for quasi-static loading to investigate the influence of short fi-bres on the mechanical behaviour for large strains.
3.3.1 Macroscopic behaviour in compression
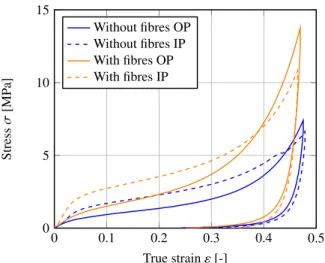
Fig. 5 displays the raw stress/strain curves of each material tested in out-of-plane (OP) or in-plane (IP) direction.
0 0.1 0.2 0.3 0.4 0.5 0 5 10 15 True strain ε [-] Stress σ [MP a] Without fibres OP Without fibres IP With fibres OP With fibres IP
Figure 5. Experimental strain/stress curves of agglomerate cork and of reinforced foam tested in in-plane (IP) and out-of-plane (OP) directions at 5 mm/min at 26◦
C.
For both materials, a typical foam-like behaviour is no-ticed [3, 34]. For small strains, they show a linear stress-strain regime. Its slope is characterised by the Young’s modulus E. Afterwards stress increases slowly until large strains. This stage is called the plateau stage and is charac-terised by an elastic collapse stress σel(where the plateau
stage starts). Tangent modulus Ep expresses how the
plateau increases due to gas compression [3]. Finally stress increases sharply around εd. This is called
densi-fication.
All material parameters described above (E, σp, Ep,
εd andEd) were calculated for the agglomerated cork and
the reinforced foam. Their values for each material and direction can be found in Tab.2.
3.3.2 Fibre effect
The comparison of the strain-stress curves indicates no major discrepancies in global mechanical behaviour. Both demonstrate a foam-like behaviour in compression with
the three distinctive stages: linear behaviour, plateau and densification.
In both directions, many material parameters are en-hanced by the addition of fibres as indicated by Tab. 2. The Young’s modulus increases by 26 and 71 %, in the out-of-plane and in-out-of-plane direction, respectively. The elastic col-lapse stress rises to 30 % (40 %) in the out-of-plane (in-plane) direction. The tangent modulus and the absorbed energy at densification are both also greater for the rein-forced foam, by 81 % (53 %) in the out-of-plane (in-plane) direction.
Thus by comparing Young’s modulus, the same con-clusion is reached as for DMA tests: fibres stiffen foam agglomerates. As compression is pursued at a wider range here, a more complete analysis can be made. When so-licited, fibres enhance the rigidity of the interfaces. This leads to a more rigid cellular material, which is charac-terised (in addition to the Young’s modulus) by a higher stress plateau and thus more absorbed energy during com-pression than observed for other types of reinforced cellu-lar materials [35].
Conversely densification strain εd does not vary
be-tween agglomerated cork and the reinforced foam. The stability of the densification strain is because the densifi-cation happens when many cells are folded. Thus it does not depend on the material rigidity. Nonetheless, densifi-cation stress will be higher for the reinforced cellular ma-terial because it is stiffer than the material without fibres. To reach such strain, much more stress will be needed.
No such enhancement in the compressive mechanical properties could be observed for graphene-enriched ag-glomerated cork material [36]. The shape, quantity and size of reinforcements used, while not especially opti-mised here seem well suited to improving the mechanical behaviour of multi-scale cellular materials like cork ag-glomerates.
3.3.3 Fibre orientation effect
Discrepancies in material parameters between in-plane and out-of-plane directions were hinted at in the previous section. Tab.3 shows how the anisotropy is modified by the presence of fibres for a large strain. It shows that the rein-forced foam displays a modified anisotropy in the material parameters compablack to classical high density cork ag-glomerates.
The enhancement due to the fibres is more present in the plateau stage for the out-of-plane direction (see Epin
Tab.2). The anisotropy difference of E shown in Tab.3 around 88 & between agglomerated cork and the rein-forced foam shows that on the other hand mechanical be-haviour increases strongly from the linear stage in the in-plane direction (Tab.2).
As reported before, high density agglomerated foam obtained by uni-axial compression displays an anisotropic mechanical behaviour [31] caused by an anisotropic mi-crostructure at the bead scale [20]. X-ray tomography analysis showed that after the fabrication process, beads are flattened in the compression plane, i.e. in the in-plane
Material E [MPa] σel[MPa] Ep[MPa] εd[-] Ed[J/mm3] Agglomerated cork OP 22.0 ± 1 0.83 ± 0.06 4.83 ± 0.34 0.38 ± 0.002 0.53 ± 0.06 Reinforced foam OP 27.7 ± 1.9 1.08 ± 0.04 8.74 ± 0.13 0.379 ± 0.001 0.92 ± 0.02 Fibre effect OP + 26 % + 30 % + 81 % + 0 % + 74 % Agglomerated cork IP 37.1 ± 1.3 1.46 ± 0.07 4.48 ± 0.48 0.421 ± 0.007 0.94 ± 0.06 Reinforced foam IP 63.6 ± 4.3 2.04 ± 0.03 6.86 ± 0.19 0.407 ± 0.001 1.39 ± 0.02 Fibre effect IP + 71 % + 40 % + 53 % -3 % + 48 %
Table 2. Material parameters of agglomerated cork and reinforced foam tested in the out-of-plane direction (OP) and in the in-plane direction (IP).
Material E [MPa] σel[MPa] Ep[MPa] εd[-] Ed[J/mm3]
Anisotropy in agglomerated cork + 69 % + 76 % - 7 % + 11 % + 77 % Anisotropy in reinforced foam + 130 % + 89 % - 22 % + 7 % + 51 % Fibre effect + 88 % + 17 % + 214 % - 36 % - 34 %
Table 3. Difference in percentage between out-of-plane and in-plane directions for material compression parameters of agglomerated cork and reinforced foam.
direction [20]. As short fibres lie along these beads, ac-cording to SEM pictures, fibres will be more oriented in the in-plane direction. Interfaces are then stiffer in this di-rection. Short fibres constitute a stiff and anisotropic net-work that is added to the already anisotropic material. This explains why the anisotropy is higher in the composite ma-terial.
This preferential orientation also implies that depend-ing on the solicitation direction, fibres will carry more load in a specific direction for the same strain values and thus the for same strain mechanisms. When the reinforced foam is compressed in the out-of-plane direction, fibres are mostly oriented perpendicularly to this direction. They are thus mainly solicited in bending but foam beads will tend to deform before them. This is why their effect is mostly observed after the elastic collapse. On the other hand when the sample is compressed in the in-plane direction, fibres are placed randomly. In order to deform the reinforced foam, fibres will then be solicited either in bending, ten-sion or shear depending on their orientation. This explains why the Young’s modulus and the elastic collapse stress are more enhanced in the in-plane direction.
3.3.4 Post-mortem observations at the microscopic scale for compression tests
Both cellular materials were observed after compression. In in-plane and out-of-plane compression directions, ob-servations are very similar at the cell scale.
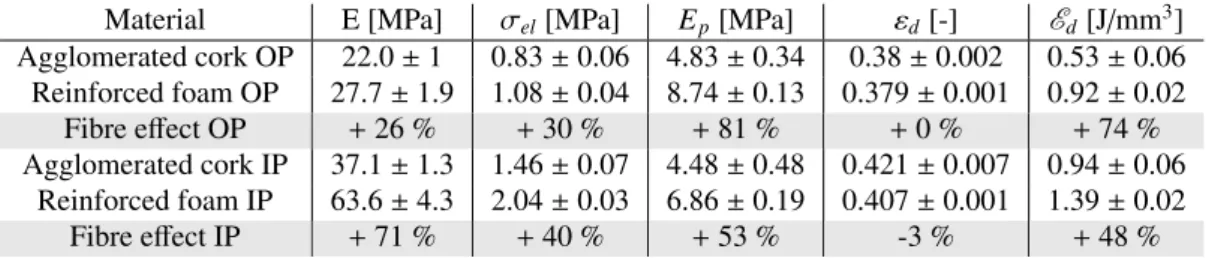
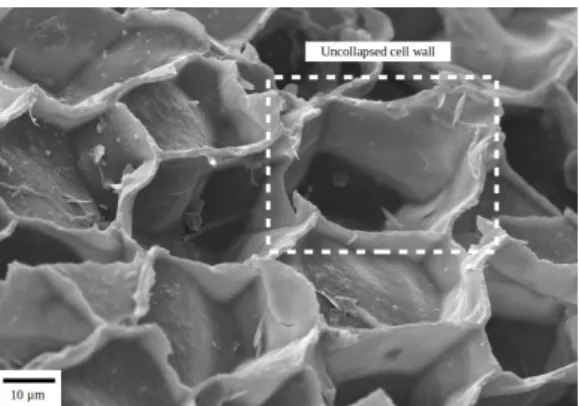
Shortly after the end of the loading many cells are still collapsed in the loading direction as can be seen in Fig. 6(a). Cells are collapsed mainly in the loading di-rection. However, according to the local geometry of the bead arrangement, cells can also be collapsed in other di-rections. So even if the macroscopic loading is uniax-ial, because of the complex microstructure, mixed loading modes appear at the microscopic scale.
Observations of the compression surface in Fig. 6(b) show collapsed walls. Some cells were unfolded during
the unloading or, because of the high viscosity of the ma-terial [20], will be unfolded later. That is why the height of the sample keeps increasing slowly, even after the end of the test. However, some of the foam cells will stay col-lapsed, even after a long time.
SEM observations are very similar for the two materi-als. For each type of material, collapsed cells are mostly at the bead periphery after compression, near the inter-faces and thus increasing the interphase area observed in Fig. 3(a) and 3(b). Some beads have all their cells col-lapsed.
Strain mechanisms in compression are therefore not fundamentally different between agglomerated cork and reinforced foam and are close to that presented in a pre-vious work [20]. They are simply a continuation of the damaging process started by the fabrication process and the interphase creation.
3.4 Fracture Behaviour
The fracture behaviour in mode I was studied in the out-of-plane direction for cork agglomerate and the reinforced foam as it was identified as a critical loading mode (worst-case scenario). In the base cellular material, cork, com-pression and tension imply very different strain, damage and fracture mechanisms. While compression is mostly about buckling [3], when tension is applied to cork, the cell walls become straighter and aligned in the direction of tension. Further deformation occurs by stretching of the walls [37], before fracture.
The two materials studied here are multi-scale materi-als. They are constituted by cellular foam beads agglom-erated together. Competition between the interfaces and bead toughness is expected in the strain and fracture mech-anisms. Besides the macroscopic behaviour of the mate-rial, optical and electronic observations of the crack path and of the crack surface are thus of interest.
(a)Profile observation of a reinforced agglomerated foam compressed in the out-of-plane direction.
(b)Surface observation of agglomerated foam compressed in the out-of-plane direction.
Figure 6. Surface and profile of compressed agglomerated foams observed with a SEM.
3.4.1 Macroscopic behaviour in fracture
The fracture behaviour of both multi-scale materials is shown in Fig.7(a). In this figure, the evolution of force as a function of the device displacement is plotted. Both curves display a first linear force/displacement behaviour and then a strain-softening is observed. The same be-haviour was observed for cork [37]. The strain-softening could be related to the material viscosity and the material damaging.
As the agglomerated and reinforced cork are both made of randomly oriented cork beads, the three main di-rections and their combinations can be found. However, the serrations observed in the stress/strain curve for radial tension in raw cork [37] are not observed here in multi-scale foams. The localized fracture events causing these serrations might not then happen in agglomerate foams, contrary to the bulk cellular material.
As summarised in Tab.4, discrepancies can be seen be-tween the reinforced foam and the non-reinforced mate-rial. This table shows several parameters measublack with the help of the force/displacement curve for the agglom-erated cork and the reinforced foam. The initial stiffness (measublack as the initial slope) is much higher (+ 84 %) for the reinforced foam. Enhancement of the stiffness by the addition of short fibres is much greater than for cork
agglomerates reinforced by large coconut fibres, which was around + 27 % in tension with a specific coupling agent [38]. This increase in the stiffness is more likely, as for compression, directly linked to the high stiffness of short fibres (230 GPa) even given their small volume ratio. Greater strain softening or non-linear behaviour is also noticed for this sample before fracture. Adding fibres to the agglomerated cork does not enhance viscous effects as previously mentioned. Damage mechanisms are prob-ably modified, as has already been observed in short fibre reinforced polymers [39].
Tab.4 shows a much higher force Frupt (+ 70 %) and
displacement drupt (+ 84 %) before the beginning of the
crack propagation for the reinforced cork than for the non-reinforced agglomerate. This higher force is probably also linked to fibre stiffness. The higher displacement before fracture indicates that the reinforced foam is tougher be-fore crack initiation. Damage mechanisms would thus be less critical in this material than in classical agglomerated cork. This may be due to the confinement of these dam-ages in the vicinity of the short fibres, at the interface, as already observed for reinforced polyurethane foams [8]. And despite modifying (without optimising) the interfaces by the addition of short fibres, the chemical bond between cork beads, matrix and fibres seems relatively good as pre-viously noticed for cork agglomerates with PFA resin [32]. Another remarkable measurement is∆d, the distance between druptand dmax. It quantifies how much the sample
still needs to be elongated before complete fracture. For the reinforced cellular material, this resistance to crack propagation ∆d is increased by +230 %. Fig.7(d) shows how the crack total length varies as a function of time. Regarding agglomerated cork, crack propagation happens very fast. There are only a few points of measurement. After 3 seconds, the crack has crossed the entire specimen. On the other hand, it takes around 3.5 times longer for the crack to fully propagate in the reinforced foam. For small displacements, the crack seems even not to propagate at all. The addition of short fibres seems thus to also increase resistance against damage extension as it slows down the crack propagation.
At the macroscopic scale, the crack follows a straight path, as observed in Fig.7(b) and Fig.7(c). At the bead scale, however, fibres could act as a field disruptive ele-ment. Because of confinement near the fibres, a greater loading and displacement would be needed for the crack to propagate further. A similar influence was reported for soil reinforced by short polypropylene fibres [40]. Fibre addition in such granular media would seem to limit the further development of tension crack thanks to a bridge ef-fect. It also changed the cemented soil’s brittle behaviour to a more ductile one as it is observed for cork agglomer-ate.
3.4.2 Post-mortem observations at the microscopic scale for fissuration tests
After testing, samples were observed in order to identify underlying mechanisms. The area near crack initiation and the crack path on the sample (marked by the black
Material df rac[mm] dmax[mm] ∆d [mm] Ff rac[N] K [N/mm]
Agglomerated cork 1 1.3 0.3 475 832
Reinforced foam 1.7 2.7 1 875 1531
Fibre effect +70 % +108 % +230 % +84 % +84 %
Table 4. Material parameters obtained from mode I fracture tests in the out-of-plane direction for agglomerated cork and for reinforced foam. 0 0.5 1 1.5 2 2.5 3 0 200 400 600 800 1,000 1,200 Ff rac df rac dmax • • • • ∆d Displacement [mm] F orce [N] Without fibres With fibres
(a) Force/displacement curves
(b)Fracture path of agglomerated cork drawn on sample before testing.
(c) Fracture path of reinforced foam drawn on sample before testing.
0 2 4 6 8 10 12 0 50 100 150 200 Time [s] Crack total length [mm] Without fibres With fibres
(d)Crack length evolution
Figure 7. Experimental displacement/force curves obtained from mode I fracture tests. Effect of adding short fibres on the mechanical behaviour of an agglomerated cellular material..
dotted line on Fig. 2) were studied first. By comparing oictures of fractublack samples with the picture taken near the same area before testing, the fracture path was drawn with a white dotted line on the non-tested sample surface (Fig. 7(b) & 7(c)). On both pictures, almost exclusively intraparticular fracture can be observed. This means that between foam and matrix, the cellular material is the one that breaks before the matrix under tension. This confirms the good interfacial adhesion between cork and the PFA matrix [32], even after the addition of fibres.
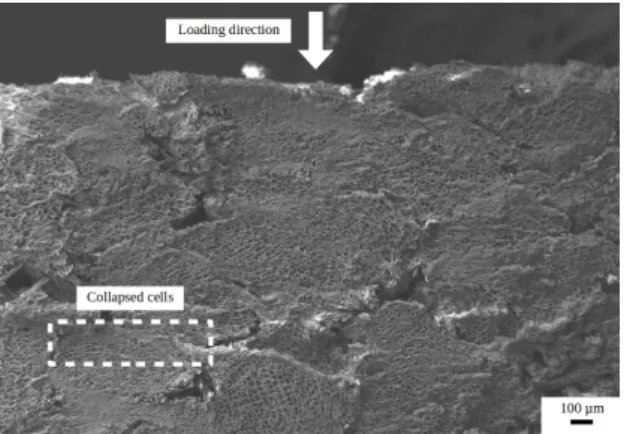
Nevertheless two types of intraparticular fracture have to be distinguished as schematised in Fig. 8. The first is the intraparticular fracture going straight across the bead, as shown in Fig. 8(a). This will be called the internal intra-particular fracture. The other one visible in Fig. 8(b) is an intraparticular fracture occuring near the interface between two foam beads. This will be called a peripheral intra-particular fracture. More internal intraintra-particular fractures could be observed for reinforced agglomerated foam.
(a)Internal fracture. (b)Peripheral fracture.
Figure 8. Scheme of the two types of intraparticular fracture observed for multiscale foams after mode I fracture tests.
Fractublack surfaces and profiles are observed with a SEM in order to better understand the numerous fracture mechanisms in both materials. Confirming the optical mi-croscope observation, no fracture is observed in the bulk resin. This means there is no fracture at the interface be-tween two beads. Nor was any bead/matrix decohesion observed for either material.
By observing the fracture surface, the radial direction (hexagonal cells) seems quite present like in Fig. 9(b) and Fig. 9(d). It could come from the different fracture tough-nesses of the cork directions. KIC= 94 ± 16 kPa m1/2for
non-radial direction and KIC= 125 ± 14 kPa m1/2for the
radial direction [37]. To these two toughness values, two fracture mechanisms can be linked. The first for radial tension occurs by transverse breaking of the lateral cell
walls. The other, for non-radial tension, occurs along the walls, which are longitudinally split into two half-walls. However, it is hard to tell whether both these mechanisms happen in agglomerated foam or not. The material mi-crostructure is indeed very intricate. Apart from radial ori-entation, a quite random orientation of cork cells seems still to be observed. So fracture happens in cork beads, not only in one privileged direction. The anisotropic nature of cork cells could thus matter here in fracture mechanisms of a randomly oriented foam with anisotropic cells but it is not the only parameter to take into account (bead size, orientation, interfaces, cell wall thickness, etc.).
As observed with light microscopy, the two types of intraparticular fracture can be found for both types of foam. Internal intraparticular fracture is noticeable by un-collapsed cell walls. The profile of such fracture across the bead is shown in Fig.9(a). Cells near the crack are fairly undamaged. Microscopic cracks were spotted in the vicin-ity of the main crack. Fig. 9(b) shows the fracture surface. Cell walls are straight even if they can sometimes be quite damaged.
By looking at the SEM picture of the profile of periph-eral intraparticular fracture in Fig.9(c), this type of fracture seems to happen in the already reported pre-collapsed area caused by the fabrication process [20] identified here as the interphase. Indeed, the fracture surface in Fig.9(d) dis-plays cells with plastically deformed cell walls. They are very similar to the collapsed cell walls observed after com-pression in Fig. 6(b). The presence of resin just behind the damaged cells could also be seen. This indicates that the damaged cells in this picture are just behind the interface. This pre-collapsed zone caused by the fabrication process could imply some pre-damaging of cork cells and thus an important gradient in the mechanical properties leading to the peripheral intraparticular fracture mostly observed for both materials happening in the interphase.
When comparing the two materials, the same obser-vation can be made as for the light microscope observa-tions. The reinforced foam displays a bit more internal intraparticular fracture as some cork cell walls are not col-lapsed when the surface of the fracture was observed. It is not clear, however, whether this is happening at specific places (like crack cessation) or not because of the high heterogeneity of the material. This kind of fracture could be due to crack confinement caused by fibres at the inter-face when the crack passes to another bead. Depending on the local mechanical state, it could lead to the crack go-ing through the bead rather than through damaged cells. Undamaged fractublack cork cells could be less resilient than pre-damaged cells. This could also explain why∆d is much greater for the reinforced foam.
Resin/fibre debonding is only occasionally noticed for the reinforced foam. Fig.9(e) is a SEM picture of the frac-ture surface of the reinforced foam. It shows one cork bead with collapsed cells coveblack with resin. No fibres can be observed at its surface. This indicates that the fracture happened between the matrix and the fibres that can be seen on the other side of the crack. The adhesion between resin and fibres could thus be optimised to improve the re-inforced material mechanical behaviour in tension [41].
4 Conclusions
In this article, the reinforcement of cellular materials by rigid short fibres was studied. The composite material con-sisted of beads of polymeric cellular material (here cork) mixed together with a PFA thermosetting resin and short fibres then uni-axially compressed together before poly-merisation in an oven.
• Considering the macroscopic scale, the addition of short fibres improves the compressive and the mode I frac-ture behaviour much more than long fibres or graphene nanoplates while keeping a foam-like behaviour and a low density.
The glass transition of reinforced agglomerates is shifted to higher temperatures because short fibres seem to constrain polymer chains. Damping properties de-pend strongly on fibres being oriented with the direction of solicitation.
In compression under large strain, apart from the densi-fication strain, all other material parameters were largely enhanced by the addition of short fibres. A more greater difference between in-plane and out-of-plane direction mechanical behaviour was noticed. This supplementary anisotropy was correlated with the preferential orienta-tion of the short fibres observed in the in-plane direcorienta-tion. The fracture behaviour of cork agglomerates is im-proved by the addition of short fibres. Forces reached by the reinforced material before fracture were more than 80 % higher than for the non-reinforced one. Maximal displacements and initial stiffness were also increased by at least 70 % by the addition of fibres. Finally, dis-placement before complete fracture∆d is much greater for the reinforced foam (by 125 %). This shows that the addition of fibres increases the resistance to damage extension.
• Microscopic observations indicated that, as for mech-anisms in compression, short fibres do not seem to change them fundamentally. However, because of the intricate microstructure of both materials, a simple load-ing like uni-axial compression seems to lead to mixed strain modes at the bead and cell scales.
Conversely, the addition of short fibres strongly influ-enced the fracture mechanisms. The fracture path was mostly intraparticular for both cellular materials. The non-reinforced material showed fractures mainly inside the beads but in the interphase, in the vicinity of its inter-faces where cells are pre-collapsed because of the com-pression process. As for the reinforced foam, a little more fracture across the beads was also observed. Fi-bres at the interface might then orientate the crack path by confining the crack.
In order to tailor and enhance cellular material me-chanical properties, multi-scale foams and short rigid fi-bres seem an interesting alternative. Further improve-ments can be achieved by using fibres with optimised length, amount [9] or surface treatments such as coupling agent specifically tailoblack to the particular resin [41]. Fi-nally studying fracture mechanisms of multi-scale cellular
(a)Profile observation of an internal intraparticular fracture zone. (b)Surface observation of cells in an internal intraparticular fracture zone
(c) Profile observation of a peripheral intraparticular fracture zone. (d)Surface observation of collapsed cells in the peripheral intrapartic-ular fracture zone.
(e)Fibre/resin debonding.
Figure 9. Fracture surface and profile observed with a SEM of multiscale foams after mode I fracture tests.
materials seems consistent for better capturing changes in material interfaces, such as the addition of fibres in this case.
Acknowledgements
This work was performed in the framework of the LIAMA project (supported by Lieges HPK, Safran Power Unit (PU) and Région Nouvelle Aquitaine). The authors are very grateful to Agnès de Montbrun and Olivier Pauly from Lieges HPK and Romain Quinton from Safran PU for their scientific and technical contributions to this study. The authors are grateful that DMA tests were performed by the CANOE platform.
References
[1] N.J. Mills, C. Fitzgerald, A. Gilchrist, R. Verdejo, Composites Science and Technology 63, 2389 (2003)
[2] L. Maheo, P. Viot, International Journal of Impact Engineering 53, 84 (2013)
[3] L.J. Gibson, M.F. Ashby, Cellular Solids: Structure and Properties (Cambridge University Press, Ox-ford, 1997)
[4] Z. Hu, K. Thiyagarajan, A. Bhusal, T. Letcher, Q.H. Fan, Q. Liu, D. Salem, Composites Part B: Engineer-ing 121, 108 (2017)
[5] P. Boisse, Composite Reinforcements for Optimum Performance(2011), ISBN 9781845699659
[6] T.C. Cotgreave, J.B. Shortall, Journal of Materials Science (1977)
[7] A.G. Denay, S. Castagnet, A. Roy, G. Alise, C. Cour-sault, D. Mellier, Journal of Cellular Plastics (2012) [8] T. Cotgreave, J.B. Shortall, Journal of Materials
Sci-ence (1978)
[9] M.V. Alonso, M.L. Auad, S. Nutt, Composites Part A: Applied Science and Manufacturing (2006) [10] L. Maheo, P. Viot, D. Bernard, A. Chirazi, G. Ceglia,
V. Schmitt, O. Mondain-Monval, Composites Part B: Engineering 44, 172 (2013)
[11] P. Viot, D. Bernard, Computational Methods and Ex-periments in Materials Characterisation III I, 197 (2007)
[12] L. Le Barbenchon, J. Girardot, J.B. Kopp, P. Viot, Strain Rate Effect on the Compressive Behaviour of Reinforced Cork Agglomerates, in EPJ Web of Con-ferences(2018), Vol. 183, p. 3018
[13] P.T. Santos, S. Pinto, P.A. Marques, A.B. Pereira, R.J. Alves de Sousa, Composite Structures 178, 277 (2017)
[14] D.H. Grande, J.F. Mandell, K.C. Hong, Journal of Materials Science 23, 311 (1988)
[15] J. Lemaitre, Engineering Fracture Mechanics 25, 523 (1986)
[16] M.P. Wnuk, W.G. Knauss, International Journal of Solids and Structures 6, 995 (1970)
[17] J.B. Kopp, C. Fond, G. Hochstetter, Engineering Fracture Mechanics 202, 445 (2018)
[18] L.J. Gibson, K.E. Easterling, M.F. Ashby, Proceed-ings of the Royal Society A: Mathematical, Physical and Engineering Sciences 377, 99 (1981)
[19] R. Kumar, R. Anandjiwala, Process for preparing polyfurfuryl alcohol products(2012)
[20] L. Le Barbenchon, J. Girardot, J.B. Kopp, P. Viot, Materialia 5, 100219 (2019)
[21] R. Jardin, F. Fernandes, A. Pereira, R. Alves de Sousa, Materials Design 68, 121 (2015)
[22] A. Lagorce-Tachon, T. Karbowiak, C. Loupiac, A. Gaudry, F. Ott, C. Alba-Simionesco, R.D.
Gougeon, V. Alcantara, D. Mannes, A. Kaestner et al., Journal of Food Engineering 149, 214 (2015) [23] H. Pereira, BioResources 8, 2246 (2013)
[24] J.F. Mano, Journal of Materials Science 37, 257 (2002)
[25] N.G. Karsli, A. Aytac, Composites Part B: Engineer-ing 51, 270 (2013)
[26] A. Lagorce-Tachon, T. Karbowiak, D. Champion, R.D. Gougeon, J.P. Bellat, Materials and Design 82, 148 (2015)
[27] Y. Sun, B. Amirrasouli, S.B. Razavi, Q.M. Li, T. Lowe, P.J. Withers, Acta Materialia (2016) [28] Q.M. Li, I. Magkiriadis, J.J. Harrigan, Journal of
Cellular Plastics 42, 371 (2006)
[29] J.F. Mano, Materials Letters 61, 2473 (2007) [30] J.L. Thomason, Polymer Composites 11, 105 (1990) [31] M. Joao Teixeira, A.C. Fernandes, B. Saramago, M.E. Rosa, J.C. Bordado, Journal of Adhesion Sci-ence and Technology (1996)
[32] C. Menager, N. Guigo, X. Wu, L. Vincent, N. Sbir-razzuoli, Composites Part A: Applied Science and Manufacturing 124, 105473 (2019)
[33] S. Dong, R. Gauvin, Polymer Composites 14, 414 (1993)
[34] H.J. Qi, M.C. Boyce, Mechanics of Materials 37, 817 (2005)
[35] S. Cao, T. Liu, A. Jones, W. Tizani, Mechanics of Materials 136, 103081 (2019)
[36] M. Ptak, P. Kaczy´nski, J. Wilhelm, J.M. Margarido, P.A. Marques, S.C. Pinto, R.J. de Sousa, F.A. Fer-nandes, Materials 12 (2019)
[37] M.E. Rosa, M.A. Fortes, Journal of Materials Sci-ence 26, 341 (1991)
[38] E.M. Fernandes, V.M. Correlo, J.F. Mano, R.L. Reis, Composites Science and Technology 78, 56 (2013) [39] H. Rolland, N. Saintier, G. Robert, Composites Part
B: Engineering (2016)
[40] C. Tang, B. Shi, W. Gao, F. Chen, Y. Cai, Geotextiles and Geomembranes 25, 194 (2007)
[41] M. Sharma, S. Gao, E. Mäder, H. Sharma, L.Y. Wei, J. Bijwe, Composites Science and Technology 102, 35 (2014)