O
pen
A
rchive
T
OULOUSE
A
rchive
O
uverte (
OATAO
)
OATAO is an open access repository that collects the work of Toulouse researchers and makes it freely available over the web where possible.
This is an author-deposited version published in : http://oatao.univ-toulouse.fr/ Eprints ID : 15907
To link to this article : DOI : 10.1080/07373937.2016.1155596
URL : http://dx.doi.org/10.1080/07373937.2016.1155596
To cite this version : Aubin, Antoine and Ansart, Renaud and Hemati, Mehrdji and Lasuye, Thierry and Branly, Marc
Determination of PVC Powder Drying Kinetics at Particle Scale: Experimental Study and Modeling. (2016) Drying Technology. pp.
1-72. ISSN 0737-3937
Any correspondence concerning this service should be sent to the repository administrator: [email protected]
Determination of PVC powder drying kinetics at particle scale: experimental study and modeling
Aubin Antoine1,2, Ansart Renaud1,2, Hemati Mehrdji1,2, Lasuye Thierry3, Branly Marc3 1
Université de Toulouse; INPT, UPS, Laboratoire de Génie Chimique. 4 allée Emile Monso, Toulouse, France, 2CNRS ; Laboratoire de Génie Chimique. Toulouse, France,
3
INEOS ChlorVinyls France, Chemin des soldats F-62670 Mazingarbe, France Corresponding author to Aubin Antoine: E-mail: [email protected]
Abstract
An original experimental method is used to determine drying kinetic at particle scale. The particle scale kinetics was obtained by immersion of a small mass of wet PVC particles (cake) in a batch dense fluidized bed containing inert hot particles (glass bead). The results are summarized here and prove clearly that the PVC drying is controlled by a competition between internal and external transfer. The drying kinetic was described by a particle scale model taking into account the convective-diffusive (mass transfer) and the convective-evaporative (heat transfer) phenomena. To validate this model with the experimental data, the experimental fluidized bed dryer is modeled following two
different approaches: a perfect stirred reactor model and a 3D numerical simulation using the multiphase flow code NEPTUNE_CFD. The aim of this 3D simulation is to simulate the phenomena occurring, at local scale, in a dense fluidized bed dryer and to show the limitations of the perfect stirred reactor model.
1. INTRODUCTION.
This study has been realized in the Chemical Engineering Laboratory of Toulouse in partnership with INEOS ChlorVinyls. In PVC powder production line, after the polymerization step, a suspension, composed of water and PVC particles, is obtained. Most of this suspension water is eliminated during a centrifugation step, leading to a wet porous powder, called cake (with a humidity between 0.2 and 0.35 kg of water/kg of dry PVC). The cake drying occurs in a pneumatic dryer coupled with a fluidized bed dryer. This highly energy consuming operation (between 800 and 1500 kJ / kg dry PVC, in accordance to the operating conditions and the PVC grade) represents 30% of the production cost. The pneumatic dryer realizes 95 % of the cake drying, while the role of the fluidized bed dryer is to standardize the particles heat treatment and to finalize the drying, thus the process optimization is focused on the pneumatic dryer operation.
Several pneumatic dryer models can be found in the literature.[1-5] All of them need information concerning the hydrodynamic phenomena specific to the dryer, the heat transfer and the mass transfer, or more specifically the humidity evaporation rate (or drying kinetic) at particle scale. As the powder PVC is a porous material, both external and internal transfers have to be considered. The external transfer only depends on the dryer hydrodynamic, and an important amount of correlation can be found in the literature. On the other hand, the internal transfer depends on the particles nature and characteristics (morphology, texture, water affinity …). The aim of the study presented in this paper is the experimental determination and the modeling of the PVC drying kinetics at particle scale, using the following approach:
First, the drying kinetics at particle scale is experimentally determined by immersing a small amount (3 g) of PVC particles (mean diameter: 143 µm) in a hot fluidized bed filled with 1,5 kg of glass beads (mean diameter: 324 µm). The role of these bigger particles is to suppress agglomeration phenomena between PVC particles and to perform the drying in isothermal conditions. Then, by measuring the evolution of the outlet air humidity, the drying kinetic at particle scale can be obtained. The experimental results show that the drying kinetics is strongly dependent on air temperature and velocity.
These findings were represented according to a kinetic law based on heat and mass exchanges between PVC and air (external transfers), heat and mass diffusion inside the particle (internal transfers) and considering two drying steps (evaporation of surface then internal humidity). In order to validate it, this kinetic law is included in models
simulating our experimental apparatus, and the theoretical results are confronted to the experimental findings. Firstly, the experimental fluidized bed dryer is modeled with a perfect stirred reactor approach. However, this classical approach is based on strong assumptions, its results are in accordance with the experimental findings. In a second time, a 3D multiphase flow code (NEPTUNE_CFD) is used to simulate the drying operation in the experimental fluidized bed dryer.[6-8] These 3D simulation results show the limitations of the perfect stirred reactor approaches.
2. BACKGROUND.
Porous media drying is a complex problem, still not well-understood despite of the numerous studies that can be found in the literature.[9-11] During drying of a porous
particle, two periods can be distinguished. The first period consists in the elimination of free water located at its surface. In this period the evaporation is controlled by external transfers, which can be conductive, convective or radiative, in accordance to the dryer technology. In the case of powder PVC drying realized in a pneumatic and/or a fluidized bed dryer, these transfers are convective and depend on the local relative velocity
between air and particles, also called slip velocity.[2],[12] In the second period, the water located in the particle pores is eliminated, then the drying is controlled by a combination between internal and external transfers. The internal transfers are complex and depend on the structure of the solid particle, the water-solid bond, and the water composition. The elementary mechanisms which can occur during drying of a porous solid particle (in general case) are represented in Figure 1:[3],[13]
Capillary forces, depending on liquid wetting on the solid surface, temperature and particle pore size distribution.
Vapor diffusion through the pores under the influence of temperature and water vapor partial pressure.
Solid diffusion, corresponding to bound water migration on solid surface. This mechanism occurs in the case of solid partially dissolved in water and strong liaison between water and solid.
All these elementary mechanisms are influenced by the particles morphology (diameter, porosity, affinity with water ...). In cases where the particles have a small diameter and a low water affinity, the evaporation zone thickness become really small, and the particles
temperature can be considered uniform. As show in the next section, this is probably the case of the powder PVC drying.
The modeling of a wet particle drying by hot air has to consider water evaporation at the particle surface during constant drying rate period, and the movement of an evaporation zone between the wet core and the dry crust of the particle. This zone progresses from the particle surface to its core and its thickness is due to the wetting properties of the liquid in the pores as indicated in Figure 1. A shrinking-core type model is used by numerous authors to represent the evaporation front evolution of particles having a pellet-grain structure (Figure 2).[14-17] In this kind of model, the particle is divided into two zones: a wet core, which shrinks over time, and a dry crust, through which the evaporated water diffuses to the particle surface. In general, a local equilibrium between the solid and the gas going through the dry crust is considered. The elementary mechanisms involved here are conductive heat transfer (from particle surface to its core) and water vapor diffusion through the pores. This model type is well adapted to the particles with a pellet-grain structure (that is, particles consisting of primary particles) with a low pore volume in the primary particles. Indeed, with such a structure, the drying will mostly occur in the space between the primary particles. Thus, the drying will be controlled by the water vapor diffusion through the particles.
3. PVC PARTICLES PROPERTIES
In order to determine the physical properties of a PVC particle, different characterization analysis have been realized in our laboratory. Indeed, the SEM picture of a PVC particle
(Figure 3) shows a typical pellet-grain structure,[14] as each particle is a primary particle (of about 10 nm diameter) stack. This structure is close to the structure proposed by Saeki and Emura[18], represented in Figure 4, predicted by the PVC particle formation
mechanism.
The particle size distribution of PVC particle has been evaluated by laser granulometry (Malvern Mastersizer 2000 Sirocco 2000 ±0.1 μm). The results are summarized in Table 1.
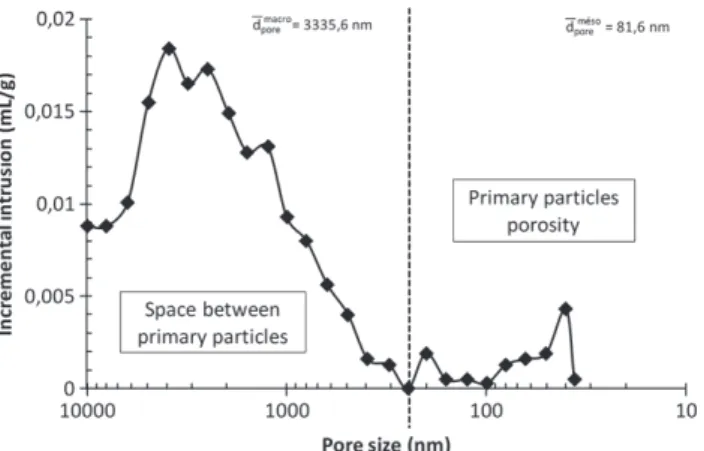
Figure 5 presents the pore size distribution of a PVC particle, measured by mercury porosimeter (Micrometrics Autopore IV). As indicated by the particle structure observed on the SEM picture (Figure 3) two pores families can be distinguished:
The space between the primary particles, for a pore size higher than 250 nm (macropores), which represent 93% of the pores volume.
The primary particles own porosity, for a pore size lower than 250 nm (mesopores), which represents 7% of the pores volume.
In order to control the PVC particle size, some surfactant is introduced during the
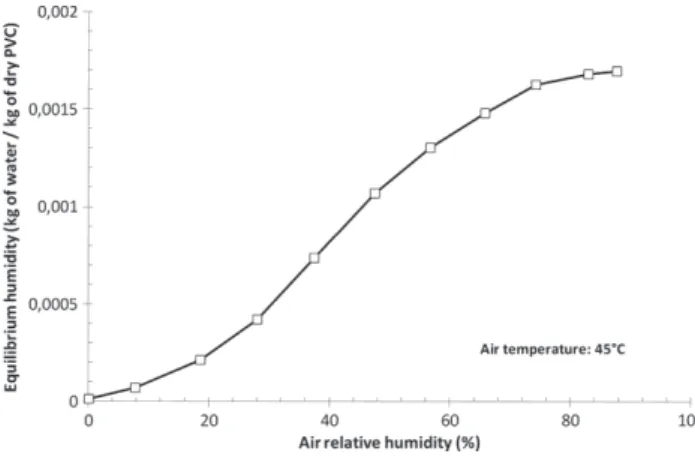
polymerization reaction step. The surfactant presence in the liquid within the pores of the particles tends to lower its liquid superficial tension. Moreover, the contact angle between PVC and water ( ) is around 85.6°.[19] This leads to the assumption that the drying zone could be modeled by a surface of discontinuity, as PVC is a material with a low
presented in Figure 6. This result shows that PVC has a small affinity with water. Indeed, even with high value of air relative humidity (80 to 85%), the PVC equilibrium humidity does not exceed 1.7 g of water / kg of dry PVC. Hence the liquid and solid diffusions can be neglected in this study, and the only internal transfer remaining is the vapor diffusion.
Concerning the capillarity effect, the pore size distribution of a PVC particle, presented in Figure 5, shows that the minimal pore size is about 30 nm. The Kelvin law (see equation (1)) expresses water activity as a function of pore radius and shows that, for pore radius higher than 10 nm, the water activity is equal to 1. Hence capillary effect does not influence the liquid/water equilibrium in this study.
2. . ln . . . LV w w w cos M a r R T LV cos Mw LV w LV w . . w. .. .R T 2. 2... LVLVLV.....c www (1)
with r the pore radius, LV the liquid surface tension, Mw and w, the water molar mass
and density, R the ideal gas constant, and T the temperature.
In conclusion, all these morphological, physical, and chemical parameters show that the PVC particles have a pellet-grain structure with a low pore volume in the primary particles (thus most of the PVC particles humidity is located in the macropores). This structure, coupled with the low wettability of the PVC, leads to neglect some elementary phenomena (as the capillarity transfer or the liquid diffusion) and to model the PVC particles drying with a shrinking-core type model as described above (Figure 2). Moreover, the dry crust can be considered without any residual humidity.
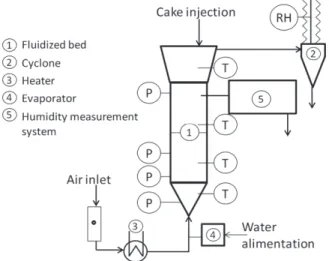
4.1 Description Of The Experimental Apparatus And Operating Conditions. In order to minimize the external effects, the kinetic study was performed by immersion of a fixed mass of wet PVC particles (cake) in a batch dense fluidized bed (Figure 7) containing inert hot particles (glass bead, see physical properties in Table 1). The dryer is composed of a 10 cm diameter and 40 cm height glass column. The presence of an
extended section on the top prevents the fine particles to be elutriated. The fluidization air is pre-heated in an electrical heater, and when it is necessary, mixed up with water vapor produces by an evaporator.
The dryer is equipped with several temperature (±0.1 °C) and pressure (±0.1 mbar) sensors and two capacitive hygrometers (temperature and humidity sensors). As shown in Figure 8, a vacuum pump brings a fraction of moist air coming from the dryer to the humidity measurement system. This system, whose role is to ensure that the humidity measurements are realized at constant conditions (air flowrate and temperature), is equipped with a filter to prevent particles to damage the sensor, a thermostatic bath to maintain a constant temperature and prevent condensation phenomena, the hygrometer, and a rotameter to maintain a constant flowrate. This hygrometer measures the air dew point with an accuracy of 0.1 °C. This hygrometer measurement is controlled according to a second hygrometer (which measures the relative humidity with an accuracy of 0.1%) located at the cyclone outlet. To avoid condensation near this second sensor, the pipe is heated with heater cables. Both hygrometers are coupled with a data acquisition system, which permits to record the temporal evolution of air humidity. Concerning the
experimentations duration (about 40 seconds). A transfer function has been determined and included in the different simulations in order to take into account this response time and to compare the simulation results with the experimental results.
The fluidization gas flowrates (velocities) are chosen in agreement with the characteristic velocities (minimal fluidization and terminal settling velocity) of PVC particles and glass beads. These values determined at ambient temperatures are presented in Table 1. The air velocity range goes from 25 to 40 cm/s, which corresponds to 3 and 4.5 times the
minimal fluidization velocity of the glass beads at ambient temperature. The temperature range goes from 30 to 60 °C. Indeed, if the bed temperature is higher than 70 °C the PVC surface becomes sticky and can cause agglomeration in the bed. Finally, the influence of surrounding air relative humidity is studied from 0.2 to 25.2 g of water / kg of dry air.
The injected wet PVC mass is chosen to ensure that drying operation stays isothermal. Indeed a preliminary study, realized with wetted glass beads, show that the mass of water injected with the sample should not exceed 1.5 g to prevent a temperature fall higher than 1°C. Hence, the injected wet PVC mass is fixed to 2.9 g, while the fluidized bed is filled with 1.5 kg of inert glass beads. This allows us to expect that the wet PVC sample is quickly dispersed in the fluidized bed and that the PVC particles are isolated from each other.
With this experimental set up, the PVC particles drying kinetic is obtained by indirect measurement.[20] Indeed, as the drying time is short, the weighing methods are difficult to realize, so the outlet air humidity evolution (Y(t)) is recorded, as shown in the Figure 9. The evolution of the fluidized bed temperature is also presented in this Figure, and shows that, in our experimental conditions, the drying operation is isothermal.
The instantaneous drying rate, Wdr(t), can be obtained from the outlet instantaneous air
humidity, Y(t), as indicated on equation (2):
0
. 0 ,
dr g
Wdrdrdr t FFggg00... Y t Y 0 , (2)
with, Y(0) the initial air humidity and Fg0 the dry air mass flowrate.
Then, the mass of evaporated water during the time t, m tw , and the total mass of evaporated water during the experiment, m , can be calculated by integration of the w drying flowrate: 0 . t w dr mww t Wdrdr t dt 0 t w dr dt w Wdr t d. w dr w dr (3) 0 . end t w dr m W t dt mwww drdrdr 0 end w dr w dr .dtdt w dr w WWWdr tt w dr w dr w dr w dr (4)
with tend, the time at the end of the experiment, i.e. the time when Y(tend)=Y(0).
Finally the mean solid humidity, X(t), is evaluated by the following expression:
w w
sample w
m m t
mass of water inthe sample X t
mass of the anhydrous sample m m mw mmw t
mw w
mass of water inthe sample
f th h d l w mw t w w w w w m
With msample the mass of the wet sample injected.
The evolution of the drying rate and the mean solid humidity are represented in the Figure 10.
The solid initial humidity calculated with this method has been compared with the direct measurement (the mass loss of sample placed in a ventilated oven at 50°C during 24 hours). The results show a measurement relative error inferior to 5%.
4.3 Experimental Results: Influence Of The Operating Parameters
The different experiments realized with this fluidized bed dryer showed that the PVC drying kinetics is strongly dependent on the bed temperature, the dry air flowrate, and the inlet air humidity. Indeed, all theses operating parameters directly influence the mass and/or heat driving forces, and consequently the transfers.
For example, Figures 11 and 12 show respectively the influence of bed temperatures and dry air mass flowrate on the drying kinetics. The results presented in Figure 11 show that a rise from 34 to 55 °C strongly decreases the drying time from 50 to 30 s. Indeed, a temperature rise will improve the heat transfer between the fluidized bed and the particles but also the mass transfer driving force, as the air humidity at equilibrium (Y*) is directly related to the particle temperature. Concerning the dry air flowrate effect, the
experimental results (Figure 12) show that a rise of the air flowrate from 7.5 to 12.4 kg/h decreases the drying time from 70 to 45 s. The higher the air velocity is, the higher the
relative velocity between air and particles is. Hence, the mass and heat transfers are increased and the drying time is shorter.
These results show that, even in a strongly stirred dryer such as the fluidized bed dryer, the external resistances are not negligible. These resistances, controlled by the
hydrodynamic parameters of the system, determine the energy and mass flow excha nges between the dryer atmosphere and the PVC particles. Moreover, the inherent drying parameters (temperature or initial air humidity) have also a strong effect on the drying kinetics.
5. MODELING OF PVC DRYING AT PARTICLE SCALE 5.1 Model Description
During the drying of a porous particle, two periods can be distinguished (Figure 2). The first period consists in the elimination of the free water located at its surface. In this case external transfers depending on the local relative velocity between the air and the
particles control the evaporation. In the second period, the water located in the particles pores, is eliminated: the drying is controlled by a combination between internal and external transfers and modeled by a “shrinking core” type model (Figure 13). This model is widely used in the literature for particles with a pellet-grain structure,[14] as shown in Figures 3 and 4. In that kind of model, humidity of the particle is concentrated in a moist core which will shrink during the drying and so form a dry crust at the surface of the particle.[21],[22]
The evaporation takes place at the water/air interface (moist core surface), and the water vapor diffuses through the dry crust. The model hypotheses are the following:
The particles are considered perfectly spherical and uniform.
The particle initial humidity (X ) is the sum of the surface humidity (0 0
surf X ) and the humidity located in the pores ( 0
pore X ).
The evaporation occurs on the evaporation front.
The wet core humidity and the dry crust humidity are respectively considered equal to the particle initial humidity located in the pores (X0pore) and null.
The mass transfer is directed by the water vapor diffusion through the dry crust and the convection at the particle surface.
The heat is transferred from the air to the particle by convection.
The particle temperature is considered uniform. This assumption can be justified by the low value of the thermal Biot number (BiT < 10-2). In addition, this assumption has
been justified with an analog model considering the heat conduction the dry crust. The instantaneous profile of the air humidity in the dry crust is obtained with the quasi-stationary state hypothesis.
Reference states: liquid for the water, solid for the PVC, and gas for the air. Tref =
0°C. Pref = 1 atm.
To determine the drying kinetics, the coupled mass and heat balances are realized on a single particle placed in an atmosphere with temperature (T∞) and humidity (Y∞)
controlled. The balances are written for both drying phases:
Surface Drying (For 0 0
pore X0 X X0pore
X00 X X00 )
The surface humidity elimination is modeled by considering a continuous liquid film around the particle. During the drying, the liquid film thickness (( w) is reduced. The mass
and heat balances are respectively shown in equations (6) and (7). The mass balance is obtained by equalizing the particle mass loss to the convective mass flux, while the heat balance is obtained by equalizing the particle heat variation to the convective heat flux.
2 * 0 3 6 . . 2. . . y p w p p dX k d Y Y dt yyy pp00p0...ddp333pp ppp www 6 y p 2. w y. . p w kyyyyy... 00000066 333333... dppppp 2.2.2.2.2.2.2. wwwww 2.. YY** YY . (6) 2 0 3 6 . . . 2. . . p L L p w V p w p ref p w p p p dT dX Cp X Cp H T Cp T T h d T T dt dt ppp.d..dppp 6 p w Tp p w p p w p 2 p w . T p p w p p w . Tp L p L p w V dT L L L p dX L L L L L X Cp.. LL . p . LL p w V p ... w .. . V L L L L p w V p w V p w V p w V 6 L L L L T T h d T 66 2 L L L L L L p w p p w V pp ww pp ref 000.d333 ppp www ppp p w V pp ww pp ref p w V ppp www. ppp ref . 000000 333333 pppp 2. wwww pppp p w V ppp www... ppp refref ... .. p 2. w p p w V ppp www ppp ref 0000 3333... ppp .. www ppp . (7)
Internal Humidity Drying (For
0
pore X X0pore
X X0 )
During the second drying phase, the mass balance takes into account the water vapor diffusion through the crust and water vapor exchange at the surface of the particles. The particle temperature is considered uniform, the heat balance takes only into account the convective exchange with the gas. The wet core thickness is directly related to the particle humidity as shown in equation (8):
3 h 0 r X R pore X 3 rh rhh rh R R R
The mass and heat balances are respectively shown in equations (9) and (10). * 0 3 1/3 p 0 dX 6 . . Y Y dt .d X . 1 1 y p M pore k Bi X 0 3 p .d 0 3 0 3 p * 6 . kyy . Y* Y 0 3 . 0 3 0 3 1/31/3 . Y Y X 1/31/3 X X X X 1 1 1 1 1 1 pore Xpore X0 X0pore X . (9) 0 6 . . . . . p L L p w V p w p ref p p p dT dX Cp X Cp H T Cp T T h T T dt dt ppp.d..dppp 6 p w V L dTp L L L L p dX L L L L L X CpL pp L p w V p ... w .. . V L L L L p w V p w V p w V p w V 6 L L T T h 6 T L L L L T Tp p w V p w p ref d . 0 pp p w V p w p ref p w HV Tpp Cpww Tpp Tref h 00 T Tp L L L L p w V p w p ref p p w V p w... p ref .. p p w V pp ww pp ref 000 . TT T . (10)
Equation (9) is obtained from the equalization of the convective flux exchange between the particle and the surrounding air and the diffusion flux inside the pores. As the heat conduction inside the particle is neglected, equation (10) is equivalent to equation (7): the only change is the expression of the particle surface. Both equations origins are presented in Appendix 1.
In equations (6) and (9), Y* is the equilibrium humidity, Y∞ the humidity of the air
surrounding the particle, and ky is the convective mass transfer coefficient.
In the second drying period, the competition between external and internal transfers is represented by the presence of the dimensionless number called Biot number relative to mass transfer, BiM : . , 2. . y p M app g k d Bi D g , 2 2 y p y. p k dyyyy...dpppp (11)
where, g is the gas density, and Dapp the diffusion coefficient of water vapor in the air
within a pore.
used in equations (7) and (10) are considered constants. In both equations, T∞ represents
the temperature of the surrounding air, and Tref represents the reference temperature.
5.3 Model Parameters
The model parameters can be divided in two categories. The first regroups the parameters of solid particles (diameter, porosity, tortuosity, and density) and the water affinity of PVC powder. The second regroups the parameters of the dryer (heat and mass transfer coefficients between the surface of the particles and the surrounding gas, water vapor diffusion coefficient, and the dryer geometry). All the parameters of the first category are experimentally determined, while the second ones are calculated using literature
correlations. So this model does not include adjustable parameters.
Water Vapor – Air Apparent Diffusion Coefficient
This coefficient is obtained from the effective diffusion coefficient, Deff, corrected by the
particle porosity and tortuosity:[23]
. , app eff
D DDeffeff. , (12)
The effective diffusion coefficient is equal to the molecular diffusion coefficient, the Knudsen diffusion coefficient, or a combination of both coefficients, following the diffusion regime. The diffusion regime is directly related to the pore radius. These coefficients are evaluated thanks to the literature correlations.[24][25]
The convective heat and mass transfer occurring in a fluidized bed, depending on the drying technology, have been widely studied, and the literature provides a lot of correlations, sometimes contradictory, for its estimation. [26][27]
In the case of very turbulent environment (such as a fluidized bed), the heat transfer coefficient can be related to the mass transfer coefficient with the Chilton & Colburn analogy:[28] 2/3 . g . , g s w y h Cp Y Cp Le k g g s w Cpgg Y Cpss... wwg ...L (13)
where, Cpg and Cpwg are respectively the mass specific heat of air and water vapor, and
Le, the Lewis number, equal to 1 in case of air – water mixture.
As, in our case, these coefficients are related, only the convective mass transfer coefficient, ky, has been experimentally determined by injecting wet glass beads in the
dense fluidized bed (initially the glass beads are at the room temperature). This method has been used by several authors.[29-31]
The convective mass transfer coefficient has been experimentally determined by injecting a small mass of wet glass beads in our fluidized bed and by measuring the outlet air humidity. The experimental procedure and method are described in a previous work.[32] These results show that the mass transfer coefficient is affected by the air velocities, while the bed temperature does not influence it, in the studied temperature range.
results.[33] This Figure shows that our results are close to the mass transfer coefficient determined by Resnick & White, and then their correlation was used in this model.[34]
6. IMMERSION FLUIDIZED BED DRYER MODELING 6.1 Perfect Stirred Reactor Model
The particle scale model previously presented has been integrated in a macroscopic model considering the fluidized bed as an isothermal perfect stirred reactor. So the equations (6) to (10) have been coupled with the following equation:
0 0 . . . . . Bed g g g e s dY dX V F Y Y m dt dt g g g dY g g g . . . . ggggg. ggggg.dY Fggggg000000... Yeee Ysss m000000.dX dt g g g e s g g Fg g g g g g g (14)
In order to compare the model results with the experimental results, the hygrometer transfer function has been included in this model.[1] An example of model results is presented on Figure 15 and compared to three experimental results obtained in the same operating conditions. This Figure shows that the model results are in good accordance with the experimental results. Still a small deviation can be observed at the end of the drying operation. This deviation can be caused by the lack of precision of the hygrometer at low humidity, by some imprecision during the determination of the physical
parameters of the PVC particles, or by the hygrometer transfer function.
Moreover, in a previous study we shown that this model is able to correctly simulate the operating parameters influence on the drying kinetics at particle scale obtained in a fluidized bed.[1] This study showed that the resistance of internal transfers is about 1.5 times bigger than the external resistance (BiM 1.5), and showed the strong effect of external exchanges on the drying kinetic.
6.2 3D Numerical Simulation
The perfect stirred reactor model simulating the batch dense fluidized bed predicts properly the behavior of the experimental set up. But this model does not take into account the specific hydrodynamic of the fluidized bed or the geometric parameters. Hence, a 3D numerical simulation of the experimental set up has been realized with a multiphase, non-structured, parallel,[35] CFD code with an n-fluid eulerian approach (NEPTUNE_CFD). This code is developed as part of the NEPTUNE project, where the participants are presented in Appendix 2.
These simulations give a better understanding of the phenomena occurring in a dense fluidized bed, where wet particles are injected in a fluidized bed composed of dry particles having the same nature. The equation of the Eulerian n-fluid hybrid approach are derived by phase ensemble averaging for the continuous phases and by using kinetic theory of granular flows supplemented by fluid and turbulence effects for the dispersed phase.
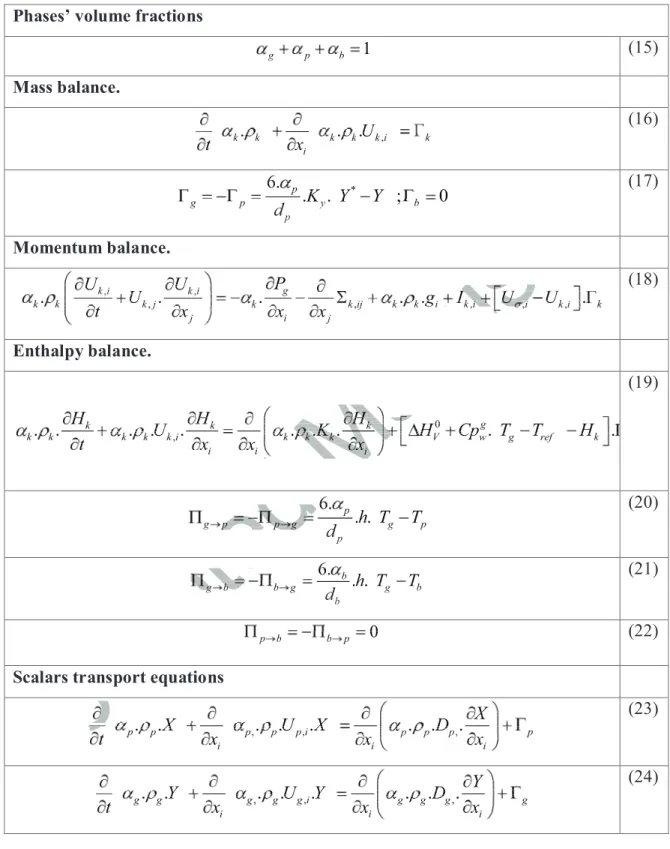
Transport Equations.
In the proposed modeling approach, transport equations (mass, momentum, and fluctuating kinetic energy) are solved for each phase and coupled through interphase transport terms.
phase (k = g), or both particle phases (PVC: k = p or glass beads: k = b), and are summarized in Table 2.
The experimental method used to determine the mass transfer coefficient is not suitable for this CFD model. Indeed this method calculates a mass transfer coefficient at the fluidized bed scale, while the numerical calculations are solved at local scale. Hence, Bayens correlation was used:[38]
0.15. p
Sh 0.15.ReRep (25)
This correlation was established during drying of PVC particles in a pneumatic dryer. In this kind of dryer, the particles presence rate is low ( p < 0.01), so this correlation is well
adapted to characterize the local transfers between a particle and the surrounding gas.
The transfer terms definitions and the closing equations of the momentum balance are presented in Appendix 2. The heat transfers between particles during contact time are neglected ( bbbbb ppppp ppppp bbbb 00000). Indeed, the temperatures of the phases are low (between
20 and 60°C), so we can neglect the particle-particle radiation, and as the contact time is short, the heat transfer by collision between particles can also be neglected. In the scalar transport equations the first term of the right-hand side member represents the scalar diffusion in their carrier phase. We consider that the liquid humidity does not diffuse in the PVC particles (Dp = 0), whereas the water vapor can diffuse in the gas phase, and in
Simulation Case Parameters: Mesh, Phases Properties, Boundary And Initial Conditions.
Mesh:
A 3D mesh of the fluidized bed presented in the Figure 7 is realized, based on the O-grid technique, as shown in the Figure 16. The geometry height is 55 cm. It is composed of a 40 cm high cylinder (diameter 10 cm) and a 15 cm high truncated cone section
(disengagement zone) of which the maximum diameter is 20 cm. The O-Grid mesh of each column section is composed of 45 cells per diameter ( r = 0.22 cm), and the height between two sections is z = 0.4 cm. The PVC inlet is represented by extruding a part of the superior face, whereas the outlet is represented by extruding a part of the truncated cone section lateral face. This mesh has 140 781 hexahedrons. A coarser mesh has been tested ( r = 0.666 cm and z = 0.975 cm), but with such a mesh the results show a lift off of the PVC particles due to a low resolution of the small-scale structures.[39]
Phases properties:
The physical properties of the particle phases are summarized in Table 1, while the gas phase properties are calculated with correlations found in the Perry's chemical engineer's handbook.[25]
The density of the gas and PVC are expressed as functions of the dry matter density and the humidity: 0 0 . 1 . 1 g g Y and p p X g g p 0 0 . 1 . 1 0 0 0 0 g g. 1 p p X 0 0 0 0 . 1 0 0 0 0 (26)
Boundary conditions:
The gas inlet is located on the inferior face of the mesh, and represents the gas distributor. The air flowrate imposed during this simulation is 10.8 kg/h, with a humidity of 0.005 kg of water / kg of dry air. This face is a wall for both particle phases, and each phase temperature is set up to 42°C.
The wet PVC inlet is located on the top of the mesh, and is realized by a swift opening of a valve. This inlet is non continuous, the PVC flowrate is initially set up to zero, and between ti = 0.2 and tf = 0.3 s, the flowrate is imposed to 0.029 kg/s, which corresponds
to a sample mass of 2.9 grams. In addition to the PVC, a small amount of gas is introduced through this valve. The gas flowrate is calculated in order to set the same velocity as the PVC’s with a volume fraction of 0.5. The temperature is set up to 20°C, the PVC humidity to 0.205 kg of water / kg of dry PVC, and the gas humidity to 0.005 kg of water / kg of dry air.
Concerning the momentum transfer, the wall type boundary conditions are friction for the gas, no slip for the particle, (zero for the mean tangential particle velocity, and zero flux for the mean particle agitation). Concerning the heat transfer, the walls are considered adiabatic for all the phases. The outlet section is modeled as a free outlet for both phases.
Initially, the column is filled with 1.6 kg of glass beads. The initial temperatures of both gas and glass beads phases are set up to 42°C, whereas the initial temperature of PVC phase is set up to 20°C.
6.3 Results And Discussion: Comparison Of Both Modeling Approaches. The numerical simulations occur in two steps: first the calculations are realized in transient state during 22 seconds, and then the time averages are calculated during 50 seconds. The transient state results are used to determine the instantaneous profiles of mixing index, phase temperature, or air outlet humidity, while the time averages calculation are needed to present the pressure profile versus bed height or the radial phases velocities profiles.
Evolution Of Outlet Air Humidity:
In order to compare the simulation results to the experimental measurements, the outlet air humidity evolution is obtained by volume integration on the meshes constituting the dryer outlet. Indeed, experimentally, the humidity measurement system is located near this outlet.
Figure 17 presents the evolutions of outlet humidity obtained by both 3D simulations and perfect stirred reactor without the hygrometer correction, whereas Figure 18 presents those with the hygrometer correction, and compares them with the experimental results.
hypotheses formulated in the isothermal perfect stirred reactor model do not have considerable impact on the simulation results. Moreover, the simulation results are in agreement with the experimental results. Thus, these simulations can predict with accuracy the behavior of our experimental fluidized bed dryer.
Temperatures Evolution:
Concerning the 3D simulation; the mean temperatures are calculated by volume integration on the entire fluidized bed.
Figure 19 presents the evolution of the PVC mean, maximal, and minimal temperatures, and the glass beads mean temperature during the drying operation, compared to the results of the perfect stirred reactor model. This Figure shows that the results of both modeling approaches are similar. But the 3D numerical simulations can be used to obtain additional information, as indicated below.
The glass beads temperature remains merely constant during the drying. Its maximum variation is about 0.3°C, as observed experimentally. So the drying operation can be considered as isothermal.
Concerning the PVC temperature evolution, four different steps can be distinguished:
- the constant drying rate period, where the PVC temperature presents a pseudo-threshold (from 2.2 to 8.2 seconds),
- the falling drying rate period, where the PVC temperature rises slowly (from 8.2 to 12 seconds),
- the thermal equilibrium establishment between the PVC particles and the glass beads (from 12 seconds).
In this Figure, it can also be observed that the temperature gap between different PVC particles never exceeds 10°C, and that it gets tighter when drying ends.
6.4 Additional Results Given By The 3D Simulation
Hydrodynamic Study:
Figure 20 describes the wall pressure profile versus the bed height. This Figure shows that the fluidized bed is 14.9 cm height. This result is in agreement with the experimental observations.
The aim of this study is to evaluate the fluidized bed ability to disperse the wet PVC sample. Indeed, the cake is injected during a short time (1/10th seconds), but the particles dispersion can be longer. This is illustrated by the Figure 21, which shows the PVC (left-hand images) and glass beads (right-(left-hand images) presence rate fields at different times (0.6, 1.2, 2.2, and 3.8 seconds). In this Figure, the PVC sample falls in the fluidized bed appears clearly, and they show that the PVC is spread in the entire bed in less than 2 seconds. However, the PVC presence rate seems to be homogeneous in the fluidized bed
only after 3.8 seconds.
To confirm these observations, the bed global mixing index is calculated. The fluidized bed is divided into n horizontal sections, and the local mixing indexes (defined below) are calculated in each of them.
, with i PVC i i i G PVC i GBi x m I x x m m i PVC i i , with i xii mPVPV i h x , with i PV i with PV i i i , with i xi PV ith C i mGBi C i G C i G , (27)
with xi, the PVC mass fraction in the ith section, and xG, the PVC mass fraction in the
entire bed. The PVC and glass beads masses are evaluated by integrating the product of their presence rates and their densities on a volume.
The global mixing index (defined below) gives information about the PVC dispersion in the entire bed. A perfect mixing conducts to a global mixing index equal to 1.[40]
2 1 1 1 . . . 1 n i i G G G I I x n x 1 G 11 G G 1 G 1 G G n 1 G G. G G xG . . 1 G n. 1 xG n I 1 2 i 11 IIIiiii 11 (28)
Figure 22 presents the evolution of the global mixing index versus time. This Figure shows a fall (at about 0.3 seconds) of the mixing index due to the cake injection, followed by a progressive rise (until 3 seconds). Then, the mixing index varies around an average value of 0.997.
This study shows that the PVC sample dispersion in the bed is fast, so the fluidized bed can be considered as a perfect stirred dryer. However, it is important to precise that the bounds between wet particles (pendular or funicular bounds) are not taken into account in both approaches.
Influence Of The Inert Fluidized Media:
In the industrial dryer, the wet PVC is continuously injected in a fluidized bed filled with dry PVC. In order to have a better understanding of the fluidized media influence, a simulation has been run by replacing the glass beads by dry PVC particles as inert fluidized media. The mass of inert media was kept constant, and since the PVC particles had smaller diameter and density than the glass beads, the fluidized bed expansion was higher (HBed = 40.5 cm), as shown on the wall pressure profile (Figure 23), and so the
presence rates of both particle phases are lower.
Figures 24 and 25 present respectively the evolution of outlet air humidity and wet PVC mean temperatures, obtained with both glass beads and dry PVC as inert fluidized media. These Figures show that drying is longer when the fluidized bed is filled with dry PVC. Indeed, the simulations results show that the mass and heat transfer coefficient calculated in this case are about twice lower than in the case of glass beads. This is directly related to the relative velocities between the gas and wet PVC phases.
Figure 26 presents the radial profile at z = HBed/2 of the relative velocity between gas and
wet PVC for both simulation cases. This Figure shows that the relative velocity between gas and wet PVC particles is lower when the bed is filled with dry PVC. This is due to the difference of bed expansion, which leads to lower particles presence rates in that case. Concerning the particles velocity, the hydrodynamic behavior of the wet PVC particles is controlled by the hydrodynamic behavior of the fluidized media, and, since the dry PVC particles have smaller diameter and density, their velocities are higher than the ones of
the glass beads. This leads to higher wet PVC velocities, and so a smaller relative velocity, in the case where the fluidized bed is filled with dry PVC than in the case with glass beads as fluidized media.
These observations are corroborated by a macroscopic analysis. Indeed, a fluidized bed can be considered as two phases:
An emulsion (or dense) phase, constituted of solid particles at the minimum fluidization state. The exchanges between particles and the gas occur in this phase.
And a bubble phase, constituted of nearly solid-free cavities in ascendant movement. The excess gas goes through the bed in the form of bubbles.
The relative velocity in the emulsion phase is assumed to be equal to the minimum fluidization velocity of the particle phase (Umf// mf). As the minimum fluidization velocity
of the PVC and the glass beads are respectively 1.2 and 8.8 cm/s (see Table 1), the gas velocity in the emulsion phase is lower when the fluidized bed is filled with dry PVC particles than when it is filled with glass beads. This leads to less intense mass and heat transfer, and so to a longer drying time.
In conclusion, these results show that the nature of the fluidized media has a strong influence on the hydrodynamic behavior of the wet PVC sample, and so on the drying kinetics. Moreover they show that our 1D model is valid only when the fluidized media has a strong hydrodynamic inertia.
In perspective to this work, simulation of the industrial dryer can be realized, by modifying the mesh to have a solid withdrawal, and so a continuous dryer.
CONCLUSION
The drying kinetics at the particle scale of PVC powder has been experimentally studied by injecting wet PVC particles in an immersion fluidized bed filled with inert media (glass beads). The experimental results show that the drying kinetics is strongly influenced by the operating parameters (Bed temperature, dry air mass flowrate, and initial air humidity). Hence, the experimental study show that PVC powder drying is controlled by both external and internal transfers.
A particle scale kinetic model has been established based on the particles morphological, physical, and chemical properties. Then as the PVC particles have a pellet-grain structure and a majority of macropores, the PVC particle drying is modeled following a shrinking core type model.
In order to validate this kinetic model, it is integrated on a model simulating the
experimental fluidized bed dryer following two approaches. The first is based on strong assumptions concerning the fluidized bed hydrodynamic (isothermal perfect stirred reactor), yet its results are close to the experimental results.
In order to take into account the fluidized bed hydrodynamics, this model has been integrated in a 3D numerical simulation code (NEPTUNE_CFD). This code allows to
simulate the behavior of a polydisperse fluidized bed coupling hydrodynamics, heat transfer, and mass transfer phenomena occurring during PVC particles drying in transient state. The simulation results are compared to those of the perfect stirred reactor model and are validated by the experimental results. These results show that the assumptions formulated to establish the perfect stirred reactor model do not affect significantly the kinetic results, on the conditions that the fluidized media has a strong hydrodynamic inertia.
This code, thus adapted to the drying issues, can correctly represent the experimental results. Hence, it can easily be transposed to industrial scale in order to simulate the behavior of a dense fluidized bed operating continuously or discontinuously.
ACKNOWLEDGMENTS
This work was granted access to the HPC resources of CALMIP under the allocation 2013-P11032 and CINES under the allocation 2013-gct6938 made by GENCI.
NOMENCLATURE
Roman symbols
BiM mass Biot number -
BiT thermal Biot number -
Cd drag coefficient - Cp specific heat J.kg-1.K-1 dh wet core diameter m
dp particle diameter m
Dapp water vapor – air apparent diffusion m2.s-1 coefficient Dbin water vapor – air binary diffusion m2.s-1 coefficient
Dk scalar diffusion coefficient m2.s-1 Fg0 Dry air mass flowrate kg/s
gi ith component of gravitational constant m.s-2
h heat transfer coefficient W.m-2.K-1 HBed Fluidized bed height m
Hk k-phase enthalpy J.kg-1
Ik,i ith component of the momentum kg.m-2.s-2 transfer term
Ii local mixing index -
IG global mixing index -
ky mass transfer coefficient kg.m-2.s-1 Ky global mass transfer coefficient kg.m-2.s-1 Kk k-phase thermal diffusivity m.s-1
Le Lewis number -
w N
N mass transfer rate kg.m-2.s-1
m0 dry mass of cake sample kg Mk k-phase molar mass kg.mol
-1
P absolute pressure Pa R ideal gas constant J.mol-1.K-1 Rep particle Reynolds number -
t experimental time s
tend time when the experiment ends s
Tk k-phase temperature K
u’k,i ith component of the k-phase m.s-1 fluctuating velocity Umf minimum fluidisation velocity m.s-1
Uk,i ith component of the k-phase velocity m.s-1
Ut settling velocity m.s-1
U
U ,i ith component of the exchanged mass m.s-1 velocity VBed fluidized bed volume m3
Vr,i ith component of the mean relative m.s-1 velocity
r p v
Wdr Drying rate kg/s
xi local PVC mass fraction -
xG global PVC mass fraction
X solid humidity kgwater/kgdryPVC
0
pore
X initial pore humidity kgwater/kgdryPVC 0
surf
X initial surface humidity kgwater/kgdryPVC
Y air absolute humidity kgwater/kgdryAir
Y* saturated air humidity kgwater/kgdryAir
Greek symbol
k k-phase volume fraction -
k volumic mass transfer rate kg.m-3.s-1
mf bed porosity (or gas presence rate) at -minimum fluidization state
Hv water vaporization enthalpy J.kg-1
i,j laminar viscous stress tensor kg.m-1.s-2
k k-phase viscosity Pa.s
k m k m k m
k m enthalpy transfer term J.m
-3
.s-1
k k-phase density kg.m-3
k,i,j ,j
effective stress tensor kg.m-1.s-2 pores tortuosity -
F gp F
gp mean gas-particle relaxation time
particle porosity -
Subscripts
b glass beads phase e inlet
g gas phase p PVC phase s outlet w water
Superscripts g gas state l liquid state 0 dry
REFERENCES
[1] Aubin, A.; Hemati, M.; Ansart, R.; Lasuye, T.; Branly, M.; Modeling and simulation of drying operations in PVC powder production line: Experimental and theoretical study of drying kinetics on particle scale. Powder Technology 2014, 255, 120-133.
[2] Levy, A. & Borde, I.; Steady state one dimensional flow model for a pneumatic dryer. Chemical Engineering and Processing: Process Intensification 1999, 38, 121-130. [3] Peishi, C. & Pei, D. C.; A mathematical model of drying processes. International Journal of Heat and Mass Transfer 1989, 32, 297-310.
[4] I. Kemp, D. Oakley, Simulation and scale-up of pneumatic conveying and cascading rotary dryers, Drying Technology 1997, 15( 6–8), 1699–1710.
[5] A. Pelegrina, G. Crapiste, Modelling the pneumatic drying of food particles, Journal of Food Engineering 2001, 48( 4), 301–310.
[6] Mezhericher, M.; Levy, A.; Borde, I.; Three-dimensional modelling of pneumatic drying process. Powder Technology 2010, 203, 371-383.
[7] Tarek, J. J. & Madhumita, B. R.; Application of Computational Fluid Dynamics for Simulation of Drying Processes: A Review. Drying Technology 2010, 28, 120-154. [8] Assari, M. R.; Basirat Tabrizi, H.; Saffar-Avval, M.; Numerical simulation of fluid bed drying based on two-fluid model and experimental validation. Applied Thermal Engineering 2007, 27, 422-429.
[10] Huang, K. & Qiao, H.Q.; Experimental Research on Drying Characteristics of PVC Powder in a Normal fluidized-bed Dryer. Journal of Southeast University (English Edition) 2007, 23( 4), 615-619.
[11] Vaxelaire, J.; Bongiovanni, J. M.; Mousques, P.; Puiggali, J. R.; Thermal drying of residual sludge. Water Research 2000, 34( 17), 4318-4323.
[12] Mezhericher, M.; Levy, A.; Borde, I.; Theoretical models of single droplet drying kinetics: a review. Drying Technology 2010, 28, 278-293.
[13] Parry, J.; Mathematical modelling and computer simulation of heat and mass transfer in agricultural grain drying: A review. Journal of Agricultural Engineering Research 1985, 32, 1-29.
[14] Szekely, J.; Evans, J. W.; Sohn, H. Y.; Gas-solid reactions, Academic Press New York, 66, 1976.
[15] Homma, S.; Ogata, S.; Koga, J.; Matsumoto, S.; Gas-solid reaction model for a shrinking spherical particle with unreacted shrinking core. Chemical Engineering Science 2005, 60, 4971-4980.
[16] Agarwal, P.; Genetti, W.; Lee, Y.; Coupled drying and devolatilization of wet coal in fluidized beds. Chemical Engineering Science 1986, 41, 2373-2383.
[17] Levi-Hevroni, D.; Levy, A.; Borde, I.; Mathematical modeling of drying of
liquid/solid slurries in steady state one-dimensional flow. Drying Technology 1995, 13( 5-7), 1187–1201.
[18] Saeki, Y. & Emura, T.; Technical progresses for PVC production. Progress in Polymer Science 2002, 27( 10), 2055-2131.
[19] Etzler, F.; Simmons, J.; Ladyzhynsky, N.; Thomas, V.; Maru, S.; Assessment of acid-base character of polymer surfaces from contact angle and other surface chemical data. Acid-base interactions : relevance to adhesion science and technology 2000, 2, 385. [20] Kemp, I. C.; Fyhr, B. C.; Laurent, S.; Roques, M. A.; Groenewold C. E.; Tsotsas, E.; Sereno, A. A.; Bonazzi C. B.; Bimbenet, J. J.; Kind, M.; Methods for processing
experimental drying kinetics data. Drying Technology 2001, 19( 1), 15-34.
[21] Mezhericher, M.; Levy, A.; Borde, I.; Heat and mass transfer of single droplet/wet particle drying. Chemical Engineering Science 2008, 63, 12-23.
[22] Cheong, H.; Jeffreys, G.; Mumford, C.; A receding interface model for the drying of slurry droplets. AIChE journal 1986, 32, 1334-1346.
[23] Akanni, K.; Evans, J.; Abramson, I.; Effective transport coefficients in heterogeneous media. Chemical Engineering Science 1987, 42( 8), 1945-1954.
[24] Wilke, C. R.; Lee, C. Y.; Estimation of diffusion coefficients for gases and vapors. Industrial and Engineering Chemistry 1955, 47, 1253-1257.
[25] Perry, R.H; Green, D.W; Maloney, J.O.; Perry's chemical engineer's handbook, New York, McGraw-Hill Book, 1984.
[26] Yusuf, R.; Melaaen, M. C.; Mathiesen, V.; Convective heat and mass transfer modeling in gas-fluidizes beds. Chemical Engineering and Technology 2005, 28( 1), 13-24.
[27] Dwivedi, P. N.; Upadhyay, S. N.; Particle-fluid mass transfer in fixed and fluidized beds. Industrial and Engineering Chemistry Process Design and Development 1977, 16( 2), 157-165.
[28] Chilton, T. H.; Colburn, A. P.; Mass transfer (absorption) coefficients prediction from data on heat transfer and fluid friction. Industrial & Engineering Chemistry 1934, 26( 11), 1183-1187.
[29] Makkawi, Y. T.; Ocone, R.; Mass transfer in fluidized bed drying of moist particulate. InTech, 2011.
[30] Sit, S. P.; Grace, J. R.; Interphase mass transfer in an aggregative fluidized bed. Chemical Engineering Science 1978, 33, 1115-1122.
[31] Prins, W.; Casteleijn, T. P.; Draijer, W.; Van Swaaij, W. P. M.; Mass transfer from a freely moving single sphere to the dense phase of a gas fluidized bed of inert particles. Chemical Engineering Science 1985, 40( 3), 481-497.
[32] Aubin, A., Optimisation du procédé de séchage dans la ligne de production du PVC en poudre: expérimentations et simulations. 2014, Ph-D Thesis, INP-Toulouse.
[33] Kunii, D. & Levenspiel, O., Fluidization engineering, volume 2. Butterworth-Heinemann Boston, 1991.
[34] Resnick, W.; White, R. R.; Mass transfer in systems of gas and fluidized solids. Chemical Engineering Progress 1949, 45, 377-390.
[35] Neau, H.; Fede, P.; Laviéville, J.; Simonin, O.; High performance computing (HPC) for the fluidization of particle-laden reactive flows. 14th International Conference on Fluidization - From Fundamentals to Products, 2013, 26 May 2013 - 31 May 2013 (Netherlands).
[36] Fotoyat, F.; Ansart, R.; Hemati, M.; Simonin, O.; Chaouki, J.; Sand assisted
fluidization of large cylindrical biomass particles: experiments and simulation. Chemical Engineering Science 2015, 126( 14), 543-559.
[37] Konan, N.; Neau, H.; Simonin, O.; Dupoizat, M.; Le Goaziou, T.; CFD prediction of uranium tetrafluoride particle fluorination in fluidized bed pilot. AIChE Annual Meeting, 8-13 November, 2009, Nashville, TN, USA.
[38] Baeyens, J.; Van Gauwbergen, D.; Vinckier, I.; Pneumatic drying: the use of large-scale experimental data in a design procedure. Powder Technology 1995, 83( 2), 139-148. [39] Parmentier, J.-F.; Simonin, O.; Delsart, O.; A functional subgrid drift velocity model for filtered drag prediction in dense fluidized bed. AIChE Journal 2012, 58( 4), 1084-1098.
[40] Mourad, M., Contribution à l'étude des cinétiques de deshydratation et d'évolution de la qualité commerciale du maïs au cours du séchage en lit fluidisé à flottation. 1992, Ph-D Thesis, INP-Toulouse.
[41] Boëlle, A.; Balzer, G.; Simonin, O.; Second-order prediction of the particle-phase stress tensor of inelastic spheres in simple shear dense suspensions. ASME
PUBLICATIONS - FED 1995, 228, 9-18.
[42] Gobin, A.; Neau, H.; Simonin, O.; Llinas, J. R.; Reiling, V.; Sélo, J. L.; Fluid dynamic numerical simulation of a gas phase polymerization reactor. International Journal for Numerical Methods in Fluids 2003, 43( 10-11), 1199-1220.
[43] Schiller, L.; Naumann, A.; A drag coefficient correlation, 1935, Vdi Zeitung, 77, 318-320.
[44] Srivastava, A.& Sundaresan, S.; Analysis of a frictional-kinetic model for gas-particle flow. Powder Technology 2003, 129( 1), 72-85.
[45] Vermorel, O.; Bedat, B.; Simonin, O.; Poinsot, T.; Numerical study and modelling of turbulence modulation in a particle laden slab flow. Journal of Turbulence 2003, 4( 25), 1-39.
APPENDIX 1: DESCRIPTION OF THE MASS AND HEAT TRANSFER AT PARTICLE SCALE EQUATIONS DURING THE INTERNAL HUMIDITY
DRYING.
A PVC particle is considered during the internal humidity drying, then the particle can be divided into two zones, limited by the evaporation front: the wet core and the dry crust, as presented on Figure 27. The particle is considered uniform, so the problem can be
reduced on a particle radius.
R and rh are respectively the particle and the wet core radius. Y*, Ys and Y∞ are
respectively the saturated air humidity (i.e. the air absolute humidity at the evaporation front), the air absolute humidity at the surface of the particle, and the humidity of the air surrounding the particle. Tp and T
∞
are respectively the temperature of the particle (considered uniform) and the temperature of the air surrounding the particle.
Mass Balance Development:
Water vapor diffusion through the particle pores is the only internal mass transfer mechanism taking into account. Then the evaporation flux density at a point of the dry crust, NNw rr , can be obtained with the Fick law, as:
0 , . . w app g r Y r t N r D r 0 . p g Y r t, Y r t, . w Dapp. g w ap 0 p g r r N r D (29)
with Dapp the apparent water vapor diffusion coefficient and g0 the dry air density.
In the quasi-steady state, the mass balance on a volume element of the dry crust can be expressed as: 2 2 1 . . w 0 r d r N r r dr 0 2 2 1 . 2. w d r N r . . . 2. w r2 d (30)
By combining the equations (29) and (30) with the following boundaries conditions, the evaporation flux density and the air absolute humidity profile can be obtained:
* , , h s Atr r Y Y Atr R Y Y Atr * , h Atr , , r Yh Y , R Y Ys , , s * 0 2 1 . . . 1 1 s w app g h Y Y N r D r R r 1 Y YYs 1 . w Dapp. g w ap 0 . p g 1 . 2 r r 1 N r D (31) * 1 1 . 1 1 s s h Y Y Y r Y R r R r Y 1 11 1 Y 1 s Y YYs 1 11 Y Y 1 Y Y 1 1 1 1 r . 1 . 1 RR rr s R r YYss R R R R R (32)
So at the particle surface, the evaporation flux density is expressed as:
* 0 * 2 1 . . . . 1 1 s w app g s h Y Y N R D K Y Y R R r 1 Y 0 * p g K Y Ys 0 * 0 * .. s p g . s w DD .app g s w app. g s 0 * p g 1 s Y 0 * 0 * 0 * . p g..1 s 0 * 0 * 0 1 * 0 * 0 Y * 0 * 0 * 0 * 0 * 0 s * 0 * 0 * 0 * 0 Y * 0 * 0 * 0 * 0 * 0 * 1 p g s p g 1 2 s R p g s p g s r p g s p g 1 . 22 s p g s p g 1 . 22 s p g s p g 11 s N R N R DD . (33) 0 2 0 . 1 . with: . .and 1 1 . 1 . app g y y M app g M h h D k k R K Bi R Bi R D R r r 0 D 0 1 k 2 0 g 2 0 . . 2 0 1 1 1 1 app.. g y y.. d Dapp... k k R... K D ... ggg . 11112222 kyyy .andandBi yyy... 0000 R222222222 M D 000000000 K . 222222222 .andBiM 000000000 1 1 R2 D 0 R r R r 2 0 . 2 . 0 1 1 . 2 . 0 R2 D 0 R D R22 D 00 R D R22 . 1 D 00 R . 1 D R D R D R R D R D R D h rhh . 1 rh . 1 r . (34)
![Table 1. Powder PVC and glass beads physical properties (* experimental measurement). PVC Glass beads d [3,2] (µm) 142 314 d 10 (µm) 106 233 d 50 (µm) 147 324 d 90 (µm) 203 451 3 ) 990 2500 Toruosity (-) 3,7 - Global porosity (%)](https://thumb-eu.123doks.com/thumbv2/123doknet/3122131.88748/46.892.109.780.187.877/powder-physical-properties-experimental-measurement-toruosity-global-porosity.webp)
![Figure 1. Internal transfer in a porous particle. [3]](https://thumb-eu.123doks.com/thumbv2/123doknet/3122131.88748/48.892.121.412.188.581/figure-internal-transfer-in-a-porous-particle.webp)
![Figure 2. The two phases of particles drying. [14]](https://thumb-eu.123doks.com/thumbv2/123doknet/3122131.88748/49.892.120.661.186.397/figure-phases-particles-drying.webp)