Filter feeders increase sedimentation of titanium dioxide: The case of
zebra mussels
Araceli D. Larios
a,d, Rama Pulicharla
a, Satinder Kaur Brar
a,⁎
, Maximiliano Cledón
b,caInstitut National de la Recherche Scientifique (INRS), Centre Eau, Terre & Environnement, 490, rue de la Couronne, Québec, QC G1K 9A9, Canada
bInstitut National de la Recherche Scientifique, Centre - Enegie Materieaux Telecommunications, 1650, boulevard Lionel-Boulet, Varennes, QC J3X 1S2, Canada c
Centro de Investigación Aplicada y Transferencia Tecnológica en Recursos Marinos Almirante Storni (CIMAS), Universidad nacional del Comahue- Prov de Rio Negro- CONICET, Güemes 1030, 8520 San Antonio Oeste, Rıo Negro, Argentina
d
Instituto Tecnológico Superior de Perote, Km 2.5. Carretera Perote-México, 91270 Perote, VER, Mexico
H I G H L I G H T S
• The depuration of zebra mussels occurs progressively with a rate around 5.6 mg Ti/day
• Mussels retain Ti at a concentrations of 3.5 ppm but lower concentration trigger complete Ti excretion
• Ti can be captured by zebra mussels freely dissolved or attached to particles of organic material (algae).
• Zebra mussel can retain Ti as a function of the TiO2concentration
G R A P H I C A L A B S T R A C T
a b s t r a c t
a r t i c l e i n f o
Article history: Received 5 April 2017
Received in revised form 22 June 2017 Accepted 14 August 2017
Available online xxxx
Titanium dioxide particles (TiO2) are widely used to produce whitens (titanium white) and different class of
nanomaterials (semiconductors, photo catalysts and nanotubes). Nanomaterials are excellent adsorbents and catalysts with a wide range of applications. However, these are reported to induce biological and genetic alter-ations among several invertebrate groups. Invasive species such as zebra mussels can be used as model organisms to study the behavior of particles and nanoparticles (NPs) due to their wide distribution; mussels have been ex-tensively used for monitoring water pollution. In the present study, TiO2particles were dispersed and added to a
Chlorella culture to emulate a natural scenario. To study the reaction of zebra mussels to different TiO2
concentra-tions, they were fed with 0.35, 0.7 and 3.5 mgTiO2/L of the suspension for 3 days and the titanium was measured
in the water column, mussels and sediments with ICP-AES. Zebra mussels obtained from the Port of Quebec had up 61.62 mg Ti/kg wet tissue at the time of capture. After 10 days of depuration, they had from 0.23 to 16.28 mgTi/kg wet tissue. Mussels accumulated TiO2after 36 h of exposition as a function of TiO2concentration, but mussels did not
present significant mortality due to TiO2toxicity until concentrations higher than 0.7 ppm. A second set of
experi-ments was run to understand the TiO2pathway attached to microalgae vs free TiO2. Results indicated that mussels
accumulated slightly more Ti when it was mixed with microalgae. However, the statistical difference was non- sig-nificant. A 100 times higher accumulation of Ti in sediments was identified when mussels are present. Thus, it was concluded that the sedimentation of TiO2is enhanced by the zebra mussels'filtration activity.
© 2017 Elsevier B.V. All rights reserved.
Keywords: Zebra mussel Ecotoxicology TiO2 Bioaccumulation,bio- magnification Sediments
Science of the Total Environment xxx (2017) xxx–xxx
⁎ Corresponding author.
E-mail address:[email protected](S.K. Brar).
https://doi.org/10.1016/j.scitotenv.2017.08.150
0048-9697/© 2017 Elsevier B.V. All rights reserved.
Contents lists available atScienceDirect
Science of the Total Environment
j o u r n a l h o m e p a g e :w w w . e l s e v i e r . c o m / l o c a t e / s c i t o t e n v1. Introduction
Zebra mussels (Dreissena polymorpha) are bivalves from the Azov, Black and Caspian seas (Ricciardi et al., 1996). These were worldwide introduced during the 80′s via ballast water of trading ships and spread in different places, such as St. Lawrence River (Yoo et al., 2014), Ebro River in Castejón (Morales et al., 2013), River Rhine, Danube River, Eu-phrates River basin, and Kuban River among others (GISD, 2014).
Thefilter-feeding system of zebra mussels allows them to uptake freely dissolved or suspended chemical contaminants across its gill membrane. When the chemical contaminants are associated with parti-cles such as algae or suspended sediments, these are desorbed during the gut passage and then these are assimilated into the mussel tissue or excreted as feces (Bruner et al., 1994). Hence, mussels have been con-sidered as“suitable sentinel organisms” for aquatic monitoring of chem-ical contaminants, such as polychlorinated biphenyls (PCBs), dichloro diphenyl trichloroethane (DDT), benzo(a) pyrene (BaP), hexachlorobiphenyl (HCBP) and titanium dioxide particles (TiO2)
(Bruner et al., 1994; Couleau et al., 2012). When zebra musselsfilter large quantities of water can produce then the accumulation of chemical contaminants which can be transported directly to zebra mussel preda-tors or deposited in sediments by contaminated feces from zebra mus-sels (Kwon et al., 2006). It depends of the exposure time, chemical contaminants concentration and exposure route (Palais et al., 2012). Thus, detritivores such as amphipods and chironomids which inhabit in the sediment may ingest highest concentration of chemical contami-nants inducing the transport and bio-magnification process through the food chain because detritivores are prey for differentfish species ( Perez-Fuentetaja et al., 2015).
In view of the widespread use of TiO2and their environmental
re-lease into fresh water,Couleau et al. (2012)investigated the sub lethal effects of TiO2NPs on the immune system cells (hemocytes) of Dreissena
polymorpha. After 24 h of in vivo exposure to TiO2NPs at different
con-centrations, they observed the internalization of TiO2NPs into
hemo-cytes and the consequent immunological responses. However, it is known that there are changes in the transport and behavior of NPs when these are exposed to different media such as fresh or seawater, because depending with the TiO2concentration and the presence of
or-ganic material such as microalgae, homoagglomeration (NPs coalesce or clump together with other NPs) or heteroagglomeration (NPs are
adsorbed onto cells) process may occur and to influence the bioaccumu-lation or sedimentation process in aquatic environments (Sendra et al., 2017). Thus, this study has examined the rerouting of TiO2by Dreissena
polymorpha for exposure experiments mediated by Chlorella microalgae at different TiO2concentrations and exposition time from 24 to 72 h.
These results contribute for the understanding of the behavior of how these particles are transported, bio-accumulated or expelled to the sed-iments by Dreissena polymorpha as a function of TiO2 concentration, time and the presence or absence of Chlorella microalgae.
2. Material and methods 2.1. Chemicals and standards
Nitric acid (Trace metal™ grade, 67˗70% Fisher Scientific, Ontario, Canada), per-chloric acid (reagent grade 67˗71% Fisher Scientific, Ontar-io, Canada). Standards for metal analysis (SCP Science, plasmaCAL, Que-bec, Canada). HPLC grade water was prepared in the laboratory using milli-Q/Millli-Ro Milli pore system (Milford, Massachusetts, USA). Tita-nium dioxide (TiO2) powder (reagentPlus® grade, 99–100%,
Sigma-Aldrich, Ontario, Canada). Commercial fertilizer (Miracle-Gro® with 5% N and 30% P, Quebec Canada) was used to promote Chlorella algae growth.
2.2. Zebra mussels (Dreissena polymorpha) conditioning
Around two thousand specimens of zebra mussel (Dreissena polymorpha) were collected at the old Quebec port, St Lawrence River, (46° 49′ 20.2614″ N 71° 12′ 43.8264″ W) in early spring 2014 and also in December 2015. The mussels attached on submerged cords and wires of the Port of Quebec yacht marina were carefully and manually collected to avoid damage of the bivalves and transported to the labora-tory in a plastic container.
The mussels were cleaned with de-chlorinated tap water and trans-ferred intofive 20 L glass fishbowls. They were acclimated and starved for 10 days in aerated water at 15 ± 1 °C to reduce the background con-tent of TiO2to the minimum. The water was daily changed, later 10 days
the mussels were separated into groups of 250 mussels per treatment with a size and weight average of 2 ± 0.27 cm and 1.4 ± 0.41 g, respectively.
2.3. Chlorella algae monoculture
In order to facilitate ingestion of TiO2by mussels, a monoculture of
Chlorella was used to induce adsorption of TiO2particles. 5 L Chlorella
suspension was placed in a glassfishbowl for four days at 22 ± 1 °C. The suspension was exposed to natural light and aeration to maintain algal suspension and oxygen availability. About 6 g of commercial fertil-izer and 5 L of chlorine-free tap water were added every 48 h to pro-mote the algal growth. In a second experiment, Chlorella powder was used directly to make Chlorella algae suspension without stimulation of its growth.
2.4. Stock solution of TiO2
500 mL of stock solution at 120 ppm of TiO2was prepared with
milli-Q water. The solution was sonicated for 50 min to maximize homoge-neous dispersion (sonication 5 s/5 s on/off at 40 kHz, ultrasonic homog-enizer Autotune 750 W, Cole-Parmer Instruments, Vernon Hills, Illinois, US). Then, the particle diameter was measured by using a nanosizer-zetasizer (model Nano-ZS, Malvern, Canada). For this analysis, 100μL of TiO2stock solution were placed in a chamber and 900μL of milli-Q
water were added to complete a volume of 1000μL. The particle diam-eter was measured and it was from 100 to 400 nm (mean: 290 nm) due to fast TiO2agglomeration.
2.5. TiO2–algal mix complex
Chlorella algae monoculture and the stock solution were transferred toward a glass bowl to produce a TiO2–algal complex suspension at a
concentration of 5 ppm. This solution was aerated to mix and allow ad-sorption of TiO2particles on Chlorella. After that, the TiO2–algal mix
so-lution was used to prepare the treatments evaluated in this study.
2.6. Experimental design
Preliminary, three treatments with TiO2concentration of 0.35, 0.7
and 3.5 ppm (treatment 1, 2 and 3 respectively) were prepared. To do so, a volume of 0.35, 0.7 and 3.5 L of the algae-TiO2complex suspension
was introduced in the glass bowls and the volume was completed with chlorine-free tap water to achieve 5 L of solution by treatment. Addi-tionally, a witness treatment containing 0.35 L of Chlorella algae mono-culture free of TiO2and 1.5 L of chlorine-free tap water was used as
control to determine residual excretion by the mussels that could inter-fere with the measurements. Then, 250 mussels were placed in each bowl. The temperature in the room where the experiment was made was kept at 15 ± 1 °C. The photoperiod was set for 8 h light and 16 h dark. All the treatments were conditioned with aerators throughout the overall experiment to maintain sufficient oxygen level and simulate environmental turbulence. Every18h, 36 and 54 h samples of around 30 g of mussels were drawn and immediately frozen. The rest of mussels and the bowls were washed three times at waterjet. Then, new treat-ment solutions with their respective concentration were prepared and placed in each bowl to maintain initial conditions. The experiment was stopped at 54 h of evaluation.
A second experiment was made to understand the TiO2decantation
pathway attached to microalgae vs free TiO2. For that, the same
condi-tions used in thefirst experiment were repeated but, in this case, only 3.5 ppm of TiO2was used in duplicates, to achieve goodfiltration
activ-ity and low toxicactiv-ity for the mussels. Then, 250 mussels were placed in each bowl. The temperature and the photoperiod in the room were kept at 15 ± 1 °C and set for 8 h light and 16 h dark similar tofirst ex-periment. All the treatments were conditioned with aerators through-out the experiment. Every 24 h, 48 and 72 h samples of around 30 g of mussels were drawn and immediately frozen. The rest of mussels and the bowls were washed three times with pressured water to remove all potentially attached pathogenic bacteria. Then, new treatment solu-tion with the same concentrasolu-tion was prepared and placed in each bowl to maintain initial conditions. The experiment was stopped at 72 h of
Fig. 3. Behavior of Ti in wet tissue of zebra mussel under different TiO2concentration and exposure time.
Fig. 2. Representation of the residual retention of Ti in soft tissue of zebra mussels from the day of capture until the 10th day of acclimation.
evaluation. For Ti quantification the same process of sampling condi-tioning and analysis was applied.
2.7. Sampling for Ti quantification
At time zero and every 18 or 24 h during the whole experiment, samples of the suspension, mussels and sediments were collected from each treatment. Samples from each treatment consisted in 50 mL of the suspension taken from the surface, 50 mL taken from the bottom (sediments). Samples were stored in polypropylene tubes of 50 mL (Fisherbrand™, FisherScientific, Quebec, Canada). Samples of 30 g of mussels per treatment were simoultaneously taken and stored in plastic bags for analysis of titanium (Ti) content. When the experiment was completed, the quantification of Ti was carried out using inductively coupled plasma-atomic emission spectrometry (ICP-AES VISTA, Canada).
2.8. Quantification of Ti by ICP-AES
Before the Ti quantification, the samples were digested as follows: Liquid samples: 2 mL of liquid samples were transferred to Teflon tubes. Then, 4 mL of nitric acid and 2 mL of perchloric acid was added. The Teflon tubes were closed and placed in the autoclave to digest the samples. The digestion was made at temperature of 121 ± 1 °C and pressure around 17 psi for 4 h.
Sediments: The samples werefiltered to collect the sediments. Then, the sediments were dried at 65 °C in an oven until constant weight. The sediments weight was registered at the nearest 0.01 mg and the samples were transferred to Teflon tubes to make the digestion such as previously explained for liquid samples.
Mussels: The tissue of the mussels was removed from their valves. Wet tissues of mussels were dried at 65 °C in an oven until constant weight. Dry samples (0.2 g) were placed in the Teflon tubes to make the digestion similar to this made for liquid samples. Two reagent blanks were prepared with the same digestion procedures as described for the control. The digested samples were thenfiltered and transferred to falcon tubes of 50 mL (Fisherbrand™, FisherScientific, Quebec, Canada) and MilliQ water was added com-pleting a volume of 50 mL. After that, 20 mL of the conditioned sam-ples were used to quantify the Ti concentration by ICP-AES. Before Ti quantification, ICP-AES calibration standards of Ti ranging from 0.02 to 10 ppm were prepared using SCP Science, PharmaCAL stan-dards. The standards were prepared by using HNO3(10%). All standard
and sample solutions were spiked with internal standard (IS) Yttrium (Y) 1 ppm. The spiking IS solution was taken from a single element stock solution of Y 1000 ppm. Thefinal Ti concentration in dry weight was calculated after reading in the spectrophotometer. The operating parameters of the equipment were: Concentric glass nebulizer; nebuliz-erflow (1 L/min) cyclonic spray chamber; torch (quartz torch-single
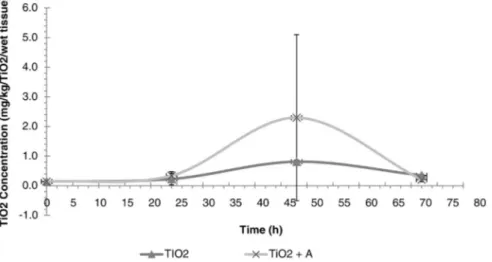
Fig. 5. Ti content in zebra mussel tissues exposed to TiO2suspension with and without algae.
slot); injector (glass); power (1300 W); plasma view (axial); plasma flow (15 L/min); auxiliary flow (2.25 L/min); sample uptake rate (0.6 mL/min); processing mode (pick area); calibration (linear through zero); background correction (spectral background correction); inte-gration Time (30 s); sample tubing (samples and standards white/ white, internal standard orange/white; replicates (3)). The detection limit of the instrument was 0.01 ppm.
2.9. Statistical analysis
An one way ANOVA was made to evaluate the significance of the ob-served differences between treatments. After that, a Tukey's Test for Non-additivity was made to evaluate the interaction of the data and to evaluate if the observed effect of time and Ti concentration in mussels and sediments was significant. This analysis consider a two-factor axb factorial design that has only n = 1 replicate for each of the ab treatment combinations (time and concentration). The data analysis was made by using statistical software SAS version 9.4.
3. Results and discussion 3.1. Characterization 3.1.1. Zebra mussels
The mussels collected from St. Lawrence River corresponding to the species, Dreissena polymorpha had a size distribution with a mode at 2 cm (mean: 2.03 ± 0.27 cm). The mean weight was 1.4 ± 0.41 g with a mode at 1.3 g. Characteristics of the collected mussels matched with the description of zebra mussel in the nonindigenous aquatic spe-cies database (USGC-NAS, 2014).
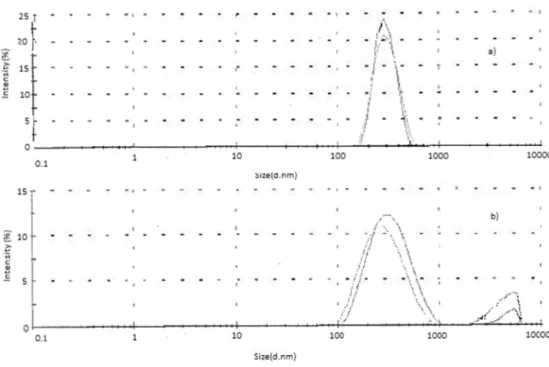
3.1.2. TiO2particle size
Fig. 1a-b presents the particle size of TiO2in the solutions stock and
algae -TiO2mix suspension.
The mean of the particle diameter in the stock suspension was around 290 nm, while in the algal-TiO2-complex two picks were
identi-fied. These two picks suggested that in the algal-TiO2- complex,
homo-agglomeration (NPs coalesce or clump together with other NPs) and hetero-agglomeration (NPs are adsorbed onto algae) could occur in same time in the suspension used. Thus, thefirst pick represents the unattached-algae particles and the second from the TiO2- algae complex
at around 5500 nm (Fig. 1a-b).Couleau et al. (2012)reported a tenden-cy of TiO2NPs to agglomerate in water and settle to the bottom of
bea-kers. They explained that the suspensions used in their experiment increased the size of the NP as a function of the NP concentrations. Also,Wigginton et al., (2007)reported that NPs with different sizes can form agglomerates (N1 μm immediately form agglomerates after their release into the environment). Such observations support the present results of agglomeration of TiO2particles. The longer the
parti-cles are mixed in a natural matrix, the higher the possibility of agglom-eration with diverse materials and get“hidden” by a heterogeneous
crown. It is difficult to predict or simulate therefore natural agglomer-ates in experimental settings.
3.2. Ti retention-excretion by zebra mussel
The initial and progressive retention of Ti measured in the wet tissue of collected mussels is indicated inFig. 2. The 100% corresponds to the initial Ti concentration in mussels which was around of 62 mgTi/kg wet tissue. This value was 10 times higher than previously reported for the species (Bourgeault et al., 2015) and can be attributed to the ex-position level of chemical contaminants in the period (summer 2014) and place in which mussels were collected. Because, it is known that in summer mussels tend to accumulate more contaminants due to the increase offiltration rates (Palais et al., 2012). Also, it was observed that after 5 and 10 days of mussels conditioning in chlorine-free tap water, the concentration was progressively decreasing to 54 and 26% re-spectively comparing to initial Ti concentration in mussels (Fig. 2). Thus, the rate of Ti deposition was around 5.6 mg/day in thefirst 5 days, but after 5 days the rate of Ti deposition decreased to 3.4 mgTi/day. This be-havior can be explained due to that during conditioning zebra mussels were not fed and it could expose them to nutritional stress which de-creased their metabolic activity (Palais et al., 2012).
After 10 days of conditioning, the Ti concentration in mussels was around 16.3 mgTi/kg wet tissues. This concentration was established as the initial concentration at time zero when the mussels were exposed to different treatments of TiO2(0.35, 0.7 and 3.5 ppm) during 3 days.
Re-sults of the Ti concentration calculated in the wet tissue of mussels at different time are showed inFig. 3. Results suggested that mussels had the capacity to adsorb and eliminate quickly the Ti adsorbed in the first 18 h, because Ti did not stay in the solution neither in mussels. However, after 36 h, mussels adsorbed Ti as a function of the TiO2
con-centration used by treatment and then it was excreted before 54 h (Ti concentration was very close to zero), except in the case of treatment 3 (3.5 ppm). According with the behavior showed inFig. 4the rate of Ti excretions was decreasing in time. Because the second dose of Ti given to mussel at 18 h was excreted after 36 h except for treatment 3. It indicates that mussel tissues reach a threshold in which a depuration mechanism is activated but can be limited at high concen-tration of Ti (treatment 3).Bourgeault et al. (2015)reported that zebra mussels are able to eliminate completely the Ti after 24 h of expo-sition of TiO2at 1 ppm. However, the results in the present study
indi-cate that it will depend of the Ti concentration and exposure time. Taking into account the low Ti concentration present in rivers, the route of Ti transport from mussels through the food chain is mainly through feces deposition and not through mussel predators. On the
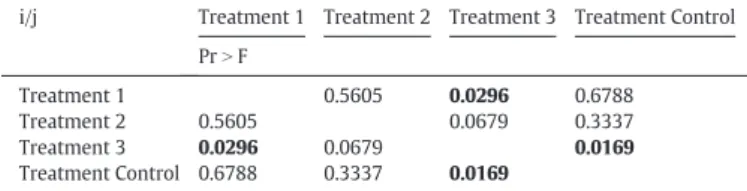
Table 2
Analysis of least squares means to evaluate the significant difference among treatments with different TiO2concentration. The significant values are highlighted in bold.
i/j Treatment 1 Treatment 2 Treatment 3 Treatment Control PrN F Treatment 1 0.5605 0.0296 0.6788 Treatment 2 0.5605 0.0679 0.3337 Treatment 3 0.0296 0.0679 0.0169 Treatment Control 0.6788 0.3337 0.0169 Table 1
Analysis of variance to evaluate the effect of TiO2concentration and exposure time in the
Ti concentration in the wet tissue of zebra mussel assuming no-interaction. The significant values are highlighted in bold.
Source Degrees of freedom Sum of squares Quadratic mean F Value PrN F
Model with non-interaction 5 444.42 88.88 7.29 0.0157
Error 6 73.16 12.19
TiO2concentration 3 154.90 51.63 4.23 0.0629
Time 2 289.53 144.76 11.87 0.0082 Tukey's Test for Non-additivity
TiO2concentration 3 154.90 51.63 3.70 0.0967
Time 2 289.53 144.76 10.36 0.0167 Interaction 1 3.32 3.32 0.24 0.6467
Table 3
Analysis of least squares means to evaluate the significant difference among treatments exposed at different exposure time. The significant values are highlighted in bold.
i/j 18 h 36 h 54 h
PrN F
18 h 0.0038 0.4382
36 h 0.0038 0.0096
other hand, during the experiment it was observed that around 43.67 g/day ± 0.24 of mussels were dead (Fig. 5) in the treatment 3 (TiO2concentration of 3.5 ppm). This mortality was higher respect to
other treatments in which the mass of dead mussels was only from 1.87 to 3.4 g/day. Considering the fact that the metal detoxification and the maintenance of detoxification mechanisms might be energeti-cally expensive, the TiO2concentration used in the treatment 3 could
af-fect the homeostasis of the organisms and also their metal detoxification capacity. Thus the increased energetic cost by stress ex-pression andfinally produce the mussels mortality (Smolders et al., 2004; Voets et al., 2009).
To evaluate the significance of the filtration activity of mussels on the TiO2decantation,Tables 1–3show the results from the analysis of
variance (ANOVA). The least squares means evaluate the effect of TiO2
concentration and exposure time in the wet tissue of zebra mussel (Montgomery, 2001). The PrN F value inTable 1indicates that the model assumes no-interaction and therefore, it can estimate the differ-ence among the treatments at a significance level α ≤0.05 and that the observed effects can be attributed to the evaluated variables and not to the interaction. To corroborate this observation a Tukey's test for non-additivity was performed. The results are showed inTable 1indicating that the main differences among treatments can be attributed to the ex-posure time and not to the changes among the TiO2concentrations
eval-uated in the experiment (α ≤0.05). Thus, to elucidate each one of the difference between the treatments a least squares means test was made and results are showed inTable 2, which show that the observed difference among the treatments was significant only between the treatment 1 and 3; 2 and 3; and control and 3 at an significant level α ≤0.05.Table 3presents the differences among the exposition time. It can be seen that the main changes in the Ti concentration in the mussel tissues were significant between 18 and 36 h; and also between 36 and 54 h. Thus, it can be concluded that only at TiO2concentration of
3.5 ppm, a significant difference in Ti concentration in the wet tissues of zebra mussels can be identified and that the main changes occur around 36 h of TiO2exposition. On other hand, a similar statistical test
was made to evaluate the effect of TiO2concentration and exposure
time on the mass of dead mussel. Results showed a significant effect only between the treatment with a TiO2concentration of 3.5 ppm and
the other treatments (PrN F = 0.0001). In this case, the exposure time has no effect on the mass of dead mussel (PrN F = 0.8428).
As complement to the understanding of Ti retention-excretion be-havior by zebra mussels, a second set of experiments was run to under-stand the TiO2pathway attached to microalgae vs free TiO2. In this
experiment mussels were exposed in a solution at 3.5 mg/L TiO2with
and without microalgae. Results showed inFig. 5indicated that mussels
accumulated less TiO2when it was unattached to microalgae. However
when the statistical difference was evaluated by ANOVA, results showed that this difference was not significant at a level α ≤0.05 where the Pr N F value was of 0.592 and 0.993 for the treatment (with algae and with-out algae) and the exposure time respectively. Thus, the Ti suspended in water or attached to microalgae seems to be equally catchable by zebra mussels. However, it can be seen that the standard deviation at an expo-sure time of 48 h was higher than the other times. Thus other factors could influence the Ti concentration identified in the tissue of mussels. Because it is know that the particle type in the environment, the particle size and the state of the TiO2particles can affect the behavior and
trans-port of TiO2in the ecosystems, these parameters should be taken into
account when zebra mussels are used.
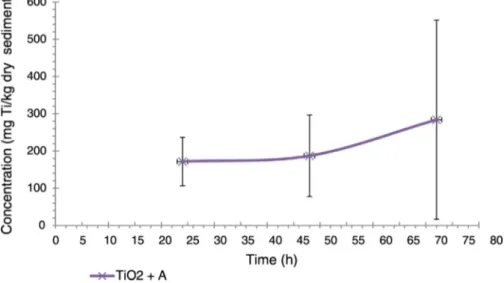
The Ti in sediments was quantified, but in the treatment without algae, no sedimentation was observed and this did not allow the corre-sponding determination in an appropriate way. Thus, only the Ti con-centration present in the sediments from the treatment with TiO2
-algae was evaluated and results are showed inFig. 6. It can be seen that the Ti concentration in sediments was around of 100 times higher with respect to the TiO2concentration present in the mussel's tissue,
this indicates that an important accumulation of Ti occur in sediments and the main route of Ti transport are the mussels through their filtra-tion activity to feces deposifiltra-tion. A slight increase of Ti concentrafiltra-tion in sediments as a function of exposure time after 50 h was observed. How-ever, due to the standard deviation were high, conclusion cannot ob-tained respect to the increase of Ti as a function of exposure time. 4. Conclusion
Zebra mussels (Dreissena polymorpha) showed almost complete Ti detoxification capacity when they were exposed to TiO2concentration
lower to 3.5 ppm. However, when mussels were exposed to a TiO2
con-centration of 3.5 ppm, the detoxification capacity of mussels was limited and then Ti was also accumulated in their tissues. On the other hand, it was observed that zebra mussels adsorbed Ti freely dissolved or suspended in organic matter present in the environment and that the main way of Ti magnification from zebra mussels was through the Ti ac-cumulated in sediments.
Acknowledgements
Our sincere thanks go to the Institut National de la Recherche scientifique-Centre Eau Terre Environnement (INRS-ETE), NSERC, Tech-nological Superior Institute of Perote (ITSPe) and the Program for the Professional development of Professors (Prodep-Mexico). Special
thanks to Prof. Patrice Couture for helping with the environmental chamber, Professor Landis Hare for collaboration with the aquaria equipment, Prof. Isabelle Laurion for collaboration with the obtainment of the microalgae and Sarma Saurabh for the collaboration with comple-mentary materials. We would also like to acknowledge to the adminis-trative staff of the Port of Quebec marina for facilitating the access for the collection of the invasive mussels.
Declaration of interest
The authors declare that they have no conflict of interest. References
Bourgeault, A., Cousin, C., Geertsen, V., Cassier-Chauvat, C., Chauvat, F., Durupthy, O., Chaneac, C., Spalla, O., 2015.The challenge of studying TiO2 nanoparticle bioaccumu-lation at environmental concentrations: crucial use of a stable isotope tracer. Environ. Sci. Technol. 49, 2451–2459.
Bruner, K.A., Fisher, S.W., Landrum, P.F., 1994.The role of the zebra mussel, Dreissena Polymorpha, in contaminant cycling: II. Zebra mussel contaminant accumulation from algae and suspended particles, and transfer to the benthic invertebrate, Gammarus Fasciatus. J. Great Lakes Res. 20, 735–750.
Couleau, N., Techer, D., Pagnout, C., Jomini, S., Foucaud, L., Laval-Gilly, P., Falla, J., Bennasroune, A., 2012.Hemocyte responses of Dreissena Polymorpha following a short-term in vivo exposure to titanium dioxide nanoparticles: preliminary investiga-tions. Sci. Total Environ. 438, 490–497.
GISD, G. I. S. D, 2014. Available from.http://www.issg.org/database, Accessed date: 15 May 2014.
Kwon, T.D., Fisher, S.W., Kim, G.W., Hwang, H., Kim, J.E., 2006.Trophic transfer and bio-transformation of polychlorinated biphenyls in zebra mussel, round goby, and smallmouth bass in Lake Erie, USA. Environ. Toxicol. Chem. 25, 1068–1078.
Montgomery, D.C., 2001.Design and Analysis of Experiments. John Wiley & Sons.
Morales, J., Flechoso, F., Lizana, M., Negro, A., 2013.Patrones de colonización y ecología de poblaciones de dos bivalvos invasores (mejillón cebra Dreissena polymorpha Pallas, 1771 y almeja asiática Corbiculafluminea Müller, 1774) en un tramo lótico del Ebro medio (Castejón, Navarra). Munibe (Ciencias Naturales-Natur Zientziak), pp. 47–69.
Palais, F., Dedourge-Geffard, O., Beaudon, A., Pain-Devin, S., Trapp, J., Geffard, O., NOURY, P., Gourlay-Francé, C., Uher, E., Mouneyrac, C., 2012.One-year monitoring of core bio-marker and digestive enzyme responses in transplanted zebra mussels (Dreissena Polymorpha). Ecotoxicology 21, 888–905.
Perez-Fuentetaja, A., Mackintosh, S.A., Zimmerman, L.R., Clapsadl, M.D., Alaee, M., Aga, D.S., 2015.Trophic transfer offlame retardants (PBDEs) in the food web of Lake Erie. Can. J. Fish. Aquat. Sci. 72, 1886–1896.
Ricciardi, A., Whoriskey, F., Rasmussen, J., 1996.Impact of the (Dreissena) invasion on na-tive unionid bivalves in the upper St. Lawrence River. Can. J. Fish. Aquat. Sci. 53, 1434–1444.
Sendra, M., Yeste, M.P., Gatica, J.M., Moreno-Garrido, I., Blasco, J., 2017.
Homoagglomeration and heteroagglomeration of TiO2, in nanoparticle and bulk form, onto freshwater and marine microalgae. Sci. Total Environ. 592, 403–411.
Smolders, R., Bervoets, L., De Coen, W., Blust, R., 2004.Cellular energy allocation in zebra mussels exposed along a pollution gradient: linking cellular effects to higher levels of biological organization. Environ. Pollut. 129, 99–112.
USGC-NAS, 2014. online available at.https://nas.er.usgs.gov/.
Voets, J., Redeker, E.S., Blust, R., Bervoets, L., 2009.Differences in metal sequestration be-tween zebra mussels from clean and pollutedfield locations. Aquat. Toxicol. 93, 53–60.
Wigginton, N.S., Haus, K.L., Hochella Jr, M.F., 2007.Aquatic environmental nanoparticles. J. Environ. Monit. 9 (12), 1306–1316.
Yoo, A., Lord, P., Wong, W.H., 2014.Zebra mussel (Dreissena Polymorpha) monitoring using navigation buoys. Manag. Biol. Invasions 5, 159–163.