OATAO is an open access repository that collects the work of Toulouse
researchers and makes it freely available over the web where possible
Any correspondence concerning this service should be sent
to the repository administrator:
[email protected]
This is an author’s version published in:
http://oatao.univ-toulouse.fr/22882
To cite this version:
Zhao, Jisheng and Lo Jacono, David and Sheridan, John and
Hourigan, Kerry and Thompson, Mark C. Experimental
investigation of in-line flow-induced vibration of a rotating
circular cylinder. (2018) Journal of Fluid Mechanics, 847.
664-699. ISSN 0022-1120
Official URL:
https://doi.org/10.1017/jfm.2018.357
Experimental
investigation of in-line
flow-induced
vibration of a rotating
circular
cylinder
J. Zhao1,†, D. Lo Jacono2, J. Sheridan1, K. Hourigan1 and M. C. Thompson1
1Fluids Laboratory for Aeronautical and Industrial Research (FLAIR), Department of Mechanical and Aerospace Engineering, Monash University, Melbourne, Victoria 3800, Australia
2Institut de Mécanique des Fluides de Toulouse (IMFT), Université de Toulouse, CNRS, Toulouse, France
This study experimentally investigates the in-line flow-induced vibration (FIV) of an elastically mounted circular cylinder under forced axial rotation in a free stream. The present experiments characterise the structural vibration, fluid forces and wake structure of the fluid–structure system at a low mass ratio (the ratio of the total mass to the displaced fluid mass) over a wide parameter space spanning the reduced velocity range 5 6 U∗6 32 and the rotation rate range 0 6 α 6 3.5, where U∗= U/( f
nwD) and α =
|Ω|D/(2U), with U the free-stream velocity, D the cylinder outer diameter, fnwthe natural frequency of the system in quiescent water and |Ω| the angular velocity of the cylinder rotation. The corresponding Reynolds number (defined by Re = UD/ν, with
ν the kinematic viscosity of the fluid) was varied over the interval 1349 6 Re 6 8624, where it is expected that the FIV response is likely to be relatively insensitive to the Reynolds number. The fluid–structure system was modelled using a low-friction air-bearing system in conjunction with a free-surface water-channel facility. Three vibration regions that exhibited vortex-induced vibration (VIV) synchronisation, rotation-induced galloping and desynchronised responses were observed. In both the VIV synchronisation and rotation-induced galloping regions, significant cylinder vibration was found to be correlated with wake–body synchronisation within the
rotation rate range 2.20 . α . 3.15. Of significant interest, the frequency of the
streamwise fluid force could be modulated by the imposed rotation to match that of the transverse lift force, resulting in harmonic synchronisation. Measurements using the particle image velocimetry (PIV) technique were performed to identify the wake structure. Interestingly, the imposed rotation can cause regular vortex shedding in in-line FIV at rotation rates that see suppression of the Bénard–von-Kármán vortex shedding in the case of a rigidly mounted cylinder (α & 1.75). There is a monotonic increase in the drag coefficient with rotation rate beyond α = 2 for a non-oscillating rotating cylinder. This suggests that the mechanism for sustaining the large rotation-induced galloping oscillations at higher α is due to a combination
of aerodynamic forcing from the locked induced vortex shedding associated with the oscillations, assisted by aerodynamic forcing, evaluated using quasi-steady theory.
Key words: flow–structure interactions, vortex streets, wakes
1. Introduction
The elastically mounted circular cylinder has been adopted as the canonical model for fundamental research on flow-induced vibration (FIV) of a bluff body in the past half-century, starting with the experiments on vortex-induced vibration (VIV) by Brooks (1960) and numerous studies since (e.g. Feng 1968; Khalak & Williamson 1997; Govardhan & Williamson 2000; Zhao et al. 2014a). This is mainly attributed to its simplicity and axial symmetry, allowing VIV to be studied independently from other forms of FIV (e.g. galloping), and the importance of FIV of such structures in a large variety of engineering applications such as oil rig risers in ocean currents, high-rise buildings in winds and cooling arrays in nuclear power plants. However, when this symmetry is broken, structures (e.g. ice-coated transmission cables in winds, as reported by Den Hartog (1932)) may be susceptible to another phenomenon typical of FIV, galloping, as opposed to, or in addition to, VIV. Galloping, associated with the asymmetric aerodynamic force arising from the body motion, is categorised as movement-induced excitation, whereas VIV, caused by the vortex shedding in the wake of a body, is categorised as instability-induced excitation (see Naudascher & Rockwell 2005). These FIV phenomena can lead to undesired vibration, fatigue damage of structures or even structural failures; therefore, the subject of FIV of bluff bodies has motivated a large body of fundamental research work that aims to characterise, predict and control FIV, as collected in comprehensive reviews by Bearman (1984), Sarpkaya (2004) and Williamson & Govardhan (2004) and books by Blevins (1990), Naudascher & Rockwell (2005) and Païdoussis, Price & De Langre (2010), among others. Of interest to the current study is the symmetry breaking introduced by the body rotation of an elastically mounted circular cylinder undergoing in-line FIV.
Previous studies of transverse FIV of bluff bodies (e.g. Corless & Parkinson 1988; Nemes et al. 2012; Zhao et al. 2014b) have shown that VIV can still occur under certain conditions of flow velocity and structural properties (e.g. mass and damping ratios), and dominate over a range of reduced velocity when the axial symmetry of a body is broken. It should be noted that the reduced velocity is defined by U∗
=U/( fnD), where U is the free-stream velocity, fn is the natural frequency of
the system (in quiescent fluid) and D is the cylinder diameter. In general, VIV is characterised by limited amplitude response (e.g. generally with the maximum amplitude of the order of one body diameter) and a lock-in region, where the body oscillation frequency matches that of the vortex shedding. Under broken symmetry, the galloping phenomenon may also be encountered, which is typically characterised by body oscillations with amplitudes increasing monotonically with the reduced velocity and frequencies much lower than that of vortex shedding (see Bearman et al. 1987). Unlike VIV which involves a mechanism of lock-in, galloping is driven by the asymmetric aerodynamic force resulting from the asymmetric pressure distribution around the body that is created by the instantaneous body orientation and the relative
oncoming flow. However, depending on the flow velocity and structural properties, the two phenomena of FIV may occur simultaneously, resulting in strong fluid–structure interaction, as demonstrated by Nemes et al. (2012) and Zhao et al. (2014b).
In the present study, while the axial symmetry of the body geometry is preserved, an axial asymmetry of the fluid–structure system is introduced by applying forced body rotation to an elastically mounted circular cylinder. The case of a rigidly mounted (non-oscillating) circular cylinder rotating about its axis in a uniform flow has been extensively investigated over the past century (e.g. Reid 1924; Swanson 1961; Mittal & Kumar 2003; Radi et al. 2013), to examine the effects of the imposed rotation on the wake structure and fluid forces, i.e. lift augmentation due to the Magnus effect (see Seifert 2012). It has been found in these previous studies that the fluid forces and the wake patterns are dependent on both the Reynolds number (Re) and the non-dimensional rotation rate of the cylinder (α). The Reynolds number is defined by Re = UD/ν, where ν is the kinematic viscosity of the fluid; the rotation rate is defined as the ratio between the cylinder surface tangential velocity (|Ω|D/2, with Ω the angular velocity) and the free-stream velocity (U), namely α = |Ω|D/(2U). In particular, asymmetric alternating Bénard–von-Kármán (BvK) vortex shedding (also known as mode-I shedding) occurs for low rotation rates 0 < α . 2 over a wide range of Reynolds number (see Coutanceau & Ménard 1985; Badr et al. 1990; Rao et al. 2013). While the BvK vortex shedding is suppressed for higher rotation rates α & 2, there exists a secondary regime (also known as mode-II shedding) of the unsteady wake over a narrow range of 4.3 . α . 5.6 (see Stojkovi´c, Breuer & Durst 2002; Kumar, Cantu & Gonzalez 2011). In this regime, single-sided vortex shedding occurs, with the shedding frequency much lower than that of two-sided BvK vortex shedding at lower rotation rates. In fact, there exist a number of regimes of steady and unsteady flow structures in the Re–α parameter space (Pralits, Giannetti & Brandt 2013; Rao et al. 2013, 2015).
Despite a significant amount of research on the rigidly mounted cylinder case, very few studies have been conducted to examine the impact of body rotation on FIV of an elastically mounted cylinder. Bourguet & Lo Jacono (2014) were the first to report a numerical study of the transverse FIV of a rotating cylinder at low Reynolds number. The numerical simulations in this study were performed at Re = 100 over a parameter space spanning the reduced velocity range 46 U∗
6 34 and the rotation rate range 06 α 6 4. They found that the magnitude of the time-averaged displacement of the cylinder tended to increase monotonically with the rotation rate, as did the time-averaged transverse lift force coefficient. Overall, they identified three response regimes of the fluid–structure system in the U∗
–α parameter space: the vibration region, the steady flow regime and the unsteady flow regime. In the steady and unsteady flow regimes, the oscillation amplitudes were observed to be extremely low (less than 0.05D). Over the entire vibration region, the structural response and the wake dynamics appeared to be synchronised, which was similar to the lock-in behaviour in VIV of the non-rotating case. Associated with such wake–body synchronisation, large oscillations were encountered, and the amplitude response was found to increase with the rotation rate for α 6 3.75. The peak of the normalised amplitude (A∗=
A/D, with A the oscillation amplitude) response observed was close to A∗=
1.9 at (α, U∗) = (3.75, 13), three times the peak response of the non-rotating
case. Meanwhile, in addition to the wake patterns (i.e. 2S, P+S) that have commonly been seen in previous studies of VIV of a non-rotating cylinder (e.g. Williamson & Roshko 1988; Jauvtis & Williamson 2004), they also identified a novel asymmetric wake pattern composed of a triplet of vortices and a single vortex shed per cycle,
referred to as the T+S pattern, which was attributed to the largest-amplitude response and moderate to low oscillation frequencies.
More recently, Wong et al. (2017) conducted extensive experiments to characterise the dynamic response and wake structures of a rotating cylinder undergoing transverse FIV over the Reynolds number range 1100. Re . 6300. They observed significant structural oscillations associated with wake–body synchronisation for rotation rates up to α ≈ 3.5. The amplitude response was reported in a statistical form of A∗
10
denoting the mean of the highest 10 % of normalised amplitude response peaks about their time-averaged positions, as in previous studies by Nemes et al. (2012) and Zhao et al. (2014b). It was found to increase with the rotation rate for α 6 2.0, prior to a decreasing trend for higher α values. The peak amplitude response was observed to be A∗
10≈1.4 at (α, U
∗) = (2.0, 6.0), a 76 % increase over the non-rotating
case. Moreover, overlaid on a contour map of the amplitude response in the U∗
–α parameter space, a variety of wake patterns and switching behaviours were observed.
Compared with transverse-only VIV of a non-rotating circular cylinder, only limited attention has been given to the case of one-degree-of-freedom (1-DOF) in-line VIV, mainly due to the fact that in-line vibration amplitudes are much lower (A∗
. 0.1) and perhaps less significant than the transverse-only VIV case (Leontini, Lo Jacono & Thompson 2011; Cagney & Balabani 2013a, 2014; Konstantinidis 2014). However, the earlier numerical study of Bourguet & Lo Jacono (2015) concerning 1-DOF in-line FIV of a rotating cylinder, again at a low Reynolds number Re = 100, showed that imposed body rotation could lead to large-amplitude oscillations. Overall, they identified two structural vibration regions and one steady flow region in the U∗
–α parameter space of 1 6 U∗
6 23 and 0 6 α 6 3.5. The first vibration region was encountered for 06 α . 1.8, where the system exhibited VIV synchronisation responses with the peak vibration amplitudes observed around U∗=
6. The maximum peak vibration amplitude in this region was observed to be 0.06D for α = 1.5. Similarly to the case of transverse VIV of a non-rotating cylinder, a wake–body synchronisation or lock-in region was also identified. Correspondingly, a 2S mode was found to be associated with the wake–body synchronisation. The second vibration region was characterised as a ‘galloping-like’ region, occurring for α > 2.65 and U∗
& 8. In this region, the cylinder oscillations resembled the transverse galloping responses of non-axisymmetric bodies, where the amplitude response tended to increase with U∗
without bound, e.g. to an amplitude response greater than 2.5D for (α, U∗) = (3.5, 23). The amplitude response was also found to increase with α for
a given U∗
. Correspondingly, the low-frequency and large-amplitude responses were found to be associated with novel asymmetric wake patterns, consisting of a pair and a triplet or a quartet of vortices shed per cycle. In the steady flow region, which lies between these two vibration regions in the U∗
–α parameter space, the flow remained steady and no structural vibration was observed.
In summary, previous numerical studies have investigated the FIV responses and wake patterns for both the 1-DOF transverse and in-line cases, but only at low Reynolds numbers. While in agreement with the previous low-Re studies that body rotation can both significantly enhance and suppress vibration amplitudes, the higher-Reynoldsnumber experimental study of Wong et al. (2017) has shown that the transverse case exhibits significantly different behaviour in terms of the wake–body synchronisation region with rotation rate, peak amplitude response and the wake patterns. These differences may arise from the difference between two-and three-dimensional flows. Moreover, given the different fluid–structure interaction mechanisms between the in-line and transverse cases as observed in two-dimensional
(a) (b) Support strucrure ... 1 1 V 1 : Cylinder (030 mm), : 1
!
u- z!
,.y
X ,.( 1 1 : 1I
/
Platform :i
1·
---����---
·
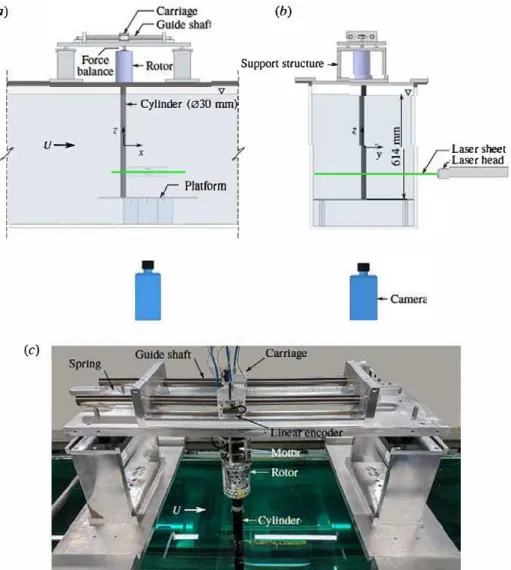
1 --, 1 1 (c) 0 •O z Laser sheet Laser beadFIGURE 2. (Colour online) Schematics of the experimental set-up are shown in (a) side
view and (b) back view. A photograph of the rig placed on top of the water channel is shown in (c).
the streamwise fluid force. It should be noted that the streamwise and transverse fluid force coefficients used in this study are defined by Cx
=
Fxf (pV2DL/2) andCy
=
Fy/(pV2DL/2), respectively, where p is the fluid density and L îs the cylinder immersed span.In the present study, the fluid-st.ructure system was modelled based on a low-friction air-bearing system in conjunction with a recirculating free-surface water channel of the Fluids Laboratory for Aeronautical and lndustrial Research (FLAIR) at Monasb University. The test section of the water cbannel has dimensions of 600 mm in widtb, 800 mm in depth and 4000 mm in length. The free-stream velocity in the present experiments could be varied continuously over the range 50::,; U:;;; 450 mm s-1• The free-stream turbulence level was less than 1 %. More details on this water-channel facility can be found in Nemes et al. (2012) and Zhao et al. (2014a,b). Figure 2
to clarify details. The air-bearing system was supported atop and in line to the water channel. One pair of air bearings (model S302502; New Way Air Bearings, USA) was installed inside a slider carriage that was guided by precision stainless steel shafts to provide linear movement. The structural stiffness of the oscillating system was controlled by precision extension springs.
The rigid precision-made cylinder model used had an outer diameter of D = 30 ± 0.01 mm. The immersed length of the cylinder was L = 614 mm, giving an aspect ratio of A = L/D = 20.5. To reduce end effects of the cylinder and to promote parallel vortex shedding, an end conditioning platform was used. This platform had a stand height of 165 mm and a top plate with dimensions of 600 mm in width × 500 mm in length × 6 mm in thickness featured with a 1 : 4 semi-elliptical leading edge to avoid flow separation. A gap between the cylinder free end and the platform surface was set at approximately 1 mm (3.3 %D).
The total oscillating mass of the system was m = 2479 g and the displaced mass of water was md =ρπD2L/4 = 433 g, giving a mass ratio of m∗ =m/md =5.73.
By conducting free-decay tests individually in air and in quiescent water, the natural frequencies of the system in air and quiescent water were measured to be fna =0.333 Hz and fnw =0.307 Hz, respectively. Thus, the added mass, given
by mA =(( fna/fnw)2−1)m, was found to be 438 g, and the added mass coefficient,
defined by CA =mA/md, was found to be 1.01. The structural damping ratio with
consideration of the added mass was found to be ζ = c/2√k(m + mA) = 2.44 × 10⁻³,
with c ' 0.0274 N sm−1 and k ' 10.83 N m−1.
The cylinder rotation was driven by a rotor mechanism consisting of a pair of precision ball bearings and a miniature stepper motor (model LV172; Parker Hannifin, USA) that was controlled by a micro-stepping drive (model E-DC) with a resolution of 25 000 steps per revolution and a Parker 6K2 motion controller. The rotor mechanism was mounted vertically to a force balance coupled with the slider carriage.
2.2. Data acquisition and processing methods
The data acquisition (DAQ) and the control of the free-stream velocity and motor rotation speed over the U∗
–α parameter space were automated using a workstation computer equipped with customised LabVIEW (National Instruments, USA) programs. The reduced velocity was varied over the range of 56 U∗
6 32 in increments between 0.1 and 0.5 (depending on structural response regimes). The Reynolds number range was 13496 Re 6 8624.
The body displacement was measured using a non-contact digital optical linear encoder (model RGH24; Renishaw, UK). This linear encoder had a resolution of 1 µm and a linear range of ±200 mm available. An optical rotary encoder with a resolution of 4000 counts per revolution (model E5-1000; US Digital, USA) was used to measure the rotation speed.
The in-line fluid force (Fx) acting on the vibrating cylinder was determined
based on (2.1). On this point, in order to validate the body acceleration derived from the digital linear encoder signals, comparison measurements of the transverse VIV of a non-rotating cylinder were conducted against a high-sensitivity MEMS (micro-electro-mechanical system) accelerometer (model 3741E122G; PCB, USA). Validation test samples are provided in the Appendix. However, the measurement signals of the accelerometer in rotating cases could be severely affected by electromagnetic noise emitted from the driving motor. Thus, a technique based on accurately derived body velocity and acceleration was employed to determine Fx,
since the linear encoder signal was digital and its measurement accuracy was not affected by electromagnetic noise. The method and approach have been detailed and validated in Zhao et al. (2014b). On the other hand, the transverse lift (Fy) was
measured by employing a force balance based on semiconductor strain gauges (see Zhao et al. 2014a,b).
The flow structures in the near wake of the cylinder were measured using the particle image velocimetry (PIV) technique. The flow was seeded with hollow micro-spheres (model Sphericel 110P8; Potters Industries Inc.) having a normal diameter of 13 µm and a specific weight of 1.1 g m−3. Illumination was provided
by two miniature Ng:YAG pulse lasers (model Minilite II Q-Switched; Continuum Lasers, USA) that produced a 3 mm thick horizontal planar sheet. Imaging was performed using a high-speed camera (model Dimax S4; PCO AG, Germany) with a resolution of 2016 pixel × 2016 pixel. The camera was equipped with a 50 mm lens (Nikon Corporation, Japan), giving a magnification of approximately 9.73 pixel per mm for the field of view of interest. The PIV images pairs were sampled at 10 Hz. For each PIV measurement case in the U∗
–α space, a set of 3100 image pairs was recorded for analysis. To provide an insight into the evolution of the wake structures, which could be perturbed quickly by the cylinder rotation, images of each set were sorted into 48 phases based on the instantaneous phase angle between the cylinder displacement and velocity, yielding at least 60 image pairs for averaging. The PIV data were processed using validated in-house software developed by Fouras, Lo Jacono & Hourigan (2008) using 32 pixel × 32 pixel interrogation windows in a grid layout with 50 % window overlap.
2.3. Experimental validation
The experimental methodologies have been validated in previous related studies (e.g. Nemes et al. 2012; Zhao et al. 2014a,b; Wong et al. 2017; Sareen et al. 2018). To provide a brief validation, a study of transverse VIV of a non-rotating cylinder was conducted to compare with previous work by Khalak & Williamson (1997) and Zhao et al. (2014b). The comparison of the amplitude and frequency responses as a function of reduced velocity in figure 3 shows that in general the present results agree very well with the previous studies. It should be noted that A∗
max in these two
previous studies represents the maximum amplitude at each U∗
. In figure 3(a), the typical three amplitude response branches, consisting of the initial, upper and lower branches named by Khalak & Williamson (1996), are seen in the present results. The initial branch occurs for U∗
6 4.9; the upper branch exists for the range 5 6 U∗
6 6.2; the lower branch covers the range 6.2 < U∗
6 10.7; the desynchronisation region appears for U∗> 10.7. Compared with the peak amplitude responses of the previous
studies with lower mass ratio (m∗
=2.4), where A∗
max≈0.95 in Khalak & Williamson
(1997) and A∗
max≈1.0 and A ∗
10≈0.95 in Zhao et al. (2014b), the current system sees
a peak of A∗
10 ≈0.8. In the lower branch, where the cylinder oscillations are highly
periodic, the amplitude response remains fairly stable at A∗
10 ≈0.6, consistent with
the previous studies.
Figure 3(b) shows a power spectral density (PSD) heatmap of the normalised frequency response, defined by f∗ =
f/fnw, as a function of the reduced velocity.
The construction method for this heatmap can be found in Zhao et al. (2014b) and Wong et al. (2017). In the figure, the dot-dashed line represents the variation of the normalised vortex-shedding frequency ( fsh/fnw) with U∗ for the case of a stationary
cylinder. The horizontal dotted line refers to f∗ =
1 to highlight U∗
-12 -10 -8 -6 -4 -2 0 0 0.5 1.0 1.5 0 0.5 1.0 1.5 2.0 _ x* -Cx -Cy 0 0.5 1.0 1.5 2.0 2.5 3.0 3.5 å U* = 15 U* = 20 U* = 25 (a) (b) (c)
FIGURE 5. (Colour online) Measurements and estimation of ¯x∗ as a function of α at
three different U∗
values. In (a), the solid lines represent the estimated ¯x∗
based on the Cx of a rigidly mounted cylinder shown in (b) for each U
∗
. In (c), the corresponding mean transverse lift is presented. The dashed lines represent the corresponding fifth-order polynomial fit curves for each U∗
.
Remarkably, the estimated ¯x∗
predicts well its response in the actual vibration cases, although discrepancies do exist over the range of 2.2 < α < 3.0 at U∗=
15.0 and 25.0. These discrepancies are attributable to strong fluid–structure interaction characterised by large-amplitude oscillations in this α range, which will be presented in §3.1.2. Clearly, in all of the cases, ¯x∗
monotonically decreases to its minimum as α increases up to 1.75, prior to a gradual increase for higher α values. This trend resembles that seen for Cx of the rigidly mounted cylinder case in figure 5(b). Compared with the
similar variation of ¯x∗
with α observed by Bourguet & Lo Jacono (2015), where Cx
of the rigidly mounted cylinder monotonically decreased as α was increased over the range 06 α 6 4 at Re = 100 (see Stojkovi´c et al. 2002; Bourguet & Lo Jacono 2014), the present results reveal a strong relation to Cx of the rigidly mounted cylinder,
despite some minor deficits between the measured and estimated ¯x∗
values. It should be noted that as α is further increased to around 2.2, ¯x∗
experiences a slight jump. This behaviour is associated with a jump in the amplitude response,
which will be discussed in §3.1.2. The results for Cy in figure 5(c) will be discussed
in §3.2.
3.1.2. Amplitude responses
The normalised vibration amplitude response (A∗
10) about its time-averaged position
as a function of U∗
is characterised for varying values of α in figure 6. For clarity of the presentation, the α cases associated with small- and large-amplitude responses are plotted separately in figures 6(a) and 6(b), while figures 6(c) and 6(d) present the results in two different 3D views. As can be seen in the figure, for the low rotation rates (i.e. α 6 1.75), the vibration amplitude tends to become less responsive to the cylinder rotation with increasingα up to 1.75, at which the minimum values of ¯x∗
and Cx of the rigidly mounted cylinder are observed. In this range of α, the amplitude
response appears to be scattered, and no ‘lock-in’ or synchronisation regions are identified over the reduced velocity range investigated (56 U∗
6 32). The maximum value of A∗
10 observed is 0.22 at U ∗ =
32. When the rotation rate is increased to α = 2.00, the amplitude response becomes slightly larger than that of α = 1.75. Of interest is a narrow synchronisation region present at U∗ ≈
10–10.4, characterised by a small jump in the A∗
10 response. This will be further clarified by the frequency
response.
As the rotation rate is further increased to the range of 2.20 6 α 6 3.15 shown in figure 6(b), substantially larger oscillations are encountered. Forα = 2.20, the cylinder vibration remains unresponsive to the rotation rate for U∗
up to 8.5 (figure 7a.i). Further increase of U∗ results in a rapid increase in the amplitude response to reach
a plateau with A∗
10 ≈0.24 at U
∗≈10, which is followed by a progressive increase
trend towards a maximum value of A∗
10=0.72 at U ∗
=19.5. Over this U∗
range, the body oscillations are strongly periodic, with the oscillation frequency synchronised with the dominant frequency of the fluid forcing. The periodicity in this U∗
range is illustrated by the time traces of the cylinder vibration in figure 7(a.ii,a.iii). After this, the A∗
10 response fluctuates slightly and then drops sharply to A ∗
10≈0.17 at U ∗=
22.5. Associated with this drop, the time-averaged position shown in figure 4 deviates slightly from its original trend in the lower U∗
range. For higher U∗
, the cylinder oscillations exhibit much less periodicity, with A∗
10 values fluctuating around 0.22
(figure 7a.iv), indicating that the fluid–structure interaction becomes desynchronised. For the case of α = 2.25, the vibration response in general appears to be similar to that ofα = 2.20; however, the fluid–structure synchronisation region occurs at slightly lower reduced velocity U∗=
8.0 and covers a wider range of reduced velocity up to U∗=
26.5; the A∗
10 response sees its maximum value of 0.90 at U ∗=
26, prior to a sudden drop leading to the desynchronised region for high U∗. Moreover, similar to
that seen for α = 2.20, a slight dip in the ¯x∗ trend associated with this sudden drop
in A∗
10 is observed at U ∗
=26.5 in figure 4.
For the cases ofα = 2.50 and 2.75 (highlighted in black symbols), the onset of the fluid–structure synchronisation tends to occur at an even lower reduced velocity (i.e. U∗=
7.2) than that of the other lower α values. Moreover, the A∗
10 response increases
rapidly to reach a plateau with A∗
10≈0.40 for α = 2.50 and A ∗
10≈0.46 for α = 2.75
over the range of 96 U∗
6 11. Interestingly, the synchronisation persists, with the amplitude response increasing monotonically and unboundedly for the rest of the U∗
range investigated. As illustrated in figure 7(b.ii–b.iv), the body oscillations remain highly periodic. It should be noted that the synchronisation was observed to exist for up to U∗=
40 in other tests (not shown here) that used the same experimental model with softer springs for lower fnw values to extend the range of U∗. In general, the
-1.6 -0.8 0 0.8 1.6 -1.0 -0.50 0.5 1.0 -0.5 0 0.5 -0.1 0 0.1 ~x* ~x* ~x* ~x* (a.i) (a.ii) (a.iii) (a.iv) -1.6 -0.8 0 0.8 1.6 -1.0 -0.50 0.5 1.0 -0.5 0 0.5 -0.1 0 0.1 (b.i) (b.ii) (b.iii) (b.iv) 0 10 20 30 40 † 0 10 20† 30 40
FIGURE 7. Time traces of the cylinder oscillations for (a) α = 2.20 and (b) α = 2.75
at U∗
=7.0, 10.0, 19.5 and 30.0 in (i–iv), respectively. Strongly periodic oscillations are observed in the synchronisation region, as illustrated in (a.ii,a.iii) and (b.ii–b.iv). It should be noted that ˜x∗
denotes the normalised oscillatory component of the cylinder motion; τ = tfnw is the normalised time.
At high rotation rates (i.e. α = 3.25 and 3.50), the vibration response appears to be similar to that for α = 2.00, but with a more distinct synchronisation region around U∗=
9. The A∗
10 response exhibits similar magnitude to the non-rotating case (α = 0)
for high reduced velocities (U∗> 24).
To show better the effects of body rotation on the vibration response, the vibration response as a function ofα is investigated here for different fixed U∗
values. Figure 8 shows (a) the A∗
10 response and (b) its time-averaged position as a function of α at
several U∗
values of interest. The selection of these U∗
values was based on how each represents the dynamic response (i.e. the magnitudes of A∗
10, Cx and Cy) at similar
U∗
and how the dynamic response evolves with increasing U∗
. As can be seen in the figure, the cylinder vibrations remain very unresponsive (A∗
10. 0.2) to the body
rotation over the low range α 6 1.75. In this α range, the A∗
10 responses, if they are
detectable, tend to reduce to minimum with increasing α, as do the ¯x∗
trends. For the moderate range 2.20 6 α 6 3.15 highlighted in the grey region, significantly larger-amplitude oscillations are encountered generally, while the wake–body synchronisation regions and amplitude magnitudes depend on U∗
. In addition, the α value at which peak A∗
10 occurs shifts as U
∗ increases, i.e. from α = 2.50 with A∗
10=0.14 at U ∗=7.0
to α = 2.85 with A∗
10 =1.41 at U ∗=
25.0. Of particular interest is the vibration for higher rotation rates α > 3.20, where the oscillation amplitudes drop substantially to low values, e.g. A∗
10≈0.2 for U ∗ =
0 0.5 1.0 1.5 0 0.5 1.0 1.5 2.0 0.5 1.0 1.5 2.0 2.5 3.0 3.5 å _ x* (a) (b) U* = 7 U* = 8 U* = 9 U* = 10 U* = 12 U* = 15 U* = 20 U* = 25 A* 10
FIGURE 8. (Colour online) The vibration response as a function of the rotation rate at
different reduced velocities. (a) The normalised amplitude responses; (b) the normalised time-averaged displacement. In (b), the dashed lines represent the fifth-order polynomial fit curves for each case of U∗
.
results of Bourguet & Lo Jacono (2015), where the cylinder oscillations increase with α for a given U∗ in the second vibration region (α > 2.7).
3.1.3. Frequency responses
Many previous studies (e.g. Zhao et al. 2014b; Bourguet & Lo Jacono 2015) concerning FIV of bluff bodies have shown that large-amplitude oscillations are associated with wake–body synchronisation. In order to provide insights into the fluid–structure mechanisms of wake–body synchronisation, a frequency spectrum analysis is presented in this subsection.
Figures 9–11 show the normalised logarithmic-scale PSD contours of the frequency response of the body vibration ( f∗
), the streamwise fluid force ( f∗
Cx) and the transverse lift force ( f∗
Cy), respectively, as a function of U
∗
for varying α. In these figures, for clarity of the presentation, the α cases associated with low-amplitude responses are plotted in (a) while the cases with large-amplitude responses are plotted in (b).
In the absence of cylinder rotation (α = 0), where the body oscillations appear to be broadly non-periodic with fluctuating amplitudes tending to increase with U∗
(see figure 9a.i), the frequency responses f∗
and f∗
Cx in figures 9(a.ii) and 10(a.ii), respectively, reveal that while broadband noise appears with relatively strong intensity over the entire spectra, the subharmonic at fnw/3 (or f∗=1/3) highlighted by a dotted
line is found to be dominant throughout the U∗
range investigated. As expected, on the other hand, the response of f∗
Cy follows the Strouhal vortex-shedding trend highlighted by the dot-dashed line in figure 11(a.ii).
For low rotation rates α = 0.50 and 1.50, the one-third subharmonic remains consistently in the responses of f∗
and f∗
rates for this α range, i.e. from St ' 0.206 at α = 0 to St ' 0.239 at α = 1.50. However, the responses of f∗
Cy in figure 11(a.ii–a.iv) indicate that the vortex shedding is gradually attenuated as α increases, presumably leading to suppression of the amplitude response. For the next higher rotation rate α = 1.75, the vortex shedding appears to be fully suppressed, as evidenced by the appearance of broadband noise in the entire spectrum in figure 11(a.v). This means that the fluctuating fluid forcing component is reduced to a minimum. Indeed, this also sees minimum vibration magnitudes.
When the rotation rate is further increased to α = 2.00, the dominant frequency of body oscillation switches to be approximately f∗
=1, but still with broadband noise obviously shown in figure 9(a.vi). Here, it should be noted that a very narrow wake–body synchronisation region occurs over 10.0 . U∗
. 10.4, with the dominant frequency components of the periodic body oscillations matching those of the fluid forces, on the basis that the fluid forces arise from the wake dynamics. This sees a small ride-up in the A∗
10 response previously described in §3.1.2.
Strikingly, as the rotation is still further increased to α = 2.20, the wake–body synchronisation region becomes dramatically widened over the reduced velocity range 8.5 . U∗
. 19.5 as in §3.1.2. Within this synchronisation region, a number of interesting features are immediately apparent from inspection of the corresponding amplitude response and frequency PSD contour plots shown in figures 9–11. All three of the PSD contour plots in (b.ii) of figures 9–11 exhibit a very clear composition of frequency components, which is indicative of highly periodic body oscillations as a result of strong fluid–structure interaction. Of particular interest is the appearance of the second and third harmonic frequencies (i.e. f∗=
2 and 3) in both of the two fluid force components and also synchronisation of their harmonics. In the previous studies of Zhao et al. (2014b) and Wang et al. (2017) concerning transverse FIV, it was suggested that large-amplitude oscillations associated with strong fluid–structure interaction were attributable to harmonic synchronisations. Similarly, Bourguet & Lo Jacono (2015) observed in in-line FIV of a rotating cylinder that the wake–body synchronisation that involved harmonics of the flow velocity in the wake and the streamwise force led to galloping response in the second vibration region, where oscillation amplitudes appeared to increase unboundedly but not monotonically with U∗
. In addition to the harmonic contributions to large-amplitude oscillations, the present results also demonstrate that the frequency of the streamwise force of a freely vibrating cylinder can be modulated by body rotation to be synchronised with that of the transverse force. Associated with such harmonic synchronisation, the amplitude response behaves in a VIV synchronisation behaviour for a low reduced velocity range 8.5 . U∗
. 10.8, where well-defined vortex shedding is found to be synchronised with cylinder oscillations; it then develops in a rotation-induced galloping behaviour with a linear growth trend for 10.8 < U∗
. 19.5. As it is induced by the body rotation, this type of vibration response is named rotation-induced galloping, to differentiate from the conventional transverse galloping. It should be noted that the boundary between the VIV synchronisation and rotation-induced galloping regimes is identified based on the onset of the monotonic amplitude growth trend. Significantly different from conventional transverse galloping of a bluff body (e.g. square cylinder), which is commonly found to be dominated by a frequency much lower than the natural frequency of the system, this rotation-induced galloping response is dominated by the frequency component matching fnw. However, it cannot be maintained for higher
reduced velocities outside the synchronisation region. All of these vibrational features are also observed at the slightly higher rotation rate α = 2.25, however with a
slightly wider harmonic synchronisation. As expected from the amplitude responses previously discussed, further increase of the rotation rate to higher values α = 2.50, 2.75 and 3.00 means that, as a result of stronger fluid–structure enhanced by cylinder rotation, harmonic synchronisations persist unboundedly as U∗
is increased (see figures 9b.iv–b.vi–11b.iv–b.vi).
Nevertheless, a rotation-induced galloping response occurs within a limitedα range up to 3.15, at which the amplitude and frequency responses (see figures9b.vii–11b.vii) resemble those seen in the earlier cases of α = 2.20 and 2.25. Similarly, beyond α = 3.15, the vibration response (e.g. α = 3.25 shown in figures 9–11a.vii) resembles that seen for α = 2.00.
To show more clearly the effects of body rotation on harmonic synchronisation regions, the vibration response as a function of α for different fixed U∗
values (the same as in figure 8) is plotted in figure 12. Four cases with VIV synchronisation response are presented in (a), while other four cases with rotation-induced galloping response are plotted in (b). As can be seen in the figure, harmonic synchronisation regions are generally encountered over the range 2.20 . α . 3.20, except for the cases U∗ =
9.0 and 10.0, showing that the harmonic synchronisation regions may exceed α = 3.5.
3.2. Fluid forces
In this subsection, the focus is on the effect of cylinder rotation on the coefficients of the fluid forces over the parameter space under study. In addition, the phases of the transverse lift and vortex forces with respect to cylinder displacement will also be discussed.
The fluctuating component of the streamwise force is intrinsically coupled with the body vibration. Figure 13 presents the variation of the root-mean-square (r.m.s.) coefficient of the streamwise fluid force (CRMS
x ) with U ∗
for varying α. As can be seen in figure 13(a), CRMS
x in the cases without a VIV synchronisation region (i.e.
0 6 α 6 1.75) remains relatively constant and under 0.05 through the U∗
range investigated, whereas it is observed to surge to reach a peak value of 0.19 at U∗ =
9.0 in the VIV synchronisation region of α = 3.25. Similarly, for the cases with large-amplitude response in figure 13(b), CRMS
x increases dramatically at the
beginning of the synchronisation region to reach its peak at U∗ = 9.0, and then
decreases sharply for reduced velocities up to U∗ ≈
11. The peak CRMS
x values of
the largest-amplitude-response cases (i.e. α = 2.50, 2.75 and 3.00) are almost two times those of the other cases, e.g. 0.42 at α = 2.75 compared with 0.23 of α = 3.15. For rotation-induced galloping regions at higher reduced velocities (U∗
& 12), CRMS x
decreases monotonically and gradually.
Figure 14 shows the time-averaged (Cy) and fluctuating (CyRMS) components of
the transverse lift as a function of U∗
for the same fixed α values. Clearly, due to the Magnus effect, the magnitude of Cy increases with α. In general, Cy remains
constant as U∗
is varied, despite some minor deviations occurring at low reduced velocities (U∗
. 12) for high rotation rates (α > 2.20). This is significantly different from the low-Reynolds-number results of Bourguet & Lo Jacono (2015), where substantial fluctuations of Cy in accordance with the amplitude response were globally
encountered in the second vibration region. On the other hand, the fluctuating part CRMS
y in figure 14(b,c) exhibits similar trends versus U ∗
to those of CRMS
x . It should be
noted that the magnitudes of CRMS
y in the rotation-induced galloping regions decrease
only marginally compared with those peaks observed in the VIV synchronisation regions.
1.5 0.5 0.5 0.4 0.3 2.0 1.5 1.0 0.5 0 0 0.5 1.0 1.5 2.0 2.5 3.0 3.5 0.2 0.1 0 0 –2 –4 –6 –8 –10 –12 0 (a) (b) (c) (d)
FIGURE 15. (Colour online) The time-averaged and fluctuating components of the
transverse lift as a function of α at different U∗
values. The dashed lines in (a) represent the fifth-order polynomial fit curve for each U∗
case. The solid line in (c) represents the polynomial fit curve through all of the measurements of the rigidly mounted cylinder case in figure 5(c). The symbol legend is given in (d). The area shaded in grey highlights the region (2.20 6 α 6 3.15) associated with significant body oscillations.
0 0.5 1.0 1.5 2.0 2.5 3.0 3.5 (a) (b) 180 135 90 45 0 180 135 90 45 0
FIGURE 17. (Colour online) The total phase (a) and the vortex phase (b) as a function α
for various fixed U∗
values (as in figure 8). The symbol legend is given in (a). The area shaded in grey highlights the region (2.20 6 α 6 3.15) associated with significant body oscillations.
in the case of transverse FIV of a rotating cylinder by Wong et al. (2017), noting that the C(AS) mode involves switching behaviour. Moreover, the present CA-I pattern is similar to the S-I mode which was named for the shedding of symmetric small vortices in streamwise VIV of a non-rotating cylinder by Cagney & Balabani (2013a,b), while the primary difference is that the CA-I pattern is deflected by the cylinder rotation. Unlike the C(AS) and S-I modes, the CA-I pattern appears to be stable, with no wake mode switching or competition behaviour observed; however, the size of the shed vortices reduces as U∗
or α is increased.
In vibration region I, a dominant wake mode persists across the region, for which VIV synchronisation occurs. Here, the wake structure is identified as the A(2S) pattern, as demonstrated in figure 20. This wake mode is composed of two asymmetric single (S) vortices of opposite sign shed per oscillation cycle, which appears to be a deflected 2S mode due to the effects of cylinder rotation. Such a wake mode is also apparent for similar oscillation amplitudes (A∗
10 . 0.5) in the parameter ranges of
4. U∗
. 5 and 1.5 . α . 2.3 in the study of transverse FIV of a rotating cylinder by Wong et al. (2017). Differently from the case of Wong et al. (2017), where positive (anticlockwise) and negative (clockwise) vortices have similar size and strength, the present measurements show that the negative vortices (in blue) shed from the
0 0 –0.5 –1.0 –1.5 –2.0 –2.5 –3.0 0.5 1.0 © 1.5 2.0 2.5 3.0 3.5
FIGURE 23. Variation of γ against α. Negative values indicate that the system state is
stable against galloping according to the quasi-steady approximation. However, it is clearly closer to neutrally unstable over the range 2.20 < α < 3.15, where large rotation-induced galloping oscillations are observed to occur.
forcing to help to maintain the resonance. Indeed, figure 17 suggests that this is the situation. The vortex phase, which is the phase difference between the vortex forcing and the displacement signal, is initially close to zero from the onset of the rotation-induced galloping U∗ range for rotation rates corresponding to large
oscillations. This means that as the body begins to move downstream, the vortex force also increases, helping to sustain the oscillations. Thus, it appears that the galloping behaviour is assisted by the induced vortex shedding into the wake, suggesting that these oscillations are generated by the combination of quasi-steady forcing together with vortex-induced vibration.
It is perhaps also of interest that it is not clear that the same mechanism directly applies to the low-Reynolds-number case examined by Bourguet & Lo Jacono (2015). In that case, the mean drag curve does not increase beyond α = 2, so quasi-steady theory does not assist in maintaining the resonance.
4. Conclusions
The results presented here are the first to characterise experimentally the in-line FIV of a rotating circular cylinder. Careful experiments were conducted extensively over a wide parameter space of 56 U∗
6 32 and 0 6 α 6 3.5, and characteristics, including the vibration response, fluid forces and wake structures, of the fluid–structure system were examined.
There are three observed vibration regions which exhibit VIV synchronisation (vibration region I), rotation-induced galloping (vibration region II) and desynchronised (vibration region III) responses in the parameter space under study. In regions I and II, significantly larger body oscillations were found to be associated with wake–body synchronisation. The present study showed that the peak amplitude can reach up to ∼0.5D in the VIV synchronisation region and up to 1.56D in a monotonically and unboundedly increasing trend in the rotation-induced galloping region. In the desynchronised region, on the other hand, cylinder oscillations were chaotic, and the peak amplitude was observed to be ∼0.25D. These results have shown that cylinder rotation can cause distinctly different vibration responses, with substantially larger amplitudes compared with previous studies of in-line VIV of a non-rotating cylinder which report very small peak oscillation amplitudes (.0.15D) in lock-in regions.
Furthermore, it was found that significant body vibration occurred within the rotation rate range 2.20 . α . 3.15 (depending on U∗
). In particular, unboundedly increasing amplitude response with reduced velocity was found for rotation rates 2.75 6 α 6 3.00. This is significantly different from the previous low-Reynolds-number results that oscillation amplitudes increased with α for a given U∗
in the rotation-induced galloping region (the second vibration region).
Force measurements showed that the time-averaged displacement can be well predicted based on the mean drag coefficients of a rigidly mounted rotating cylinder. It was found that the cylinder vibration had little effect on Cx of a rotating cylinder
for the range 06 α 6 1.75, in which Cx decreased monotonically to its minimum
with increasing α, while minor deficits between the vibrating and non-vibration cases were observed for 2.50 6 α 6 3.00. In general, on the other hand, the magnitude of Cy (the Magnus force) increased quadratically with α for both the vibrating and
non-vibrating cylinders. These results indicate that the cylinder vibration has a subtle effect on the mean fluid forces over the rotation rate range investigated. The peak values of CRMS
x and C
RMS
y were found to be 0.42 and 1.6, respectively, at U ∗ '
9.0 in the VIV synchronisation region. In the rotation-induced galloping regime, CRMS
x
decreased considerably as U∗
was increased, whereas CRMS
y decreased marginally.
Interestingly, frequency PSD contours showed that harmonic components of f∗=
1, 2 and 3 appeared simultaneously in the streamwise and transverse fluid forces when the body oscillation frequency matched the dominant frequency of vortex shedding (or the lift force). This means that the imposed rotation can modulate the frequency of the streamwise fluid force to be synchronised with that of the transverse lift in in-line FIV.
Particle image velocimetry measurements were focused on a fixed rotation rate (α = 2.75) across the three vibration regions. Additionally, several adjacent locations outside the VIV synchronisation and rotation-induced galloping regions were examined. It was found that the wake in the adjacent desynchronised region exhibited CA-I patterns, which were composed of a coalescence of small vortices of opposite sign shed simultaneously. Across the VIV synchronisation region, a dominant wake pattern A(2S) was observed, which was composed of two single vortices of opposite sign shed per oscillation cycle that were deflected asymmetrically, across the VIV synchronisation region. At the early stage of the rotation-induced galloping response, a CA-II mode was observed for reduced velocity up to U∗=
15. For higher U∗
values, a CA-III mode was encountered with substantially large oscillations. It is of great interest that the imposed rotation can cause regular vortex shedding in in-line FIV at rotation rates that see suppression of the BvK vortex shedding in the case of a rigidly mounted cylinder (α & 1.75).
As our results demonstrate, the vibration regimes in this study are distinctly different from those of the previous low-Reynolds-number numerical simulations by Bourguet & Lo Jacono (2015). Thus, it would be of further interest to investigate the effect of Reynolds number on the vibration response in the U∗
–α space. It is also of interest to examine whether significant vibration would reoccur beyond α = 3.5, as previous studies of rigidly mounted cylinders have indicated that a secondary vortex-shedding regime may occur at high α values.
Acknowledgements
The support from Australian Research Council Discovery Project grants DP150102879 and DP170100275 is gratefully acknowledged.
Supplementary movies
Supplementary movies are available at https://doi.org/10.1017/jfm.2018.357.
Appendix
Figure24 shows validation tests for the derived body acceleration against the direct measurements of the accelerometer for a non-rotating cylinder experiencing VIV at four different reduced velocities.
0.005 0 –0.005 0.02 0 –0.02 0.2 0 –0.2 0.2 0 –0.2 0.02 0 –0.02 0.025 0 –0.025 0.01 0 –0.01 0.1 0 0 5 10 t (s) t (s) 15 20 0 5 10 15 20 –0.1 (a.i) (b.i) (a.ii) (b.ii) (c.i) (d.i) (c.ii) (d .ii)
FIGURE 24. (Colour online) Validation test sample time traces of the body acceleration
derived from the linear encoder against the measurements using the accelerometer for four different reduced velocities associated with transverse VIV of a non-rotating cylinder: (a) U∗
=4.50 (initial branch), (b) U∗
=5.6 (upper branch), (c) U∗
=6.5 (lower branch) and (d) U∗
=8.0 (lower branch). It should be noted that the upper subplots show time traces of the body displacement and the lower subplots show the derived body acceleration (black dot-dashed line) against the measured value (blue solid line). Clearly, the derived values match the direct measurements.
REFERENCES
BADR, H., COUTANCEAU, M., DENNIS, S. & MENARD, C. 1990 Unsteady flow past a rotating circular cylinder at Reynolds numbers 103 and 104. J. Fluid Mech. 220, 459–484.
BEARMAN, P. W. 1984 Vortex shedding from oscillating bluff bodies. Annu. Rev. Fluid Mech. 16 (1), 195–222.
BEARMAN, P. W., GARTSHORE, I. S., MAULL, D. & PARKINSON, G. V. 1987 Experiments on flow-induced vibration of a square-section cylinder. J. Fluids Struct. 1 (1), 19–34.
BLEVINS, R. D. 1990 Flow-Induced Vibration, 2nd edn. Krieger Publishing Company.
BOURGUET, R. & LO JACONO, D. 2014 Flow-induced vibrations of a rotating cylinder. J. Fluid Mech. 740, 342–380.
BOURGUET, R. & LO JACONO, D. 2015 In-line flow-induced vibrations of a rotating cylinder. J. Fluid Mech. 781, 127–165.
BROOKS, P. H. N. 1960 Experimental investigation of the aeroelastic instability of bluff two-dimensional cylinders. M.A.Sc., University of British Columbia.
CAGNEY, N. & BALABANI, S. 2013a Mode competition in streamwise-only vortex induced vibrations. J. Fluids Struct. 41, 156–165.
CAGNEY, N. & BALABANI, S. 2013b Wake modes of a cylinder undergoing free streamwise vortex-induced vibrations. J. Fluids Struct. 38, 127–145.
CAGNEY, N. & BALABANI, S. 2014 Streamwise vortex-induced vibrations of cylinders with one and two degrees of freedom. J. Fluid Mech. 758, 702–727.
CORLESS, R. & PARKINSON, G. V. 1988 A model of the combined effects of vortex-induced oscillation and galloping. J. Fluids Struct. 2 (3), 203–220.
COUTANCEAU, M. & MÉNARD, C. 1985 Influence of rotation on the near-wake development behind an impulsively started circular cylinder. J. Fluid Mech. 158, 399–446.
DEN HARTOG, J. P. 1932 Transmission line vibration due to sleet. Trans. Amer. Institute of Electrical Engineers 51 (4), 1074–1076.
FENG, C. C. 1968 The measurement of vortex induced effects in flow past stationary and oscillating circular and D-section cylinders. Master’s thesis, The University of British Columbia. FOURAS, A., LO JACONO, D. & HOURIGAN, K. 2008 Target-free stereo PIV: a novel technique
with inherent error estimation and improved accuracy. Exp. Fluids 44 (2), 317–329. GOVARDHAN, R. & WILLIAMSON, C. H. K. 2000 Modes of vortex formation and frequency response
of a freely vibrating cylinder. J. Fluid Mech. 420, 85–130.
GOVARDHAN, R. & WILLIAMSON, C. H. K. 2006 Defining the ‘modified Griffin plot’ in vortex-induced vibration: revealing the effect of Reynolds number using controlled damping. J. Fluid Mech. 561, 147–180.
JAUVTIS, N. & WILLIAMSON, C. H. K. 2004 The effect of two degrees of freedom on vortex-induced vibration at low mass and damping. J. Fluid Mech. 509, 23–62.
KHALAK, A. & WILLIAMSON, C. H. K. 1996 Dynamics of a hydroelastic cylinder with very low mass and damping. J. Fluids Struct. 10 (5), 455–472.
KHALAK, A. & WILLIAMSON, C. H. K. 1997 Fluid forces and dynamics of a hydroelastic structure with very low mass and damping. J. Fluids Struct. 11 (8), 973–982.
KLAMO, J. T., LEONARD, A. & ROSHKO, A. 2005 On the maximum amplitude for a freely vibrating cylinder in cross-flow. J. Fluids Struct. 21 (4), 429–434.
KONSTANTINIDIS, E. 2014 On the response and wake modes of a cylinder undergoing streamwise vortex-induced vibration. J. Fluids Struct. 45, 256–262.
KUMAR, S., CANTU, C. & GONZALEZ, B. 2011 Flow past a rotating cylinder at low and high rotation rates. Trans. ASME J. Fluids Engng 133 (4), 041201.
LEONTINI, J. S., LO JACONO, D. & THOMPSON, M. C. 2011 A numerical study of an inline oscillating cylinder in a free stream. J. Fluid Mech. 688, 551–568.
MITTAL, S. & KUMAR, B. 2003 Flow past a rotating cylinder. J. Fluid Mech. 476, 303–334. NAUDASCHER, E. & ROCKWELL, D. 2005 Flow-Induced Vibrations: An Engineering Guide. Dover. NEMES, A., ZHAO, J., LO JACONO, D. & SHERIDAN, J. 2012 The interaction between flow-induced vibration mechanisms of a square cylinder with varying angles of attack. J. Fluid Mech. 710, 102–130.
PAÏDOUSSIS, M., PRICE, S. & DE LANGRE, E. 2010 Fluid–Structure Interactions: Cross-Flow-Induced Instabilities. Cambridge University Press.
PARNAUDEAU, P., CARLIER, J., HEITZ, D. & LAMBALLAIS, E. 2008 Experimental and numerical studies of the flow over a circular cylinder at Reynolds number 3900. Phys. Fluids 20 (8), 085101.
PRALITS, J. O., GIANNETTI, F. & BRANDT, L. 2013 Three-dimensional instability of the flow around a rotating circular cylinder. J. Fluid Mech. 730, 5–18.
RADI, A., THOMPSON, M. C., RAO, A., HOURIGAN, K. & SHERIDAN, J. 2013 Experimental evidence of new three-dimensional modes in the wake of a rotating cylinder. J. Fluid Mech. 734, 567–594.
RAO, A., LEONTINI, J., THOMPSON, M. C. & HOURIGAN, K. 2013 Three-dimensionality in the wake of a rotating cylinder in a uniform flow. J. Fluid Mech. 717, 1–29.
RAO, A., RADI, A., LEONTINI, J. S., THOMPSON, M. C., SHERIDAN, J. & HOURIGAN, K. 2015 A review of rotating cylinder wake transitions. J. Fluids Struct. 53, 2–14.
REID, E. G. 1924 Tests of rotating cylinders. NACA Tech. Memorandum 209.
SAREEN, A., ZHAO, J., LO JACONO, D., SHERIDAN, J., HOURIGAN, K. & THOMPSON, M. C. 2018 Vortex-induced vibration of a rotating sphere. J. Fluid Mech. 837, 258–292.
SARPKAYA, T. 2004 A critical review of the intrinsic nature of vortex-induced vibrations. J. Fluids Struct. 19 (4), 389–447.
SEIFERT, J. 2012 A review of the Magnus effect in aeronautics. Prog. Aerosp. Sci. 55, 17–45. STOJKOVI ´C, D., BREUER, M. & DURST, F. 2002 Effect of high rotation rates on the laminar flow
around a circular cylinder. Phys. Fluids 14 (9), 3160–3178.
SWANSON, W. M. 1961 The Magnus effect: a summary of investigations to date. Trans. ASME J. Basic Engng 83 (3), 461.
WANG, Z., DU, L., ZHAO, J. & SUN, X. 2017 Structural response and energy extraction of a fully passive flapping foil. J. Fluids Struct. 72, 96–113.
WILLIAMSON, C. H. K. & GOVARDHAN, R. 2004 Vortex-induced vibration. Annu. Rev. Fluid Mech. 36, 413–455.
WILLIAMSON, C. H. K. & ROSHKO, A. 1988 Vortex formation in the wake of an oscillating cylinder. J. Fluids Struct. 2 (4), 355–381.
WONG, K. W. L., ZHAO, J., LOJACONO, D., THOMPSON, M. C. & SHERIDAN, J. 2017 Experimental investigation of flow-induced vibration of a rotating circular cylinder. J. Fluid Mech. 829, 486–511.
ZHAO, J., LEONTINI, J. S., LO JACONO, D. & SHERIDAN, J. 2014a Chaotic vortex induced vibrations. Phys. Fluids 26 (12), 121702.
ZHAO, J., LEONTINI, J. S., LO JACONO, D. & SHERIDAN, J. 2014b Fluid–structure interaction of a square cylinder at different angles of attack. J. Fluid Mech. 747, 688–721.