www.earth-surf-dynam.net/3/409/2015/ doi:10.5194/esurf-3-409-2015
© Author(s) 2015. CC Attribution 3.0 License.
Vertical movements of frost mounds in subarctic
permafrost regions analyzed using geodetic survey and
satellite interferometry
I. Beck1,5, R. Ludwig2, M. Bernier3, T. Strozzi4, and J. Boike1
1Alfred Wegener Institute, Helmholtz Centre for Polar and Marine Research, Potsdam, Germany 2Department of Geography, Ludwig Maximilian University, Munich, Germany
3Centre Eau, Terre & Environnement, Institut National de la Recherche Scientifique, Québec, Canada
4GAMMA Remote Sensing Research and Consulting AG, Gümlingen, Switzerland
5GIScience Research Group, Institute of Geography, Heidelberg University, Heidelberg, Germany
Correspondence to: I. Beck ([email protected])
Received: 13 March 2015 – Published in Earth Surf. Dynam. Discuss.: 15 April 2015 Revised: 24 June 2015 – Accepted: 29 June 2015 – Published: 10 August 2015
Abstract. Permafrost-affected soils cover about 40–45 % of Canada. The environment in such areas, especially those located within the discontinuous permafrost zone, has been impacted more than any other by recorded climatic changes. A number of changes, such as surface subsidence and the degradation of frost mounds due to permafrost thawing, have already been observed at many locations.
We surveyed three frost mounds (lithalsas) in the subarctic, close to Umiujaq in northern Quebec, using high-precision differential global positioning system (d-GPS) technology during field visits in 2009, 2010 and 2011, thus obtaining detailed information on their responses to the freezing and thawing that occur during the course of the annual temperature cycle. Seasonal pulsations were detected in the frost mounds, and these responses were shown to vary with their state of degradation and the land cover. The most degraded lithalsa showed a maximum amplitude of vertical movement (either up or down) between winter (freezing) and summer (thaw-ing) of 0.19 ± 0.09 m over the study period, while for the least degraded lithalsa this figure was far greater (1.24 ± 0.47 m). Records from areas with little or no vegetation showed far less average vertical movement over the study period (0.17 ± 0.03 m) than those with prostrate shrubs (0.56 ± 0.02 m), suggesting an influence from the land cover.
A differential interferometric synthetic aperture radar (D-InSAR) analysis was also completed over the lithal-sas using selected TerraSAR-X images acquired from April to October 2009 and from March to October 2010, with a repeat cycle of 11 days. Interferograms with baselines shorter than 200 m were computed revealing a gen-erally very low interferometric coherence, restricting the quantification of vertical movements of the lithalsas. Vertical surface movements of the order of a few centimeters were recorded in the vicinity of Umiujaq.
1 Introduction
Permafrost underlies 40–45 % of Canada and is significantly affected by the global climate. Climate modeling suggests that increasing air temperatures are to be expected over the next 40 years, with a large increase expected in this area of up to 10◦C during the winter months (Allard et al., 2007). Such elevated air temperatures will affect the soil
tempera-ture, which has been modeled to increase by about 4◦C by 2070 (Sushama et al., 2006). Such warming would increase thawing during the summer months, leading to an increase in marshlands or wetlands and encouraging the formation of new lakes (Rowland et al., 2010; Smith et al., 2004).
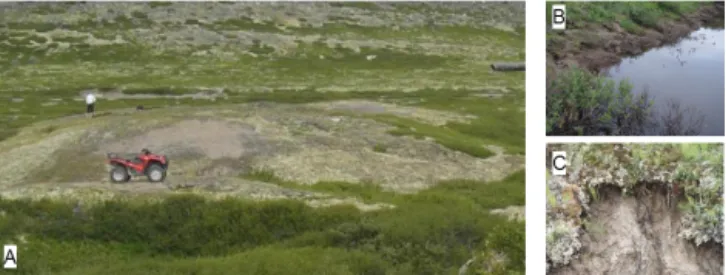
Characteristic landforms of the discontinuous permafrost zone, such as palsas and lithalsas (Fig. 1a), are also likely to suffer as a result of increasing soil temperatures,
espe-Figure 1. (a) A typical lithalsa within the study area near Umi-ujaq (northern Quebec) with a diameter of 20 m. Photo taken in April 2009, to the east of the cuestas (56◦330N, 76◦280W). (b) Thermokarst pond and eroding slope on Lithalsa R. (c) Cracks up to 0.5 m deep on slope of Lithalsa R.
cially as the ground temperature in these features is usually already above −2◦C. Lithalsas are permafrost mounds; they are typical of northern Quebec and Lapland and are formed by ice segregation in a similar manner to palsas. In contrast to palsas, however, lithalsas have no insulating cover of peat (Calmels, 2008; Zoltai and Tarnocai, 1975; Zuidhoff, 2002; Zuidhoff and Kolstrup, 2005), which makes them more sensi-tive to changes in temperature (Pissart, 2000; Seppälä, 1988). Lithalsas and palsas normally form low circular or oval fea-tures that are about 5 m high, 10–30 m wide, and up to 150 m long. The ice lenses of their permafrost cores are usually no thicker than 3 cm, but lenses up to 40 cm thick have been described (Gurney, 2001; Pissart, 2002). Their anticipated degradation with continued warming is likely to have severe direct and indirect consequences for the ecosystem, the hy-drological regime, and the vegetation and ultimately also af-fect the human population (Nelson et al., 2003).
Changes to the land surface within the area covered by this study (around Umiujaq in northern Quebec) over recent years have been attributed to permafrost thawing. A number of studies (e.g., Laberge and Payette, 1995; Fortier and Aubé-Maurice, 2008) have shown that longer, warmer summer pe-riods result in degradation (and even disappearance) of these mounds, accompanied by subsidence of the surrounding ter-rain.
Increasing temperature and pressure gradients in winter encourage the formation of segregation ice and cause frost heave. During the thawing period the opposite occurs and lithalsas subside (Skaven-Haug, 1959). Long-term climatic variations are expected to elicit responses to changing air temperatures that are comparable to these annual changes. Calmels et al. (2008), for example, surveyed a lithalsa close to our own study area and recorded thaw settlement of 1 m over a 5-year period.
In this study we have investigated the seasonal dynam-ics of lithalsas on the eastern shore of Hudson Bay, in the Nunavik region of northern Quebec, Canada, using a differ-ential system (d-GPS) and satellite-based differdiffer-ential SAR interferometry (D-InSAR).
D-GPS technology has been successfully used for a wide range of scientific applications, although it has only really been used for geocryological purposes since the mid-1990s. For example, Theakstone et al. (1999) used d-GPS technol-ogy to generate maps and a digital elevation model (DEM) for a glacier in central Norway claiming a vertical accu-racy of 0.1 m, Kaufmann (1998) used d-GPS technology to evaluate the stability of reference points on a rock glacier in the Austrian Alps, Tait and Moormann (2003) found the use of d-GPS technology to be the best approach for moni-toring topographic movements in continuous permafrost re-gions, and Tait et al. (2005) used d-GPS technology to sur-vey frost mounds within the continuous permafrost zone. A number of research teams have also successfully used d-GPS technology to monitor frost heave and thaw subsidence. For example, Little (2006), Little et al. (2003) and Nelson et al. (2001) collected d-GPS measurements in flat areas of northern Alaska, where they recorded heave and subsi-dence movements of up to 0.06 m. Shiklomanov et al. (2013) used d-GPS technology to quantify isotropic thaw subsi-dence in permafrost areas of northern Alaska, and Wirz et al. (2015) derived the temporal variability of mountain per-mafrost slopes using d-GPS measurements.
In addition to field measurements, remotely sensed radar data have also been used to detect vertical movements in per-mafrost regions from space, by means of differential interfer-ometry. Differential interferometry synthetic aperture radar (D-InSAR) uses the phase content of a complex radar sig-nal to detect land surface deformations by transforming the phase difference between two acquisitions into a displace-ment figure (e.g., Bamler and Hartl, 1998). Changes of the order of centimeters, or even millimeters, can be observed depending on the sensor’s wavelength. Such an analysis re-quires at least two scenes of the area of interest, recorded by the same sensor but at different times, and an appropriate DEM. D-InSAR has mainly been used to detect large-scale deformations caused by earthquakes (e.g., Yen et al., 2008) or by seismic and volcanic activities (e.g., Ge et al., 2008; Amelung et al., 2000), but it has also been used to monitor glacier velocity (e.g., Goldstein et al., 1993). The first exten-sive studies of permafrost thawing and freezing in the Arctic (North Slope of Alaska) using D-InSAR were based on data from the ERS SAR sensor (C-band, 5.7 cm wavelength) (Liu et al., 2010, 2011). Data have also been available at a higher spatial resolution since 2006 from COSMO-SkyMed (ASI, 2007), based on shorter wavelengths (X-band 3.6 cm), and since 2007 from the TerraSAR-X satellite (DLR, 2010). A number of studies have since been initiated using TerraSAR-X data to investigate vertical movements caused by per-mafrost thawing within the Arctic region (Larsen et al., 2009, 2011; Lauknes et al., 2010a, b; Short et al., 2011, 2014; Strozzi et al., 2012).
Little is known about the surface movements of frost mounds (lithalsas), in particular about their responses to the freezing and thawing that occurs during the course of an
annual temperature cycle, or the relationship between these movements and the state of degradation of the frost mounds or their vegetation cover. We therefore surveyed three lithal-sas in the Canadian subarctic using d-GPS technology to ob-tain more detailed information. In order to investigate the use and effectiveness of new and innovative technologies we also used D-InSAR data which, to the author’s best knowl-edge, have not previously been used to investigate this type of permafrost landform. We analyzed TerraSAR-X images ac-quired between April and October 2009 and between March and October 2010, with a repeat cycle of 11 days, from which we obtained valuable information concerning the possibility of using D-InSAR in this kind of environment.
2 Study area description
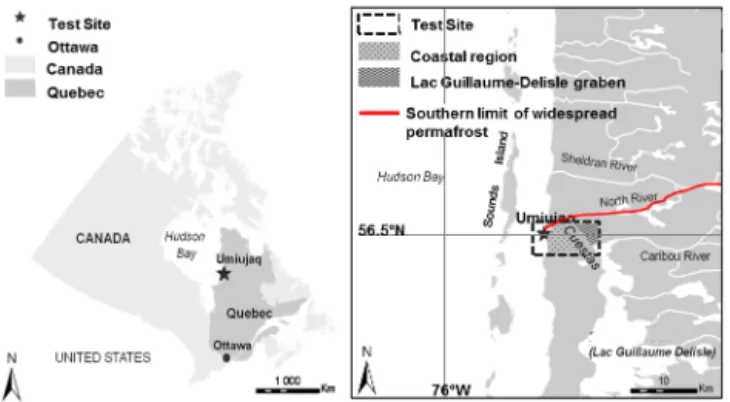
The study area covers about 60 km2and is located near the Inuit village of Umiujaq (56◦330N, 76◦330W), close to the eastern shoreline of Hudson Bay in Nunavik, northern Que-bec, Canada (Fig. 2).
The study area lies in the transition zone between the sub-arctic and the Arctic, where a high sensitivity to climatic changes is expected, making it an ideal region in which to conduct a climate change impact study. The permafrost is sporadic (Fig. 2) and the study area covers the northern tim-ber line; the mean annual ground temperature (MAGT) at a depth of 10 m is about −2.5◦C (Smith et al., 2010).
There are currently only 60–80 frost-free days per year in the study area (Environment Canada, 2004) and the an-nual average air temperature is about −5.5◦C but, due to the
proximity of Hudson Bay, the region is characterized by high temperature variability throughout the year. From June un-til mid-December the climate has a maritime character with little diurnal variation in temperature and moderate temper-atures of about 8◦C. In contrast, when Hudson Bay freezes, winter temperatures can reach −30◦C due to continentality. In addition, the annual average wind speeds in this area are between 20 and 24 km h−1(Gagnon and Ferland, 1967), re-sulting in wind-chill temperatures down to −60◦C (Environ-ment Canada, 2004). The average annual precipitation is ap-proximately 500 mm (Phillips, 1984), of which 37 % falls as snow (Environment Canada, 2004).
The study area can be divided into a coastal region with gently sloping topography and the Lac Guillaume-Delisle graben (Fig. 2). The two landscape units are separated by ridges of outcropping bedrock (consisting of volcanic sedi-ments) known as “cuestas” (Kranck, 1951). The entire study area is experiencing a heterogeneous post-glacial rebound that averages about 1.0 cm yr−1 (Lajeunesse and Allard, 2003; Tait and Moorman, 2003).
Temperatures in the region around Umiujaq are expected to increase by up to 10◦C over the next 40 years, with the rate of increase expected to be highest during the winter months (Allard et al., 2007). Such an increase in air
temper-Figure 2.Location of the study area in the vicinity of Umiujaq, northern Quebec, Canada (left), and the distribution of the two main types of landscape (right): the coastal region to the west of the cues-tas and the Lac Guillaume-Delisle graben to the east of the cuescues-tas. The approximate boundary between widespread discontinuous per-mafrost to the north and sporadic perper-mafrost to the south (based on Allard and Séguin, 1987) is shown in red.
ature would have an impact on the soil temperature, which would in turn be expected to increase by approximately 4◦C by 2070. These modeling results obtained by Sushama et al. (2006) suggest a significant future deepening of the active layer, which would be likely to result in thaw-related settle-ment (Calmels, 2008).
3 Data and methods
The data used for this study consisted of information col-lected during field visits in 2009, 2010 and 2011, to-gether with remotely sensed data acquired by the German TerraSAR-X satellite. The in situ measurements provided de-tailed information on the seasonal variations in lithalsas at specific locations and were also used to validate the results obtained from analysis of the remote sensing data. Table 1 shows the acquisition dates for the d-GPS and TerraSAR-X data, as well as details of the useable differential interfero-grams. Thaw depths were also measured at the same time as the other field measurements were obtained, using a frost probe.
3.1 Field data
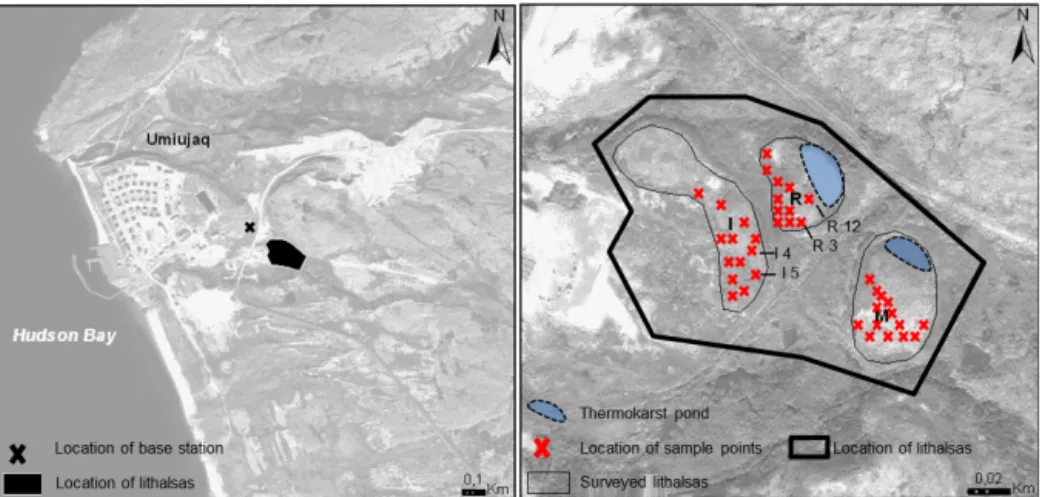
The three lithalsas investigated (identified as I, R, and M) are located to the southeast of the community of Umiujaq (Fig. 3).
They are each about 40 m in diameter and between 5 and 10 m high. They comprise a mixture of patches of bare ground and areas covered by lichens or prostrate shrubs, with their slopes being covered in small shrubs. A detailed soil map (1 : 10 000 scale) by Doyon et al. (2010) identifies the three features as ice-rich frost mounds (“buttes cryogènes riche en glace”). Lithalsas I and R lie within a zone of aeo-lian sediments dominated by sand, sandy silt, gravelly sand,
Table 1.Acquisition dates for the d-GPS and TerraSAR-X data and details of the useable differential interferograms considered in this study. Detailed dates of useable interferograms
Year D-GPS TerraSAR-X Dates Temporal Perpendicular
acquisition dates acquisition dates baseline [d]a baseline [m]b
2009 20 Apr 7 May 7 May/14 Aug 99 125.36
14 Aug 14 Aug
25 Aug 14 Aug/25 Aug 11 −66.79
27 Sep
30 Oct 14 Aug/30 Oct 55 12.78
2010 25 Mar 22 Mar
8 May 5 May 5 May/12 Aug 99 0.43
12 Aug 12 Aug
23 Aug 12 Aug/23 Aug 11 −159.00
27 Oct 28 Oct 12 Aug/28 Oct 77 −195.41
2011 9 Apr
aTime delay between the acquisitions.
bSeparation in meters between two antenna positions.
Figure 3.Left: location of the surveyed lithalsas and the base station, southeast of Umiujaq (background: GeoEye image from 25 Septem-ber 2009). Right: enlargement showing the three lithalsas (I, R and M) and the locations of the individual measurement points. The identified measurement points (R3, R12, I4, I5) are specifically discussed in Sect. 4.
and gravel (“sable, silt sableux, sable graveleux et gravier”). Lithalsa M is further to the southeast in an area of marine and littoral sediments consisting mainly of sand but including beds of heavy minerals and shell fragments (“sable moyen à grossier avec présence de lits de minéraux lourds et de frag-ments de coquillages”). Adjacent to the southern slope of this lithalsa lies a poorly drained wetland area (Doyon et al., 2010).
The three lithalsas all exhibit clearly different states of degradation. A 220 m2pond on the eastern side of Lithalsa R provides evidence that this lithalsa is in the process of breaking up, with additional evidence coming from the pres-ence of numerous cracks and small-scale solifluction features (Fig. 1b). A pond has also formed on the north-facing slope of Lithalsa M, but its dimensions are smaller (Fig. 3) and
there are far fewer cracks than at Lithalsa R. Degradation at Lithalsa M is therefore interpreted to be less advanced than at Lithalsa R. There is, in contrast, no evidence of degrada-tion at Lithalsa I, which has no pond and no visible cracks. Table 2 summarizes the characteristics of the three lithalsas. Seven field visits were made between August 2009 and April 2011, covering the full range of seasons. The three lithalsas were surveyed using a ProMark 3 GPS from Magellan with a NAP100-L1 antenna. D-GPS technology allows accurate measurement of vertical movements (at cen-timeter or even sub-cencen-timeter scales) within a worldwide geodetic coordinate system. This is achieved using normal code-based GPS technology, which acquires coordinate positions through triangulation by defining the interspace between at least four satellites and a receiver (UNVACO,
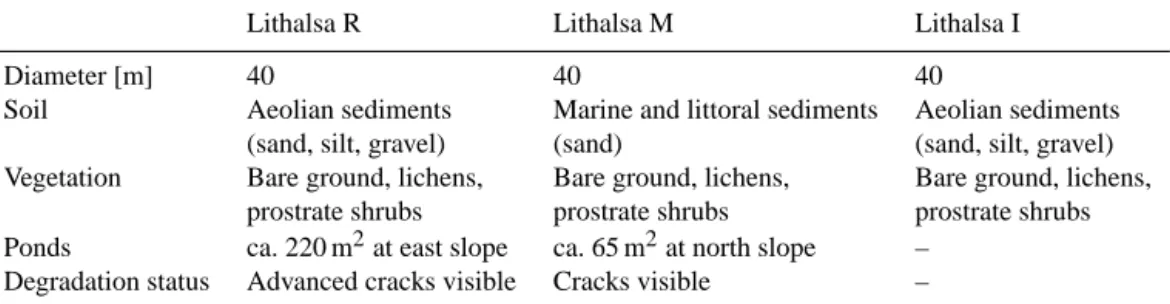
Table 2.Characteristics of the three lithalsas.
Lithalsa R Lithalsa M Lithalsa I
Diameter [m] 40 40 40
Soil Aeolian sediments Marine and littoral sediments Aeolian sediments
(sand, silt, gravel) (sand) (sand, silt, gravel)
Vegetation Bare ground, lichens, Bare ground, lichens, Bare ground, lichens, prostrate shrubs prostrate shrubs prostrate shrubs Ponds ca. 220 m2at east slope ca. 65 m2at north slope –
Degradation status Advanced cracks visible Cracks visible –
http://www.unavco.org/projects/project-support/polar/base_ stations_and_survey_systems/base_stations_and_survey_ systems.html). This kind of GPS only has an accuracy of a few meters, but this is improved by using a differential system (d-GPS) equipped with at least two receivers. One of the two receivers serves as the base station: it has a known (fixed) position from which it tracks the satellites. The other receiver (the rover receiver) is placed at a par-ticular point for only a limited period of time (usually between 15 and 60 s: http://www.trimble.com/gps_tutorial/). By comparing the signals from the two receivers at the same point in time, systematic errors, such as those due to atmospheric signal delays or variations in the preci-sion of the orbits, can be substantially reduced (Trimble, www.trimble.com/gps/dgps-advanced2.shtml). For this the “kinematic stop-and-go d-GPS method” (Berber et al., 2012) was used. Hofmann-Wellenhof et al. (2008) suggested that the best accuracy was achieved with this method if the phase ambiguities were resolved before starting the survey. This we achieved through the use of a static initialization process provided by Magellan in their initialization equipment. The numbers recorded by the d-GPS were stored in RINEX (Receiver Independent Exchange) format. The data were analyzed using the GNSS Solution v3.10.07 post-processing software (Magellan), with the data being imported into the software and then processed by adjusting vectors in relation to a fixed control point received from the base station.
Coordinates and elevations for the 39 measurement points (R1–R12, M1–M14, and I1–I13) over the three lithalsas were determined in August 2009; March, May, and August 2010; and April 2011. The base station was always mounted at the same location, about 500 m from the lithalsas, close to a marked trigonometric point on stable bedrock where changes in elevation caused by frost heave or thawing sub-sidence could be excluded. Unfortunately the original de-tails of this trigonometric point could not be obtained and, due to the remoteness of the study area, no permanent ref-erence station was available. Since this introduced the pos-sibility of errors in the recorded position of the base station, the measured coordinates needed to be manually corrected for each record date before running the post-processing soft-ware. This correction was undertaken using the online
ser-vice provided by the NRCan’s Geodetic Survey Division (www.geod.nrcan.gc.ca/index_e.php) in which the recorded coordinates are submitted to the system, together with infor-mation concerning the processing mode and the reference system. The precise point position (PPP) is then calculated based on the Canadian Spatial Reference System (CSRS) (Bisnath and Gao, 2009). The coordinates finally defined by the CSRS for the base station were 56.55◦N and 76.54◦E.
These coordinates then served as a control point for the pro-cessing described above. Both horizontal and vertical uncer-tainties were calculated during post-processing. The horizon-tal error was found to be between 0.001 cm (Lithalsa M) and 0.098 cm (Lithalsa R), and the vertical error between 0.001 cm (Lithalsa M) and 0.123 cm (Lithalsa I).
The points on the three lithalsas at which measurements were to be recorded by the mobile receiver were first selected in August 2009. It was important to ensure that they were located within snow-free areas and in either non-vegetated patches or sparsely vegetated patches (with lichens and/or prostrate shrubs). The selected points were marked with a metal pin about 20 cm long, hammered into the ground and wrapped with pink tape.
The Magellan user’s guide states that a vertical accuracy of “up to” 1.5 cm is attainable when using a recording time of at least 15 s, and that this may be improved by using longer recording times. For this study a recording time of 60 s at each point was chosen, and since there were no obstacles interrupting the signal this should ideally have resulted in an accuracy of several millimeters. However, because of the need to compute a correction for the coordinates of the base station,l the vertical accuracy was reduced to within a few centimeters (∼ 5 cm).
3.2 Remote sensing data
In addition to the ground measurements, contemporaneous records from the TerraSAR-X satellite were also examined. Launched in June 2007, this satellite acquires high-quality X-band radar images with a spatial resolution of down to 1 m whilst circling the Earth in a polar orbit at an altitude of 514 km. The frequency that the X-band sensor operates at is 9.65 GHz, which corresponds to a wavelength of about 3 cm (DLR, 2010). Its repetition time is 11 days. There are
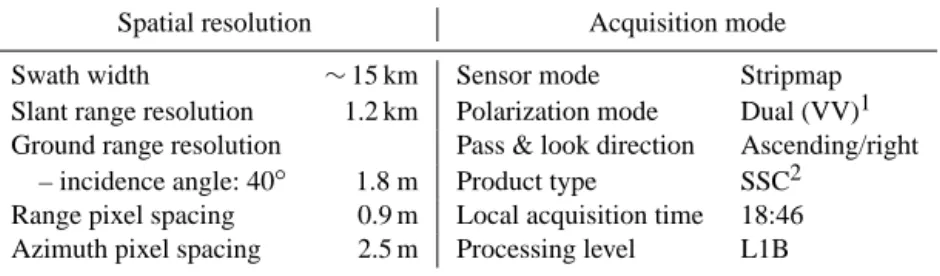
sev-Table 3.Characteristics of the TerraSAR-X sensor and the acquisition mode used for this study (based on CAF, 2009).
Spatial resolution Acquisition mode
Swath width ∼15 km Sensor mode Stripmap
Slant range resolution 1.2 km Polarization mode Dual (VV)1 Ground range resolution Pass & look direction Ascending/right
– incidence angle: 40◦ 1.8 m Product type SSC2 Range pixel spacing 0.9 m Local acquisition time 18:46 Azimuth pixel spacing 2.5 m Processing level L1B
1VV: vertical/vertical;2SSC: single-look slant range complex.
eral acquisition modes available and we based our choice of the most suitable mode on coherence images computed from more than 30 images acquired in 2009 on different passes, at different polarizations, and with different angles of inci-dence. We considered only images acquired in the stripmap mode, scanning the surface with a footprint of 30 × 50 km and a spatial resolution of about 3 m (Table 3), in order to ob-tain the best possible compromise between maximum spatial resolution and maximum coverage. Our investigations indi-cated that data from an ascending pass, in VV polarization and with an incidence angle of 40◦, were the most suitable for the study (Spannraft, 2010; May, 2011). Interferograms computed from winter acquisitions could not be considered, because snow influenced the radar signal, resulting in too lit-tle coherence to process.
TerraSAR-X interferograms were computed using a single-look in “range” and a 1-look in “azimuth” in order to achieve the best possible resolution over the lithalsas. A very high resolution DEM was used for the differential inter-ferometry, in a two-pass approach (Bamler and Hartl, 1998). The DEM was produced by the Direction de la cartographie topographique du ministère des ressources et de la faune à Québec (MRNF) from stereoscopic analysis of aerial pho-tographs, and has a spatial resolution of 1 m. GAMMA soft-ware (GAMMA Remote Sensing AG, 2008) was used for the processing and an area of 6000 × 2000 pixels defined for the calculation of the differential interferograms. In order to support phase unwrapping and as a measure of the quality of the interferograms, coherence was estimated using an adap-tive window from the 1-look differential SAR interferograms (Wegmüller and Werner, 1996). The coherence was first esti-mated using a fixed, relatively small window size of 15 pix-els. The window size was then determined from the first es-timate, applying successively larger windows up to 45 pixels in order to estimate lower coherence. This procedure enabled us to obtain reliable coherence values without compromis-ing too much on the spatial resolution. The differential inter-ferograms, which in their initial stage only contained infor-mation on the phase difference, were then unwrapped using the minimum-cost flow algorithm in order to retrieve verti-cal displacement (Constantini and Rosen, 1999). The high-resolution DEM was also used for georeferencing.
4 Results and discussion
4.1 Field measurements – differential GPS (d-GPS) Results
The field measurements showed a similar pattern at most of the measurement points, with 88.9 % of these points record-ing uplift durrecord-ing freezrecord-ing periods (after August 2009–March 2010: average uplift 0.44 m; August 2010–April 2011: av-erage uplift 0.11 m) and subsidence during thawing (March 2010–August 2010: average subsidence 0.46 m). The verti-cal movements at those measurement points that did not con-form to this pattern were small (average: 0.1 m) compared to the average vertical movement of all points of 0.4 m between August 2009 and April 2011.
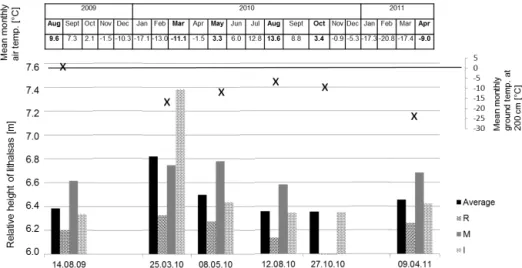
Figure 4 shows the heights of the lithalsa surfaces (both an average height for all three lithalsas and separate heights for each lithalsa, averaged from all the relevant measurement points) over the 20-month period relative to the height of the base station, measured on six different dates (14 Au-gust 2009; 25 March, 8 May, 12 AuAu-gust, and 27 Octo-ber 2010; and 9 April 2011) and interpolated over the en-tire 20-month period. It should be pointed out that, for Oc-tober 2010, observations were only available from Lithalsa I due to the weather conditions that did not allow for further measurements.
The average heights (black bars) increase by 0.44 m be-tween August 2009 and March 2010, followed by a rapid decrease between March and May 2010 of 0.32 m, with a further decrease of 0.14 m in August 2010, followed in turn by a slight increase of 0.10 m in April 2011. The difference between the highest average elevation (March 2010) and the lowest average elevation (August 2010) was 0.47 m. Between March and May 2010 an average subsidence across all lithal-sas of 0.35 m was recorded, which represents 70.6 % of the total subsidence over the entire year 2010. The subsequent average subsidence across all lithalsas between May and Au-gust 2010 was far less (0.12 m) even though the period was nearly 2 months longer.
The relative heights of the individual lithalsas (grey bars) all show similar trends, but the amplitudes of their vertical movements vary considerably: Lithalsa R shows the least
Figure 4.Heights of the three lithalsas (grey bars) and their average heights (black bars), relative to the base station, on the six measuring dates spread over a 20-month period. The heights represent the average of heights from all measurement points within each individual lithalsa. The records are accurate to within a few centimeters. The lithalsas were not covered by snow during the measurements. The temperatures at the top are the mean monthly air temperatures of the specific year provided (CEN, 2013). Temperatures written in bold are for the month with d-GPS measurements.
variation in height over time (August 2009–April 2011), with the maximum recorded vertical movement being the sub-sidence of 0.19 m between March and August 2010. All recorded vertical movements totaled over the entire period and averaged over all measurement points on Lithalsa R amounts to 0.48 m. The net movement of lithalsa R amounts to 0.06 m.
The maximum recorded vertical movement averaged across all measurement points on Lithalsa M was 0.20 m (be-tween May and August 2010), and the total vertical move-ment (as for Lithalsa R) was 0.57 m. Lithalsa M reached its maximum uplift 2 months later than the other lithalsas.
Lithalsa I showed much greater vertical movement over the year than the other lithalsas, with a dramatic peak in its relative height in March 2010 followed by a very rapid de-crease to May 2010. The greatest vertical movement (1.24 m) occurred between August 2009 and March 2010, and the sum of all vertical movement (as above) over the entire period was 3.2 m. Lithalsa I is the only lithalsa for which records are available from October 2010. The net movement at Lithalsa I (0.01 m) was again less than the net movement at the other two lithalsas.
Analyzing the measurements from individual measure-ment points (Fig. 3) reveals that the smallest vertical move-ment occurred at a point on Lithalsa R (R3), which had less than 0.2 m total movement over the 20-month period. The largest vertical movements (i.e., the summations of all move-ments at each location over the 20-month period) occurred at I4 (5.7 m) and I5 (6.0 m) on Lithalsa I. These high num-bers on Lithalsa I are largely due the rapid subsidence that occurred between March and May 2010. Observations from the R12 point indicate continuous subsidence during this pe-riod. This behavior is probably due to the location of R12
on the outer slope of the lithalsa (Fig. 3), where advanced degradation is evident in the form of cracks and solifluction. Taking into account the different trends over the 20-month period as well as the behavior at the individual measurement points, it is clear that Lithalsa I was the most dynamic lithalsa over the observation period, while Lithalsa R was the least dynamic. Lithalsa I was not only the most dynamic at all of the measurement points but also showed the greatest amount of variation between the measurement points. Hence, as far as the seasonal behavior of the frost mounds is concerned, the lithalsa with the least evidence of degradation (Lithalsa I) is the most active of the three lithalsas, while Lithalsa R, which shows the most advanced signs of degradation, is the least active.
Discussion
The field records clearly confirm the expected seasonal frost heave and thaw subsidence and reveal a correlation between a lithalsa’s degradation and its seasonal variations. They also indicate that these processes do not operate in a linear man-ner over the whole year: the frost heave during the freezing period (starting after August 2009) was rather slow compared to the rapid subsidence that followed the initial thaw in late April or May. The freezing process therefore seems to op-erate much more slowly than the thawing process. The very minor frost heave observed during the 2010–2011 freezing period (average across all lithalsas: 0.04 m) was not as pro-nounced as that observed during the previous (2009–2010) freezing period. The possibility of early thawing in 2011 hav-ing already resulted in any subsidence by April can be dis-counted as air temperatures were still well below 0◦C (the average air temperature for January–April 2011 was −16◦C;
CEN, 2013). There are, however, two other possible expla-nations: (i) maximum thawing had probably not yet been reached in August 2010, which would mean that the lithal-sas were still in the process of subsiding (as suggested by the observations from Lithalsa I in October 2010, which show further subsidence of 0.03 m since August 2010), and (ii) the late initiation of freezing in 2010, when air temperatures did not drop permanently below 0◦C until 17 November, which is almost 1 month later than in 2009 (20 October: CEN, 2013), is likely to have delayed the uplift process, which was therefore possibly not yet completed in April 2011.
A detailed analysis of each individual measurement point yielded additional information: the low average increase in elevation recorded between August 2010 and April 2011 is due to 35 % of the measurement points actually experiencing subsidence rather than elevation. Five of these points in par-ticular (R6, R9, R11, M4, and M13) showed a great deal of subsidence (averaging −0.19 m) and were therefore largely responsible for the low average uplift. The seasonal uplift (frost heave) trend is thus dampened by just 13 % of the mea-surements that exhibit high counter-trends (i.e., subsidence). If these five points are ignored, the average uplift amounts to almost 0.1 m.
In order to better understand the behavior at individual measurement points we also took into account the vegeta-tion and noted that 93 % of the subsiding points were ei-ther vegetation-free or covered with only a few patches of lichen. Thirteen of the 14 measurement points that recorded subsidence between August 2010 and April 2011 also ex-perienced below-average frost heave in the preceding win-ter of 2009–2010. Eighty-five percent of the points with be-low average uplift were either mostly covered with lichen or non-vegetated. Those measurement points with above-average uplift (> 61 % of all measurement points in the win-ter of 2009/2010 and > 83 % of all measurement points in the winter of 2010/2011) were covered with prostrate shrubs. A similar observation can be made for the summer thawing process (May–August 2010): 78 % of the points with be-low average subsidence (14 out of 39) were either covered with lichen or non-vegetated, while (88 %) of the points with above-average subsidence (25 out of 39) were covered with prostrate shrubs. Between March and May 2010 none of the non-vegetated or lichen-covered measurement points showed above-average subsidence, but most (80 %) of these points showed either continuing uplift or minor subsidence. Areas with prostrate shrubs therefore clearly start to subside earlier than those with little or no vegetation. In view of the weather in the spring of 2010, temporary early thawing is a real pos-sibility as there had already been 17 days with temperatures of up to 6◦C (reached on 31 March 2010; CEN, 2013) before the survey was conducted (8 May 2010).
The lower overall dynamics at non-vegetated measure-ment points is not surprising since the records of the thaw depths during the same year (2010) indicate that non-vegetated areas had very shallow (5–60 cm) thaw depths in
the summer (August) compared to areas covered with shrubs or trees, where the thaw depth was up to 200 m (Beck et al., 2015). This is due to the absence of any insulation during the winter (i.e., no insulating cover of either vegetation or snow), resulting in lower ground temperatures (e.g., Beck et al., 2015; Clebsch and Shanks, 1968; Mackay, 1974; Ro-manovsky and Osterkamp, 1995; Nelson et al., 1997). It can therefore be assumed that subsidence at these points starts much later than elsewhere. The relationships between the different vegetation types and the changes in elevation are shown in Fig. 5.
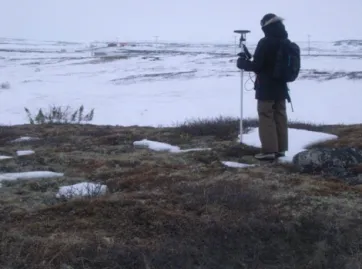
Both the vegetation and the snow cover influence the ther-mal regime of the ground. However, since frost mounds are exposed features in the landscape, any snow cover is usu-ally quickly removed by the wind and they are commonly almost frost free (Fig. 6). The influence of snow cover on the mounds has therefore not been included in this study.
4.2 Remote sensing – differential interferometry synthetic aperture radar (D-InSAR)
Results
Out of the 11 TerraSAR-X acquisitions in 2009 and 2010, only 6 interferograms showed a reasonable coherence with coherence values greater than about 0.25 computed over the whole area of interest (i.e., 0.25 for the 7 May/14 Au-gust 2009 image pair, 0.40 for the 14/30 AuAu-gust 2009 pair, 0.29 for the 14 August/30 October 2009 pair, 0.27 for the 5 May/12 August 2010 pair, 0.53 for the 12/28 August 2010 pair, and 0.28 for the 12 August/28 October 2010 pair). All other interferograms were much less correlated. Areas covered by water bodies, vegetated areas, and pixels lo-cated within shadows are particularly affected by decorrela-tion with coherence values below 0.3, while built-up areas are by far the most coherent class, with coherence values greater than 0.9. However, although the average coherence value from the six interferograms is high enough for general-ized further analysis (Carballo and Fieguth, 2002; Hanssen, 2001), the coherence values over the three lithalsas (Table 4) is too low to be considered adequate for further analysis. In this case, if phase unwrapping is performed without using a coherence threshold it will yield phase values approach-ing zero, which would be typical of noisy regions. However, these values show no correlation with the large displacements measured using d-GPS technology and have therefore not been subjected to any further analysis.
Discussion
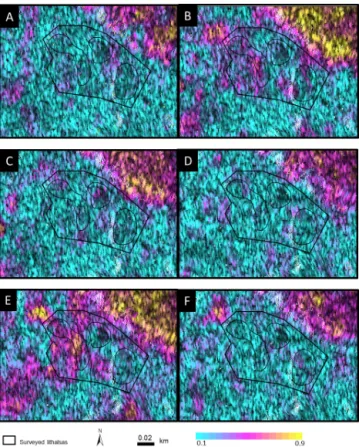
Decorrelation in the TerraSAR-X differential interferograms over the lithalsas (Fig. 7) is not surprising considering the large, rapid, vertical movements (several decimeters in less than half a year) measured using d-GPS technology (Ze-bker and Villasenor, 1992). There are also large variations in
Table 4.Average coherence over the three lithalsas for the six interferograms.
2009 2010
14 Aug–7 May 14–25 Aug 14 Aug–30 Oct 12 Aug–5 May 12–23 Aug 12 Aug–28 Oct
Lithalsa R 0.17 0.18 0.24 0.10 0.20 0.22
Lithalsa M 0.14 0.20 0.14 0.13 0.19 0.15
Lithalsa I 0.12 0.34 0.15 0.13 0.46 0.10
Figure 5.Box plots of surface cover and elevation changes for the three lithalsas, measured between August 2009 and March 2010, between May 2010 and August 2010, and between August 2010 and April 2011, based on all 39 measurement points on the three lithalsas.
Figure 6.Photo taken in April 2010 showing sparse snow cover on the lithalsas (Lithalsa M in this case) during the field visits.
movement within each of the lithalsas. Amplitudes of sev-eral decimeters in lithalsa movements were recorded over less than half a year, with variations of several centime-ters between individual measurement points within each of the lithalsas (which are only about 40 m in diameter); these amplitudes far exceed the range that can be quantified with TerraSAR-X data, where a phase cycle corresponds to 1.6 cm and the time interval between acquisitions is, at best, 11 days. Decorrelation due to large displacements resulting
Figure 7. The six interferograms (A: 14 August–7 May 2009; B: 14–25 August 2009; C: 14 August–30 October 2009; D: 12 August–5 May 2010; E: 12–23 August 2010; and F: 12 August–28 October 2010). Left: broad area around Umiu-jaq, northern Quebec, Canada. The dashed arrow to the north of Umiujaq indicates the fringes of slow movements; the dotted circle indicates the area of signals to the east of the lithalsas. Right: area covering the three lithalsas of interest; the amount of movement ex-ceeds the amount that can be quantified with TerraSAR-X data.
from freeze-up processes has also been identified by Short et al. (2011), who investigated the co-registration of TerraSAR-X and RADARSAT-2 data from Herschel Island, acquired in May, October and November. The possibility of tempo-ral decorrelation associated with the land cover type can be discounted because the lithalsas have only very sparse vege-tation cover or none at all, as is also the case in surrounding areas that are characterized by much higher coherence values
Figure 7.Continued.
(Fig. 8). Changes in the dielectric properties (soil and vegeta-tion moisture) can also influence both the coherence and the phase (Barrett et al., 2012). However, investigations in Cana-dian permafrost regions (Pangnirtung and Iqaluit) by Short et al. (2014) examined the influence of soil moisture and found that it was unlikely to be a significant source of error. Nev-ertheless the six differential interferograms of this study re-veal two interesting large-scale signals. Firstly, to the north of Umiujaq (56◦33.60N, 76◦32.940E) fringes increase with time and may be an indication of localized slow movements in a rocky area with only sparse vegetation (such as lichens and mosses). A corner reflector was fixed on solid rock in this area by INRS (Institut National de la Recherche Scien-tifique) for a RADARSAT-2 study, oriented for a descending orbit. The signal in the TerraSAR-X interferograms could be related to localized movement of the corner reflector, to the displacement of terrain relative to the corner reflector, or to thermal dilation associated with the structure on which the corner reflector is located. It is not possible to make any further interpretations concerning the cause of the detected movement without additional local information. Secondly, to the west of the lithalsas (around 56◦33.180N, 76◦30.960E),
Figure 8.The coherence values of the six interferograms in the area of the three lithalsas of interest, near Umiujaq, northern Que-bec, Canada (A: 14 August–7 May 2009; B: 14–25 August 2009; C: 14 August–30 October 2009; D: 12 August–5 May 2010; E: 12– 23 August 2010; and F: 12 August–28 October 2010).
widespread slow movements can be identified over the 11 day period from 14 to 23 August 2009. This area is part of the cuestas (solid rock), but land cover classifications based on an IKONOS image (2005) and a GeoEye image (2009) show vegetated patches with prostrate shrubs (May 2011), interspersed with temporary pools of water. Following, the signals from the differential interferogram are therefore very likely to be associated with temporary ponding. This inter-pretation is supported by the precipitation records: 63 % of the total precipitation for August (total: 64.4 mm) fell be-tween the two acquisition dates (i.e., bebe-tween 14 and 30 Au-gust 2009), whereas it was very dry (only 5.8 mm precipita-tion) over the 7 days prior to the first acquisition.
5 Conclusion
D-GPS measurements have confirmed the expected vertical movements of lithalsas relatively to the surrounding unfrozen ground. The average uplifts during the two freezing peri-ods (winter 2010 and winter 2011) measured using the d-GPS technology were 0.4 and 0.1 m. The average measured subsidence during the thawing period (summer 2010) was 0.5 m. The results indicate different patterns of behavior for
each of the three lithalsas, reflecting their degradation status: maximal movements were recorded for the least degraded lithalsa (21 % above the average) and minimal movements were recorded for the most degraded lithalsa (40 % below the average). With regard to the vegetation cover, patches with prostrate shrubs cover experienced greater uplift and subsi-dence than those with little or no vegetation. The amount of movement indicates that permafrost features in this re-gion are currently undergoing active degradation. Further-more, the results and interpretations from our research us-ing d-GPS technology in subarctic permafrost regions will have important implications for planning the use of D-InSAR in such regions, and for interpreting the results obtained. Since in situ subsidence data from such environments are very rare, D-InSAR analysis is often performed with no a pri-ori knowledge. However, these movements could not be de-tected with D-InSAR due to decorrelation. Large displace-ments have been shown to be possible, which makes the application of D-InSAR in such regions very challenging. This became evident as a result of capturing the dynamics of lithalsas in the differential interferograms based on the X-band data from TerraSAR-X. This investigation revealed the limitations of D-InSAR, since the range of movements (sev-eral centimeters) could not be represented in the D-InSAR products. However, slow movements could be identified in the general vicinity, to the north of Umiujaq and east of the lithalsas. These findings are of considerable importance as they confirm the viability of using D-InSAR based on X-band to detect vertical dynamics in subarctic regions.
Author contributions. I. Beck was responsible for the design of the experiments, the field work, and the generation of the D-InSAR products, as well as for the analysis and interpretation of the results. R. Ludwig and M. Bernier supervised her work and provided assis-tance during the investigations. S. Tazio supported the preparation of the D-InSAR products and the analysis. J. Boike was responsi-ble for the interpretation of the permafrost processes. All co-authors supported I. Beck in the preparation of the manuscript.
Acknowledgements. The authors gratefully acknowledge the financial support received from ArcticNET, the DFG (Deutsche Forschungsgemeinschaft), the CEN (Centre d’études nordiques), and the European Union FP7-ENV project PAGE21 under contract number GA282700. The work was also partly funded by the German Aerospace Center (DLR) and the Federal Ministry for Economic Affairs and Energy (BMWi) in the framework of the project PermaSAR (FKZ 50EE1418). We are also grateful to the DLR-HR for providing the remote sensing data, to GAMMA Remote Sensing AG for their technical support, and to Yannick Duguay (PhD at CEN) for assistance with d-GPS data acquisition. Edited by: D. L. Egholm
References
Allard, M. and Séguin, M. K.: Le pergélisol au Québec nordique: bilan et perspectives, Geogr. Phys. Quatern., 41, 141–152, 1987. Allard, M., Fortier, R., Sarrazin, D., Calmels, F., Fortier, D., Chau-mont, D., Savard, J. P., and Tarussov, A.: L’impact du réchauffe-ment climatique sur les aéroports du Nunavik: caractéristiques du pergélisol et caratérisation des processus de dégradation des pistes, Sommaire Project A803, University Laval, Ouranos, Canada, 2007.
Amelung, F., Jónsson, S., Zebker, N., and Segall, P.: Widespread uplift and “trapdoor” faulting on Galápagos volcanoes observed with radar interferometry, Nature, 407, 993–996, 2000. ASI (Italian Space Agency): SkyMed Mission,
COSMO-SkyMed System Description & User Guide, Rome, Italy, 2007. Bamler, R. and Hartl, P.: Synthetic aperture radar interferometry,
Inverse Probl., 14, R1–R54, 1998.
Barrett, B., Whelan, P., and Dwyer, E.: The use of C- and L-band repeat-pass interferometric SAR coherence for soil mois-ture change detection in vegetated areas, Open Remote Sens. J., 5, 37–53, 2012.
Beck, I., Ludwig, R., Bernier, M., Lévesque, E., and Boike, J.: As-sessing permafrost degradation and land cover changes (1986– 2009) using remote sensing data, Umiujaq, sub-Arctic Quebec, Permafrost Periglac., 26, 129–141, doi:10.1002/ppp.1839, 2015. Berber, M., Ustun, A., and Yetkin, M.: Comparison of accuracy of
GPS techniques, Measurement, 45, 1742–1746, 2012.
Bisnath, S. and Gao, Y.: Current State of Precise Point Positioning and Future Prospects and Limitations, in: International Associa-tion of Geodesy Symposia, Buenos Aires, Argentina, 13 August– 4 September 2009, 133, 615–623, 2009.
CAF – Cluster Applied Remote Sensing: TerraSAR-X. Ground Seg-ment, Basic Product Specification DocuSeg-ment, Oberpfaffenhofen, Germany, 2009.
Calmels, F.: Genèse et structure du Pergélisol. Etude de forms péeriglaciaires de soulèvement au gel au Nunavik (Québec nordique), PhD thesis, Department of Geography, Université Laval, Quebec, Canada, 169 pp., 2008.
Calmels, F., Allard, M., and Delisle, G.: Development and decay of a lithalsa in Northern Québec: a geomorphological history, Geomorphology, 97, 287–299, 2008.
Carballo, G. F. and Fieguth. P. W.: Member hierarchical network flow phase unwrapping, IEEE Geosci. Remote S., 40, 1695– 1708, 2002.
CEN: Environmental data from the Umijuaq region in Nunavik, Quebec, Canada, v. 1.1 (1997–2013), Nordicana, D9, doi:10.5885/45120SL-067305A53E914AF0, 2013.
Clebsch, E. E. C. and Shanks, R. E.: Summer climatic gradients and vegetation near Barrow, Alaska, Arctic, 21, 161–171, 1968. Constantini, M. and Rosen, P. A.: A generalized phase unwrapping
approach for sparce data, in: Proceedings IGARSS, Hamburg, Germany, 28 June–2 July 1999, 267–269, 1999.
DLR: available at: http://www.dlr.de/eo/desktopdefault.aspx/ tabid-5725/9296_read-15979/ (last access: 20 January 2015), 2010.
Doyon, J. R., Allard, M., and L’Hérault E.: Umiujaq, Dépôts de surface, aéroport Umiujaq, Nunavik, Centre d’études nordiques, Université Laval, Québec, Canada, 2010.
Environment Canada: Canadian Climate Normals, 1971–2000. En-vironment Canada, Atmospheric EnEn-vironment Service, Ottawa, Ontario, Canada, 2004.
Fortier, R. and Aubé-Maurice, B.: Fast Permafrost Degradation near Umiujaq in Nunavik (Canada) Since 1957 assessed from Time-Lapse Aerial and Satellite Photographs, in: Proceedings of the Ninth International Conference on Permafrost, University of Fairbanks: Fairbanks, Alaska, 29 June–3 July 2008, 1, 457–462, 2008.
Gagnon, R. M. and Ferland, M.: Climat du Québec septentrional, Québec, Service de la météorologie, Ministère des richesses na-turelles, Québec, Canada, 107, 1967.
GAMMA Remote Sensing AG: Differential Interferometry and Geocoding Software – DIFF&GEO, Vers.1.2., Gümligen, 2008. Ge, L., Zhan, K., Ng, A., Dong, Y., Hsing-Chung, C., and
Ri-zos, C.: Preliminary results of satellite radar differential inter-ferometry for the co-seismic deformation of the 12 May 2008 Ms8.0 Wenchuan Earthquake, Lect. Notes Comput. Sc., 14, 12– 19, 2008.
Goldstein, R. M., Engelhard, R., Kamb, B., and Frohlich, R.: Satel-lite radar interferometry for monitoring ice sheet motion: ap-plication to an Antarctic ice stream, Science, 262, 1525–1530, 1993.
Gurney, S. D.: Aspects of the genesis, geomorphology and terminol-ogy of palsas: perennial cryogenic mounds, Prog. Phys. Geog., 29, 139–155, 2001.
Hanssen, R. F.: Radar Interferometry. Data Interpolation and Error Analysis, Kluwer Academic Pub., New York, 2001.
Hofmann-Wellenhof, B., Lichtenegger, H., and Wasle, E.: GNSS – Global Navigation Satellite Systems, Springer, Wien, Austria, New York, USA, 2008.
Kaufmann, V.: Deformation analysis of the Doesen rock glacier (Austria), in: Proceedings 7th International Conference on Per-mafrost, edited by: Lewkowicz, A. G., Allard, M., Centre d’études Nordiques, Universite Laval, Quebec, Nordicana, 57, 23–27 June 1998, 551–556, 1998.
Kranck, E. H.: On the geology of the east coast of Hudson Bay and James Bay, observations during a research journay in summer 1947, Acta Geogr., 11, 1–71, 1951.
Laberge, M. J. and Payette, S.: Long-term monitoring of permafrost changes in a palsa peatland in Northen Quebec, Canada: 1983– 1993, Arctic Alpine Res., 27, 167–171, 1995.
Lajeunesse, P. and Allard, M. The Nastapoka drift belt, eastern Hud-son Bay: implications of a stillstand of the Quebec-Labrador ice margin in the Tyrrel Sae at 8 ka BP, Can. J. Earth Sci., 40, 65–76, 2003.
Larsen, Y., Lauknes, T. R., and Christiansen, H. H.: Seasonal Periglacial Activity in Permafrost Landscapes Measured with High-Resolution InSAR Time Series: 4. TerraSAR- X Sci-ence Team Meeting, 14–16 February, 2011, Oberpfaffenhofen, Deutschland, 2011.
Larsen, Y., Lauknes, T. R., Malnes, E., and Christiansen, H. H.: High-resolution InSAR analysis of Radarsat-2 Ultra-Fine mode and TerraSAR-X data for measuring fine-scale landscape changes due to permafrost activity, 6th International Workshop on SAR Interferometry: Advances in the Science and Applica-tions of SAR Interferometry (FRINGE 2009), ESA ESRIN, Fras-cati, Italy, 30 November–4 December, 2009.
Lauknes, T. R., Larsen, Y., Malnes, E., and Christiansen, H. H.: Permafrost monitoring using SAR and ground based techniques in Svalbard, Third European Conference on Permafrost (EUCOP III), Longyearbyen, Svalbard, Norway, 13–17 June 2010, 2010a. Lauknes, T. R., Larsen, Y., Malnes, E., and Christiansen, H. H.: Monitoring of periglacial landform changes in permafrost land-scape using radar satellite time series, ESA Living Planet Sym-posium 2010, Bergen, Norway, 28 June–2 July 2010, 2010b. Little, J. D.: Frost heave and thaw settlement in Tundra
Environ-ments: Applications of Differential Global Positioning System Technology, PhD thesis, Faculty of the University of Delaware, Newark, USA, 160 pp., 2006.
Little, J. D., Sandall, H., Walegur, M. T., and Nelson, F. E.: Appli-cation of differential global positioning systems to monitor frost heave and thaw settlement in tundra environments, Permafrost Periglac., 14, 349–357, 2003.
Liu, L., Zhang, T., and Wahr, J.: InSAR measurements of surface deformation over permafrost on the North Slope of Alaska, J. Geophys. Res., 115, F03023, doi:10.1029/2009JF001547, 2010. Liu, L., Zhang, T., Shaefer, K., and Wahr, J.: InSAR Observa-tions Revealed Surface Subsidence over permafrost in North-ern Alaska, Alaska Satellite Facility, News and Notes, Fairbanks, Alaska, USA, 7, 2011.
Mackay, J. R.: Seismic shot holes and ground temperatures, Mackenzie Delta area, Northwest Territories, Geological Survey of Canada Paper, Ottawa, Canada, Part A, 74, 389–390, 1974. May, I.: Using in-field and remote sensing data to monitor
per-mafrost dynamics in Northern Québec, PhD thesis, Ludwig-Maximilians University of Munich, Germany, 181 pp., 2011. Nelson, F., Shiklomanov, N. I., Mueller, G. R., Hinkel, K. M.,
Walker, D. A., and Bockheim, J. G.: Estimating active-layer thickness over a large region: Kuparik River basin, Alaska, USA, Arctic Alpine Res., 29, 367–378, 1997.
Nelson, F., Anisimov, O., and Shiklomanov, N.: Subsidence risk from thawing permafrost, Nature, 410, 889–890, 2001.
Nelson, F. E., Brigham, L., Hinkel, K. M., Romanovsky, V. E., Smith, O., Tucker, W., and Vinson, T.: Climate Change, Per-mafrost and Impacts on Civil Infrastructure, Special Report 01-03, Permafrost Task Force, US Arctic Research Commission, Ar-lington, VA, 72 pp., 2003.
Phillips, D. W.: Climatic Atlas Canada: a Series of Maps Portraying Canada’s Climate, Gouvernement du Canada, Ottawa, Canada, 1984.
Pissart, A.: Remnants of lithalsas of the Hautes Fagnes, Belgium: a summary of present-day knowledge, Permafrost Periglac., 11, 327–355, 2000.
Pissart, A.: Palsas, lithalsas and remnants of these periglacial mound. A progress report, Prog. Phys. Geog., 26, 605–621, 2002. Romanovsky, V. E. and Osterkamp, T. E.: Interannual variations of thermal regime of active layer and near-surface permafrost in northern Alaska, Permafrost Periglac., 6, 313–335, 1995. Rowland, J. C., Jones, C. E., Altmann, G., Bryan, R.,
Crosby, B. T., Geernaert, G. L., Hinzmann, L. D., Kane, D. L., Lawrence, D. M., Mancino, A., Marsh, P., McNamara, J. P., Ro-manovsky, V. E., Toniolo, H., Travis, B. J., Trochim, E., and Wil-son, C. J.: Arctic Landscapes in Transition: responses to Thawing Permafrost, Eos T. Am. Geophys. Un., 91, 229–236, 2010.
Seppälä, M.: Palsas and related forms, in: Advances in Periglacial Geomorphology, edited by: Clark, M. J., Wiley, Chichester, Chapter 11, 247–278, 1988.
Shiklomanov, N. I., Streletskiy, D. A., Little, J. D., and Nel-son, F. E.: Isotropic thaw subsidence in undisturbed permafrost landscapes, Geophys. Res. Lett., 40, 6356–6361, 2013. Short, N., Brisco, B., Couture, N., Pollard, W., Murnaghan, K., and
Budkewitsch., P.: A comparison of TerraSAR-X, RADARSAT-2 and ALOS-PALSAR interferometry for monitoring permafrost environments, case study from Herschel Island, Canada, Remote Sens. Environ., 15, 3491–3506, 2011.
Short, N., LeBlanc, A.-M, Sladen, W., Oldenborger, G., Mathon-Dufour, V., and Brisco, B.: RADARSAT-2 D-InSAR for ground displacement in permafrost terrain, validation from Iqaluit Air-port, Baffin Island, Canada, Remote Sens. Environ., 141, 40–51, 2014.
Skaven-Haug, S.: Protection against frost heaving on Norwegian railways, Geotechnique, 9, 87–106, 1959.
Smith, S. L., Mac Donald, G. M., Velichko, A. A., Beilman, D. W., Borisova, O. K., Frey, K. E., Kremenetski, K. V., and Shengl, Y.: Siberian peatlands a net carbon sink and global methane source since the early holocene, Science, 303, 353–356, 2004. Smith, S. L., Romanosky, V. E., Lewkowicz, A. G., Bum, C. R.,
Allard, M., Clow, G. D., Yosikawa, K., and Throop, J.: Thermal state of permafrost in North America: a contribution to the inter-national polar year, Permafrost Periglac., 21, 117–135, 2010. Spannraft, K.: Using X-band Differential SAR Interferometry to
monitor seasonal surface deformation in a permafrost landscape in Nunavik, Québec, Diploma thesis, Ludwig-Maximilians Uni-versity Munich, Germany, 149 pp., 2010.
Strozzi, T., Grosse, G., and Streletskij, D.: SAR Interferometry for surface deformation monitoring in Permafrost Areas in Alaska, Proc. Earth Observation and Cryosphere Science Conf., Frascati, Italy, 13–16 November 2012, 2012.
Sushama, L., Laprise, R., and Allard, M.: Modeled current and fu-ture soil thermal regime for northeast Canada, J. Geophys. Res., 111, D18111, doi:10.1029/2005JD007027, 2006.
Tait, M. and Moorman, B.: A Feasibility Study into monitoring deformation in the Niglintgak regions of the Mackenzie Delta, in: Proceedings, 11th FIG Symposium on Deformation Measure-ments, Santorini, Greece, 25–28 May, 2003, E8, 2003.
Tait, M., Sheng, L., and Cannon, E.: The feasibility of replacing precise levelling with GPS for permafrost deformation monitor-ing, in: Proceedings of the FIG 3rd International Conference on Engineering Surveying, Bratislava, Slovakia, 1 November, 2004. Tait, M., Moorman, B., and Sheng, L.: The long-term stability of survey monuments in permafrost, Eng. Geol., 79, 61–79, 2005. Theakstone, W. H., Jacobsen, F. M., and Knudsen, N. T.: Changes
of snow cover thickness measured by conventional mass balance methods and by Global Positioning System surveying, Geogr. Ann. A, 81, 767–77, 1999.
Wegmüller, U. and Werner, C.: Land applications using ERS-1/2 tandem data. Proc. of the Fringe 96 Workshop: ERS SAR Inter-ferometry, Zurich, Switzerland, 30 September–2 October 1996, ESA SP-406, 97–112, 1996.
Wirz, V., Geertsema, M., Gruber, S., and Purves R.S.: Temporal variability of diverse mountain permafrost slope movements de-rived from multi-year daily GPS data, Mattertal, Switzerland. Landslides, 1-17, doi:10.1007/s10346-014-0544-3, 2015. Yen, J.-Y., Chen, K.-S. Chang, C.-P., and Boerner, W.-M.:
Evalua-tion of earthquake potential and surface deformaEvalua-tion by differen-tial interferometry, Remote Sens. Environ., 112, 782–795, 2008. Zebker, H. A. and Villasenor, J.: Decorrelation in interferometric radar echoes, IEEE Trans. Geo. Rem. Sensing, 30, 950–959, 1992.
Zoltai, S. C. and Tarnocai, C.: Perennially frozen peatlands in the western Arctic and Subarctic of Canada, Can. J. Earth Sci., 12, 28–43, 1975.
Zuidhoff, F. S.: Recent decay of a single palsa in relation to weather conditions between 1996 and 2000 in Laivadalen, northern Swe-den, Geogr. Ann. A, 84, 103–111, 2002.
Zuidhoff, F. S. and Kolstrup, E.: Palsa development and associated vegetation in northern Sweden, Arct. Antarct. Alp. Res., 37, 49– 60, 2005.