OATAO is an open access repository that collects the work of Toulouse
researchers and makes it freely available over the web where possible
Any correspondence concerning this service should be sent
to the repository administrator:
[email protected]
This is an author’s version published in:
http://oatao.univ-toulouse.fr/25110
To cite this version:
Soroceanu, Ion and Graur, Adrian and Coca, Eugen and Salmon, Lionel
and
Molnár, Gábor
and Demont, Philippe
and Bousseksou, Azzedine
and
Rotaru, Aurelian Broad-Band Dielectric Spectroscopy Reveals Peak Values of
Conductivity and Permittivity Switching upon Spin Crossover. (2019) The
Journal of Physical Chemistry Letters. 7391-7396. ISSN 1948-7185
Broad-Band Dielectric Spectroscopy Reveals Peak Values of
Conductivity and Permittivity Switching upon Spin Crossover
Ion Soroceanu/
Adrian Graur/
Eugen Coca/
Lionel
Salmon/CE>
Gabor
Molnar,*C9
Philippe Demont,§
Azzedine Bousseksou,
*'*
and Aurelian Rotaru
*'
t
C9
tFaculty of Electrical Engineering and Computer Science and MANSiD Research Center, Stefan ce! Mare University, 13, Strada Universitatii, Suceava n0229, Romania
*LCC, CNRS and Université de Toulouse, F 31077 Toulouse, France §CIRIMAT, CNRS and Université de Toulouse, F 31068 Toulouse, France
•Supporting Information
ABSTRACT: We use broad band dielectric spectroscopy to investigate the spin state dependence of electrical properties of the [Fe(Htrz)i{trz)](BF4) spin crossover complex.
We show that the Havriliak-Negami theory can fully describe the variation of the complex dielectric permittivity of the material across the pressme-temperature phase diagram. The analysis reveals three dielectric relaxation processes, which we attribute to
electrode/interface polarization, dipole relaxation, and charge transport relaxation. The
contribution of the latter appears significant to the dielectric strength. Remarkably, the permittivity and conductivity changes between the high spin an<l low spin states are amplified at the corresponding relaxation frequencies.
T
he phenomenon of spin crossover ( SCO) is one of the most interesting molecular properties on the road to molecular electronics and spintronics. 1-5 lndeed, the reversibletransition between the high spin (HS) and low spin (LS) states is accompanied by important changes in different material properties, including dielectric and charge transport properties, opening a window to new potential technological applica tions.6-8 ln the past 15 years, considerable efforts have been
made to investigate the electrical properties of SCO systems as
well as to exploit them in proof of concept devices rane§ 2 from single molecules to large area multilayer junctions. -Yet, an important issue remains to enhance the HS/LS switching ratios of relevant device properties ( resistance, capacitance, etc.), which remain relatively small in the different devices and materials investigated ( with the exception of single molecule junctions).
ln this Letter, we investigate the complex dielectric permittivity of the benchmark [Fe(Htrz)z{trz)](BF4) SCO complex (trz = triazolato), 1, as a function of temperature (300-440 K) and pressure (1-3000 bar) in a broad frequency range between 10-1 and 1ü6 Hz. Both DC and AC electrical properties of this complex have been intensively studied in the last years by several research groups in order to understand the charge transport properties of molecular SCO materials with the aim to (potentially) use these compounds in resistance and/or capacitance switching devices.13,16,11,19,21 ,29-35 How
ever, we lacked the understanding of the physical mechanisms underlying the reported behaviors. In particular, the open
Charg@transport relaxation
. 10'00 2000 30TOO
Pressure (bar)
questions that need to be clarified are (i) which spin state is characterized by a higher dielectric permittivity and which dielectric relaxation processes contribute to the value of the dielectric constant and (ii) in which frequency range of the applied field must these materials be analyzed in order to reach the highest permittivity/conductivity switching ratio. In the present work, the deconvolution of the dielectric spectra allowed us to distinguish and identify the different dielectric relaxation processes in the material and to extract the associated dielectric strengths and relaxation times. We show that the HS/LS switching ratios of the electrical conductivity and permittivity are maximized near the relevant dielectric relaxation frequencies (J,), which we ascribe to the spin state dependence of the relaxation times and their distributions.
ln molecular SCO systems, such as in other low mobility solids, the charge transport takes place due to hopping conduction between localized sites.36 The hopping motion of a charge involves an electrical relaxation because the electronic charge is surrounded by positive counter charges. A hop of a charge carrier to a new site can lead to successful charge transport only if the polarization cloud follows. Otherwise, the charge carrier will jump back with a high probability.37 This mutual movement of the charge carrier and the surrounding polarization cloud requires an electrical relaxation time -.,,. If
the frequency of the outer electricalfield is higher than 1/τσ, its effect on the charge transport averages out. For frequencies lower than 1/τσ, the relaxation of the polarization cloud is in
phase with the outer electrical field. For that case, the field supports the propagation of the charges. Hence, this electrical relaxation gives rise to a contribution in the complex dielectric function, which increases with decreasing frequency. Besides the charge transfer relaxation, dipole relaxation process(es) may also occur due to the molecular polarization. Finally, one has to expect electrode/interface polarization effects in the low frequency range.
Dielectric relaxation processes are usually analyzed using model functions. Starting from the theoretically well founded Debye function,38 several formulas (both for frequency and time domains) have been suggested to describe the experimental spectra. Relaxation processes are characterized by a peak in the imaginary part,ε″, and a step like decrease of the real part, ε′, of the complex dielectric permittivity. An alternative representation of the relaxation process is the Cole−Cole plot (i.e., ε″ vs ε′ plot), which leads to a semicircle for an ideal Debye relaxation, which takes place with a single relaxation time (seeFigure S1in the Supporting Information, SI).39However, in complex systems such as SCO materials, the Cole−Cole diagram may have an intricate shape, indicating the superposition of several relaxation processes (seeFigure S2in the SI). In order to overcome the limitations of the Debye model, we used the phenomenological Havriliak−Negami
(HN) theory40tofit the experimental data recoded on 1. The HN equation is a combination of the Cole−Cole and the Cole−Davidson41 functions describing the symmetrical and asymmetrical broadening of the dielectric function, respectively (see the SI). The HN equation for the effective complex p e r m i t t i v i t y ε*( )ω = ′ε ω( ) −i ( )ε ω″ =
/(1 (i HN) )
ε∞+ Δε + ωτ β γ is the most frequently used function for the description of the dielectric properties of materials and their relaxation behavior in the frequency domain.37 The real and imaginary parts of the dielectric permittivity are expressed as
cos( ) 1 2( ) cos( /2) ( )2 /2 ε′ =ε∞+ Δε γθ [ + ωτ β βπ + ωτ β]−γ (1) sin( ) 1 2( ) cos( /2) ( )2 /2 ε″ = Δε γθ[ + ωτ β βπ + ωτ β]−γ (2) where arctan sin( /2) ( ) cos( /2) θ βπ ωτ βπ = + β − Ä Ç ÅÅÅÅÅ ÅÅÅÅÅ É Ö ÑÑÑÑÑ ÑÑÑÑÑ (3)
ε′ and ε″ are the real and imaginary parts of the dielectric permittivity,Δε = εs − ε∞is the dielectric strength,ε∞is the relative permittivity at infinite frequency, εsis the static relative
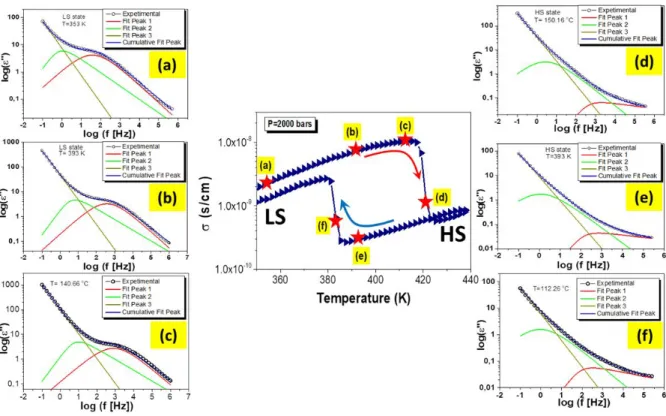
permittivity at zero frequency,τ is the relaxation time, ω is the angular frequency, whileβ and γ are the shape parameters (0 < β ≤ 1 and 0 < β·γ ≤ 1), which describe the symmetric and Figure 1.Temperature and pressure dependence of the ac conductivity, recorded at 2000 bar (a) and 403 K (b), respectively. Selected spectra ofε″ andε′ (T = 393 K, P = 2000 bar) recorded in the thermal hysteresis loop in the LS (A) and HS (B) states (c−f). The lines are fits using the HN equations.
asymmetric broadening, respectively, of the complex dielectric permittivity. Shape parameters show the change in the relaxation time distribution. The HN model can be used to predict the dielectric permittivity or modulus that depends on the temperature by introducing the Arrhenius type relation ship, for example. In our Letter, we show that not only the temperature but also the pressure dependent dielectric behavior can be rationalized in a consistent picture using the same HN model parameters.
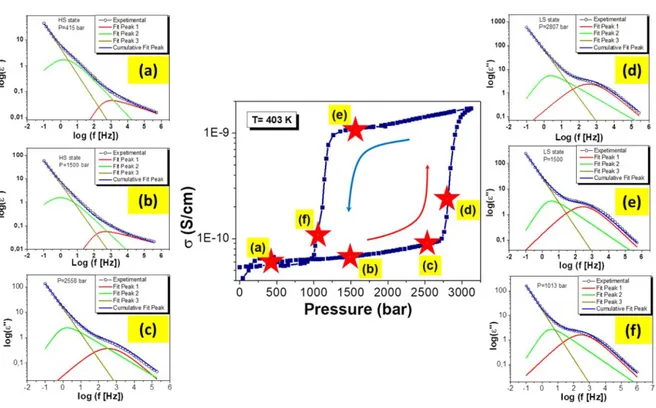
The complex dielectric permittivity of a polycrystalline sample of 1 was measured using a dielectric analyzer Alpha A combined with the impedance interface ZG4 (Novocontrol Technologies GmbH & Co. KG, Germany) in a four wire arrangement in the frequency range from 0.1 Hz to 1 MHz as a function of temperature and pressure. Further details on the sample and the measurements are described in ref29. Figure 1a,b shows the temperature and pressure dependence of the real part of the ac conductivity (ω = 100 Hz) recorded at 2000 bar and 403 K, respectively. (For other frequencies, seeFigures S3 and S4in the SI.) Temperature favors the HS phase, which has higher entropy, while the applied pressure favors the LS phase, which has a lower volume. In agreement with previous reports, an abrupt drop of the conductivity accompanies the transition from the LS to the HS phase. Because the spin transition occurs with wide thermal and pressure hysteresis loops, it is possible to compare the dielectric spectra of the HS and LS forms for strictly the same experimental conditions (points A and B in the thermal hysteresis curve and points C and D in the pressure hysteresis curve), discarding any possible temperature or pressure effect on ε*. The frequency dependence of log(ε″) and ε′ at points A and B are shown in Figure 1c−f. (Very similar results and conclusions were obtained for the pressure hysteresis loop (points C and D), which are therefore shown only inFigures S5−S7in the SI.)
Because the imaginary part of the permittivity shows discernible relaxation peaks when it is recorded as a function of frequency, it is easier to carry out least squaresfitting of the ε″(ω) spectra in a first test (eq 2). The HN parameters resulting from thisfit are then used to fit the ε′(ω) spectra in a second test (eq 1). The fact that the same parameter set allowed us a fully consistent description of both spectra provided clear proof of the validity of the HN equation for this sample. The deconvolution of the dielectric spectra allowed us to separate the contributions of three relaxation processes, which can be tentatively ascribed to the charge transport relaxation (peak 1 near 1 kHz), a dipole relaxation process (peak 2 near 10 Hz), and the electrode polarization (low frequency dispersion).
To confirm the origin of these relaxation processes, we traced the frequency dependence of the εLS/εHS and σLS/σHS
ratios (seeFigure 2), whereεLSandεHS(respectivelyσLSand
σHS) are the real parts of the dielectric permittivity
(respectively conductivity) recorded at the same temperature and pressure in the LS and HS states, respectively. Remarkably, a maximum in the frequency dependence of theεLS/εHSratio is
located at a frequency of about 10 Hz, i.e., around the same frequency at which we found the peak associated with the dipole relaxation. Similarly, the position of the peak in the frequency dependence of theσLS/σHSratio is located between 103and 104 Hz, i.e., in the same frequency range where the relaxation attributed to the charge transport process occurs.
At low frequencies, the electrode polarization due to charge accumulation at the interfaces between the material and
electrodes adds to the dielectric relaxation.37This contribution is not a material property and could be different from one measurement to other.
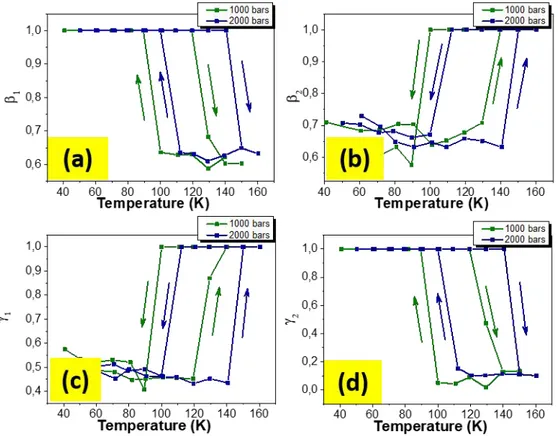
The material dependent HN model parameters resulting from thefitted data (variable pressure) are shown inFigure 3. (Similar parameters and behaviors have been extracted from the data recorded at variable temperatures; seeFigures S8 and S9 in the SI.) For convenience, parameters corresponding to the dipolar relaxation are denoted with index 1, and those related to the charge transport relaxation are denoted with index 2. For both types of relaxation processes, the relaxation time increases in the HS state with respect to the LS state (Figure 3a,b), in good agreement with our previous studies using the electric modulus formalism.35 We attribute the increased conductivity relaxation frequency in the LS state to its higher stiffness (i.e., higher phonon frequencies), which results in higher hopping rates. On the other hand, the lower dipole relaxation frequency in the LS state is indicative of a more viscous HS phase. We stress here the important contribution of the charge transport relaxation to the effective dielectric permittivity of the material. Indeed, as it can be seen fromFigure 3c,d, both relaxation processes (i.e., dielectric and charge transport relaxation) are characterized by dielectric strengths of the same order of magnitude. This might explain why in some molecular complexes the dielectric permittivity is higher in the LS state while in other complexes the HS state shows a higher permittivity.9 It is noteworthy that all of the fitting parameters show a hysteretic behavior associated with the spin transition phenomenon, in perfect agreement with the experimental data. From the shape parameters analysis (i.e., parametersβ and γ), we can extract relevant information about the distribution of relaxation times. Interestingly, the dipole relaxation is characterized by a symmetric relaxation time distribution in the HS state and an asymmetric distribution in the LS state, the relaxation process(es) being shifted to higher frequencies. On the contrary, the charge transport relaxation process is characterized by an asymmetric relaxation time distribution in the HS state, which becomes symmetric in the LS state.
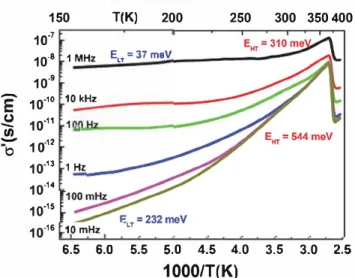
A recent report using time resolved microwave conductivity has pointed out that the conductivity of 1 below ca. 220 K strongly departs from the high temperature thermally activated behavior and becomes basically activationless, which the authors attributed to the existence of shallow traps.30 We have thus extended our dielectric spectroscopic study also to the low temperature range (i.e., far from the spin transition) in order to examine this phenomenon. As shown inFigure 4(see alsoFigure S10), we can clearly observe in our data the same Figure 2.Frequency dependence ofεLS/εHSandσLS/σHSratios (T = 403 K, P = 2000 bar).
change of charge transport mechanism from thermally activated toward activationless conduction. While this effect is indeed very pronounced at high frequencies (MHz), it can be readily depicted in the whole frequency range down to very low frequencies (10 mHz).
In fact, this low temperature phenomenon has nothing to do with shallow traps. Instead, it is a genuine feature of charge transport by small polaron hopping, which has been system atically observed in various materials (SCO, Prussian blue analogues, glasses, ceramics, etc.).25,36,42The physical origin of this process is quantum mechanical tunneling, which occurs due to the zero point vibrations allowing for polaron hopping without any thermal activation.
In conclusion, we analyzed the spin state dependence of the complex dielectric permittivity of the [Fe(Htrz)2(trz)](BF4)
SCO complex in a frequency range from 0.1 Hz to 1 MHz through its pressure−temperature phase diagram. Using the
HN theory, we succeeded in decoupling and identifying the three relaxation processes that contribute to the complex dielectric permittivity: dipole relaxation, charge transport relaxation, and electrode polarization. We highlighted a significant contribution of the charge transport relaxation process (this contribution was omitted in previous studies). The latter relaxation process strongly depends on the structural properties of the material, which makes the value of the permittivity of some molecular SCO systems higher in the LS state, and in other systems with lower conductivity, the value of the permittivity is higher in the HS state. In addition,fine details of the relaxation process, such as the spin state dependence of relaxation times and their distributions, could be also revealed. Remarkably, using this approach, it becomes now possible to predict and rationalize at which frequency the conductivity and dielectric permittivity display the largest variations during the spin transition.
Figure 3. Pressure dependence of the HNfitting parameters, which characterize the dipolar relaxation process (left column) and the charge transport relaxation process (right column). (Arrows indicate compression and decompression. Data are shown for two different temperatures.)
150 T(K) 200 250 300 350400 10•7 10.a 1 MHz E,,= 37 meV 10-9
-
E
10·10 10 kHz CJ 10·11 1--
1/)-
10•12 -t) 10•13 1 Hz 10•14 10·15 10•16 10 mHz 6.5 6.0 5.5 5.0 4.5 4.0 3.5 3.0 2.51000/T(K)
Figure 4. Anhenius plots of the ac conductivity recorded at various applied frequencies in the heating mode. The high and low temperature activation energies are shown for the lowest and highest frequencies.
■
ASSOCIATED CONTENTe
Supporting InformationThe Supporting Information is available free of charge on the
ACS Publications website at DOi: 10.1021/acs.jp clett.9b02678.
Details about the functions used for dielectric relaxation analysis, dielectric measurements under varying fre quency, temperature, and pressure of the sample, as well
as details regarding the fits using the Havriliak-Negami
equations and the corresponding fitting parameters (PDF)
■
AUTHOR INFORMATIONCorresponding Authors
*E mail: aurelian.rotaru@>usm.ro.
*E mail: azzedine.bousseksou@>lcc toulouse.fr. ORCID•
Llonel Salmon: 0000 0002 8064 8960 Gabor Molnar: 0000 000 I 6032 6393
Aurelian Rotaru: 0000 0002 8782 7988 Notes
The authors declare no competing financial interest.
■
ACKNOWLEDGMENTSThis work was founded by the European Commission through
the SPINSWITCH project (H2020 MSCA RISE 2016, Grant
Agreement No. 734322). The financial support of the EXCALIBUR project (Contract No. 18 PFE/16.10.2018) is also acknowledged.
■
REFERENCES(1) van der Molen, S. ].; Liljeroth, P. Charge transport through molecular switches. J. Phys.: Ccndens. Matter 2010, 22, 133001.
(2) Sanvito, S. Molecular spintronics. Chem. Soc. Rev. 2011, 40,
3336-3355.
(3) Bellec, A; Lagoute, ].; Repain, V. Molecular electronics: Scanning tunneling microscopy and single molecule devices. C. R.
Chim. 2018, 21, 1287-1299.
(4) Lefter, C.; Davesne, V.; Salmon, L.; Molnar, G.; Demont, P.;
Rotaru, A; Bousseksou, A. Charge Transport and Electrical Properties
of Spin Crossover Materials: Towards Nanoelectronic and Spintronic Devices. Magnetochemistry 2016, 2, 18.
(5) Ruiz, E. Charge transport properties of spin crossover systems.
Phys. Chem. Chem. Phys. 2014, 16, 14-22.
(6) Molnar, G.; Rat, S.; Salmon, L.; Nicolazzi, W.; Bousseksou, A Spin crossover nanomaterials: from fundamental concepts to devices. Adv. Matu. 2018, 30, 1703862.
(7) Gütlich, P., Goodwin, H., Eds. Spin Crossover in Transition Metal
Compounds 1-IU; Topics in Current Chemistry; Springer, 2004; Vol. 233-235.
(8) Halcrow, M. A Spin Crossover Mimrials. Properties and
Applications; John Wiley & Sons, Ltd., 2013.
(9) Bousseksou, A; Molnar, G.; Demont, P.; Menegotto,
J.
Observation of a thermal hysteresis loop in the dielectric constant of spin crossover complexes: Towards molecular memory devices. J.
Mater. Chem. 2003, 13, 2069-2071.
(10) Matsuda, M.; lsowci, H.; Tajima, H. Electroluminescence quenching caused by a spin crossover transition. Chem. Lett. 2008, 37, 374- 375.
( 11) Osorio, E. A; Moth Poulsen, K.; van der Zant, H. S.].; Paaslœ,
J.;
Hedegard, P.; Flensberg, K.; Bendix, ].; Bjornholm, T. Electrical Manipulation of Spin States in a Single Electrostatically Gated Transition Meta! Complex. Nano Lett. 2010, 10, 105-110.(12) Mahfoud, T.; Molnar, G.; Cobo, S.; Salmon, L; Thibault, C.; Vieu, C.; Demont, P.; Bousseksou, A Electrical properties and non volatile memory effect of the [Fe(HB(p-zh)i] spin crossover complex
integrated in a microelectrode device. AppL Phys. Lett. 2011, 99, 053307.
(13) Prins, F.; Monrabal Capilla, M.; Osorio, E. A; Coronado, E.;
van der Zant, H. S.
J.
Room Temperature Electrical Addressing of a Bistable Spin Crossover Molecular System. Adv. Matu. 2011, 23,1545-1549.
(14) Miyamachi, T.; Gruber, M.; Davesne, V.; Bowen, M.; Boukari,
$.;Joly, L.; Scheurer, F.; Rogez, G.; Yamada, T. K.; Ohresser, P.; et al. Robust spin crossover and memristance across a single molecule. Nat.
Commun. 2012, 3, 938.
(15) Gopakumar, T. G.; Matino, F.; Naggert, H.; Bannwarth, A; Tuczek, F.; Berndt, R Electron induced spin crossover of single molecules in a bilayer on gold. Angew. Chem, Int. Bd. 2012, 51, 6262-6266.
(16) Rotaru, A; Gural'skiy, 1.y.A; Molnar, G.; Salmon, L.; Demont, P.; Bousseksou, A Spin state dependence of electrical conductivity of spin crossover materials. Chem. Commun. 2012, 48, 4163-4165.
(17) Rotaru, A; Dugay, ].; Tan, R P.; Guralskiy, 1. A.; Salmon, L.;
Demont, P.; Carrey, ].; Molnar, G.; Respaud, M.; Bousseksou, A Nano electromanipulation of Spin Crossover Nanorods: Towards Switchable Nanoelectronic Devices. Adv. Matu. 2013, 25, 1745-1749.
(18) Zhang, X; Palamarciuc, T.; Letard, J.F.; Rosa, P.; Lozada, E.
V.; Torres, F.; Rosa, L. G.; Doudin, B.; Dowben, P. A The spin state of a molecular adsorbate driven by the furroelectric substrate polarization. Chem. Commun. 2014, 50, 2255-2257.
(19) Koo, Y. S.; Galan Mascaros,J. R Spin Crossover Probes Confer Multistability to Organic Conducting Polymers. Adv. Marer. 2014, 26, 6785-6789.
(20) Devid, E. ].; Martinho, P. N.; Kamalakar, M. V.; Salitros, I.; Prendergast, Û.; Dayen, J.F.; Meded, V.; Lemma, T.; Gonzalez Prieto, R; Evers, F.; et al. Spin transition in arrays of gold nanoparticles and spin crossover molecules. ACS Nano 2015, 9, 4496-4507.
(21) Dugay, ].; Aarts, M.; Giménez Marqués, M.; Kozlova, T.;
Zandbergen, H. W.; Coronado, E.; van der Zant, H. S.
J.
Phase Transitions in Spin Crossover Thin Films Probed by Graphene Transport Measurements. Nano Lett. 2017, 17, 186-193.(22) Frisenda, R; Harzmann, G. D.; Celis Gil,J. A; Thijssen,J. M.;
Mayor, M.; van der Zant, H. S. J. Stretching lnduced Conductance
lncrease in a Spin Crossover Molecule. Nano Lett. 2016, 16, 4733. (23) Aragonès, A C.; Aravena, D.; Cerda,
J.
L; Ads Castillo, Z.; Li, H.; Real,J.
A; Sanz, F.; Hihath, ].; Ruiz, E.; Dfez Pérez, L LargeConductance Switching in a Single Molecule Device through Room Temperature Spin Dependent Transport. Nano Lett. 2016, 16, 218− 226.
(24) Bairagi, K.; Iasco, O.; Bellec, A.; Kartsev, A.; Li, D.; Lagoute, J.; Chacon, C.; Girard, Y.; Rousset, S.; Miserque, F.; et al. Molecular scale dynamics of light induced spin cross over in a two dimensional layer. Nat. Commun. 2016, 7, 12212.
(25) Lefter, C.; Rat, S.; Costa, J. S.; Manrique Juárez, M. D.; Quintero, C. M.; Salmon, L.; Séguy, I.; Leichle, T.; Nicu, L.; Demont, P.; et al. Current Switching Coupled to Molecular Spin States in Large Area Junctions. Adv. Mater. 2016, 28, 7508−7514.
(26) Rat, S.; Piedrahita Bello, M.; Salmon, L.; Molnár, G.; Demont, P.; Bousseksou, A. Coupling mechanical and electrical properties in spin crossover polymer composites. Adv. Mater. 2018, 30, 1705275.
(27) Shalabaeva, V.; Ridier, K.; Rat, S.; Manrique Juarez, M. D.; Salmon, L.; Séguy, I.; Rotaru, A.; Molnár, G.; Bousseksou, A. Room temperature current modulation in large area electronic junctions of spin crossover thin films. Appl. Phys. Lett. 2018, 112, 013301.
(28) Poggini, L.; Gonidec, M.; González Estefan, J. H.; Pecastaings, G.; Gobaut, B.; Rosa, P. Vertical Tunnel Junction Embedding a Spin Crossover Molecular Film. Adv. Electr. Mater. 2018, 4, 1800204.
(29) Diaconu, A.; Lupu, S. L.; Rusu, I.; Risca, I. M.; Salmon, L.; Molnár, G.; Bousseksou, A.; Demont, P.; Rotaru, A. Piezoresistive Effect in the [Fe(Htrz)2(trz)](BF4) Spin Crossover Complex. J. Phys. Chem. Lett. 2017, 8, 3147−3151.
(30) Dugay, J.; Evers, W.; Torres Cavanillas, R.; Giménez Marqués, M.; Coronado, E.; Van der Zant, H. S. J. Charge Mobility and Dynamics in Spin Crossover Nanoparticles Studied by Time Resolved Microwave Conductivity. J. Phys. Chem. Lett. 2018, 9, 5672−5678.
(31) Lefter, C.; Tricard, S.; Peng, H.; Molnár, G.; Salmon, L.; Demont, P.; Rotaru, A.; Bousseksou, A. Metal Substitution Effects on the Charge Transport and Spin Crossover Properties of [Fe1−xZnx(Htrz)2(trz)](BF4) (trz = Triazole). J. Phys. Chem. C 2015, 119, 8522−8529.
(32) Lefter, C.; Tan, R.; Dugay, J.; Tricard, S.; Molnar, G.; Salmon, L.; Carrey, J.; Rotaru, A.; Bousseksou, A. Light induced modulation of charge transport phenomena across the bistability region in [Fe(Htrz)2(trz)](BF4) spin crossover micro rods. Phys. Chem. Chem. Phys. 2015, 17, 5151−5154.
(33) Lefter, C.; Tan, R.; Dugay, J.; Tricard, S.; Molnár, G.; Salmon, L.; Carrey, J.; Nicolazzi, W.; Rotaru, A.; Bousseksou, A. Unidirectional electric field induced spin state switching in spin crossover based microelectronic devices. Chem. Phys. Lett. 2016, 644, 138−141.
(34) Holovchenko, A.; Dugay, J.; Gimenez Marques, M.; Torres Cavanillas, R.; Coronado, E.; van der Zant, H. S. J. Near Room Temperature Memory Devices Based on Hybrid Spin Crossover@ SiO2 Nanoparticles Coupled to Single Layer Graphene Nano electrodes. Adv. Mater. 2016, 28, 7228−7233.
(35) Lefter, C.; Gural’skiy, I.y.A.; Peng, H.; Molnár, G.; Salmon, L.; Rotaru, A.; Bousseksou, A.; Demont, P. Dielectric and charge transport properties of the spin crossover complex [Fe(Htrz)2(trz)] (BF4). Phys. Status Solidi RRL 2014, 8, 191−193.
(36) Austin, I. G.; Mott, N. F. Polarons in crystalline and non crystalline materials. Adv. Phys. 1969, 18, 41−102.
(37) Kremer, F.; Schönhals, A. Broadband Dielectric Spectroscopy; Springer Verlag: Berlin Heidelberg, 2003.
(38) Debye, P. Polar molecules. J. Soc. Chem. Ind., London 1929, 48, 1036−1037.
(39) Cole, K. S.; Cole, R. H. Dispersion and Absorption in Dielectrics I. Alternating Current Characteristics. J. Chem. Phys. 1941, 9, 341−351.
(40) Havriliak, S.; Negami, S. A complex plane representation of dielectric and mechanical relaxation processes in some polymers. Polymer 1967, 8, 161−210.
(41) Davidson, D. W.; Cole, R. H. Dielectric Relaxation in Glycerine. J. Chem. Phys. 1950, 18, 1417−1417a.
(42) Molnár, G.; Cobo, S.; Mahfoud, T.; Vertelman, E. J. M.; van Koningsbruggen, P. J.; et al. Interplay between the charge transport
phenomena and the charge transfer phase transition in RbxMn[Fe (CN)6]y·zH2O. J. Phys. Chem. C 2009, 113, 2586−2593.
S1
Supporting Information: Broadband Dielectric Spectroscopy Reveals Peak Values of
Conductivity and Permittivity Switching upon Spin Crossover
Ion Soroceanu
1, Adrian Graur
1, Eugen Coca
1, Lionel Salmon
2, Gabor Molnar
2, Philippe
Demont
3, Azzedine Bousseksou
2,*, Aurelian Rotaru
1,*1
Faculty of Electrical Engineering and Computer Science and MANSiD Research Center,
Stefan cel Mare University, 13, Str. Universitatii, Suceava 720229, Romania
2
LCC, CNRS and Université de Toulouse, F-31077 Toulouse, France
3CIRIMAT, CNRS and Université de Toulouse, F-31068 Toulouse, France
*Corresponding authors:
[email protected]
and
[email protected]
Dielectric relaxation
The Debye function for the frequency dependence of ε*(ω) is given by
,
* ω
1 ω
i
D
where Δε = ε
S– ε
∞is the dielectric relaxation strength
The Debye relaxation time τ
Dis related to the position of maximal loss by ω
p= 2πν
p= 1/τ
D.
In most cases the half width of measured loss peaks is much broader than predicted and in
addition their shapes are asymmetric with a high frequency tail.
A broadening of the dielectric function can be described by the Cole/Cole function
,
* ω
1 ( ω
i
CC)
where 0 < β ≤ 1 is the shape parameter and leads to a symmetrical broadening for the
relaxation function
In some cases, especially in low molecular glass-forming materials, the complex dielectric
function can have also an asymmetric broadening, which can be described by the
Cole-Davidson function:
,
* ω
(1 ω
i
CD)
S2
where γ (0 < γ ≤ 1) is the shape parameter that describes an asymmetric broadening of the
relaxation function.
A more general model function was introduced by Havriliak and Negami (HN-function)
which is in fact a combination of the Cole-Cole and the Cole-Davidson functions:
* ω
(1 ( ω
i
HN) )
Figure S1 shows the influence of the shape parameters on the Cole-Cole plots.
Figure S1. The Cole-Cole plots simulated for various values of the shape parameters: (left)
and (right) respectively.
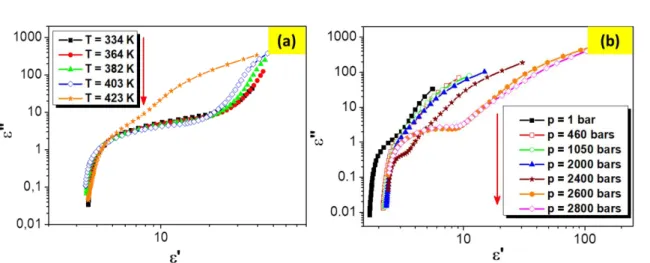
Figure S2. Cole-Cole plots recorded for the [Fe(Htrz)
2(trz)](BF
4) spin crossover compound
(a) at various temperatures upon heating (at 2000 bars) and (b) at various pressures upon
compression (at 393 K).
S3
Frequency influence on the thermal and pressure hysteresis loops
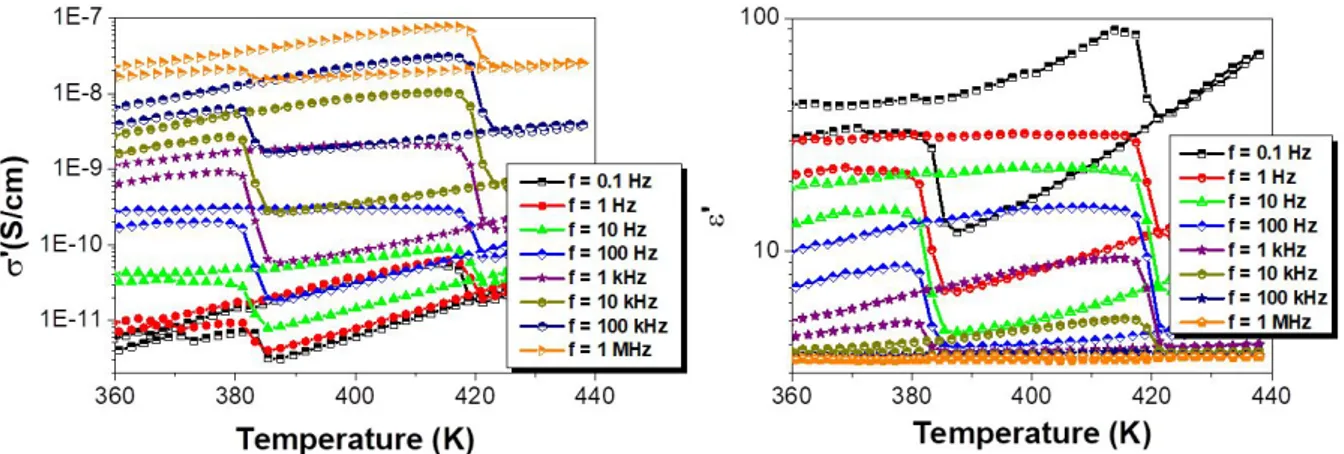
Figure S3. Thermal hysteresis loops of the a.c. conductivity (left) and the real part of the
dielectric permittivity (right), recorded at various frequencies.
Figure S4. Pressure hysteresis loops of the a.c. conductivity (right) and the real part of the
dielectric permittivity (left), recorded at various frequencies.
S4
Fits using the Havriliak-Negami equations
Figure S5 Frequency dependence of the imaginary part of the dielectric permittivity recorded
at various pressures on the pressure hysteresis loop, recorded at 403 K. Solid lines are fits
using the Havriliak-Negami equations for six different pressures on the pressure hysteresis
loop: (a)- at 415 bars (on compression), (b) – at 1500 bars (on compression), (c) –at 2558 bars
(on compression), (d) - at 2807 bars (on compression), (e) - at 1500 bars (on decompression),
(f) – at 1013 bars (on compression).
S5
Figure S6 Frequency dependence of the imaginary part of the dielectric permittivity recorded
at different temperatures on the thermal hysteresis loop recorded at 2000 bars. Solid lines are
fits to the Havriliak-Negami equations for six different points on the thermal hysteresis loop:
a- at 353 K (on heating),b – at 393 K (on heating), c – at 413 K (on heating), d - at 423 K (on
heating), e – at 393 K (on cooling), f – at 385 K (on cooling).
Figure S7 Frequency dependence of the
LS
HSand
LS
HSratios from the pressure
hysteresis loop recorded at 403 K and 2000 bars.
S6
Fitting parameters
Figure S8 (Up panel) Temperature dependence of the relaxation times related to (a) the
dielectric relaxation and (b) the charge transport relaxation. (Down panel) Temperature
dependence of the dielectric strengths related to (c) the dielectric relaxation and d) the charge
transport relaxation processes. The parameters were obtained from the analysis of the
experimental thermal hysteresis loops recorded at an external applied pressure of 1000 bars
(green) and 2000 bars blue).
S7