Thermophysics and Aeromechanics, 2015, Vol. 22, No. 3
Numerical investigation of a standing-wave
thermoacoustic device
M.Z. Dar Ramdane1 and A. Khorsi2
1
Laboratory of Applied Mechanics, USTO-MB Oran, Algeria
2
Preparatory school in sciences and technologies of Oran, Algeria
E-mail: [email protected]
(Received July 4, 2014; in revised form September 26, 2014)
The thermoacoustic effect concerns conversion of energy between a gas and a solid in the presence of acoustic waves. Although the working principle is well understood, the optimal design of thermoacoustic devices remains a challenge. The present work aims to perform a numerical simulation of a simple standing-wave thermoacoustic device. The analysis of the flow and the prediction of the heat transfer are performed by solving the non-linear unsteady Navier-Stokes equations using the finite volume method implemented in the commercial code ANSYS-CFX. The goal of this work is to study the effect of the stack temperature gradient, on the acoustic pressure and the produced acoustic power. This stack temperature gradient generates the thermoacoustic instability in standing-wave thermoacoustic resonator. The obtained results show an increase of the acoustic pressure and the acoustic power while increasing in the stack temperature gradient. The thermodynamic cycles of the thermoacoustic device are illustrated and observed for the different stack temperature gradients.
Key words: CFD, thermoacoustic device, stack temperature gradient, acoustic power.
Introduction
Thermodynamic and fluid-dynamic processes in sound waves in gases, named thermo-acoustic (TA) processes, can convert heat and thermo-acoustic energy from one form to another. Several standing wave TA devices and coolers have been built during the past two decades [1]. They operate without generating exhaust gas which harms the environment. Their comparably simple setup allows for lower manufacturing costs. Their field of application is wide, and the most important advantage relies in the low maintenance costs, due to the lack of moving parts. It was mentioned in [2] that the TA device is potentially a highly reliable, efficient heat device that can be used for electric generation in satellites [3] and the liquefaction of natural gas [4]. Due to their low thermal efficiency, the applications of the TA systems should be asso-ciated with the use of the wasted heat, where a small temperature gradient may exist.
Numerical simulation helps with the design of the TA devices and their several compo-nents, and it allows an overview of the predicted phenomena in the device as well as to observe the energy flow, the thermal and dynamic fields. The first simulation of a model of TA couple including a single stack plate was made in the work [5], where the temperature behavior along the stack plate was investigated. In other simulations made in [6–8], a model with low Mach
The aim of this study is to perform a numerical simulation of a simple standing-wave TA device. The influence of a small stack temperature gradient (STG) on the acoustic pressure and power is studied.
Numerical simulation
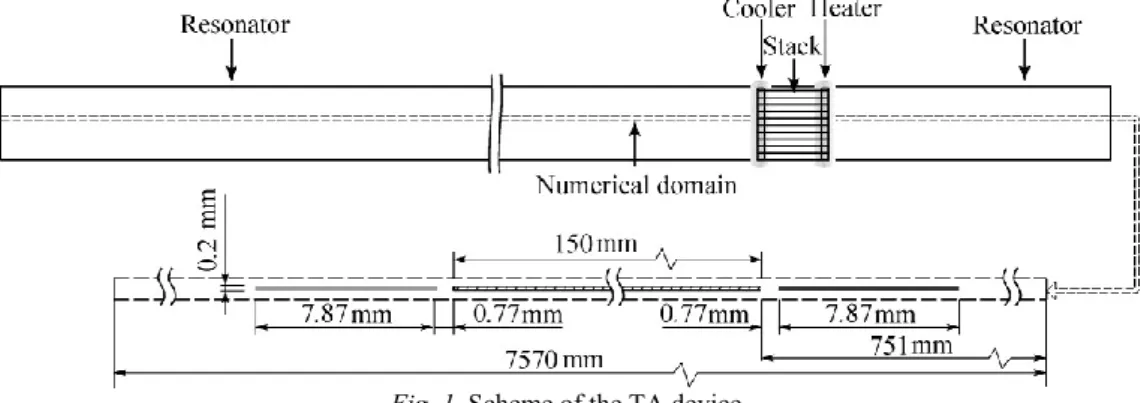
The geometry considered is similar to the geometry studied in the work [14], see Fig. 1. The difference lies only in that both ends of resonator are taken closed, thus, a half wave reso-nator arrangement is provided, and that the whole length of the device is simulated by consid-ering one segment of the stack and heat exchanger. The total length of the device is 7.57 m and the stack is 0.15 m, its center is located at 0.826 m from the right end of the tube. This consists of a stack of Stainless Steel plates with a thickness of 0.20 mm, separated by a gap of 0.77 mm, it is the same spacing between the stack and heat exchangers. The length of the heat exchanger walls is 7.87 mm.
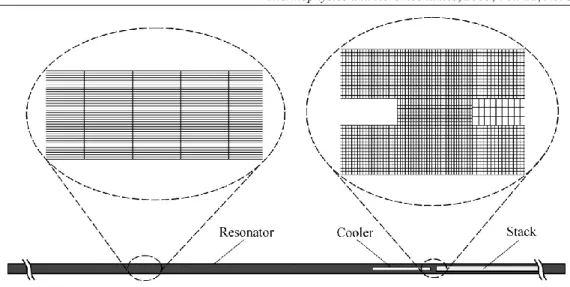
The numerical domain is limited to one elementary pore of the stack in the spanwise di-rection in order to speeding up the calculation process which is very time consuming for a tran-sient simulation. A two-dimensional problem is solved, but a single layer of three-dimensional hexahedral cells-cubes or rectangular parallelepipeds is used in the computation. The generated two-dimensional mesh is extruded by one element in normal direction, and it consists of about half million elements cells. The mesh is refined at the heat exchangers section and the walls where the aspect ratio that represents the ratio of longest to the shortest side in a cell is near to one. Grid extending is applied in the resonator channel, and the value of the aspect ratio is up to 20 as shown in Fig. 2. This allows using larger mesh elements to decrease the number of elements in the computational domain. The mesh resolution is studied such as the results be-come independent of the mesh-size. The grid resolution is 40 nodes in the transversal direction and about 14000 nodes in the longitudinal direction.
The numerical simulation of a standing wave TA device is performed using the finite volume method implemented in the commercial CFD code ANSYS CFX. The simulation do-main consists of a fluid subdodo-main Helium -modelled as a perfect gas- and a solid subdodo-main of the stack-Stainless Steel. The two heat exchangers, heater and cooler, are modelled as wall at constant temperature, see Fig. 3. Constant material properties of Helium and Stainless Steel are given in the Table.
The nonlinear unsteady NavierStokes equations are solved including heat transfer. The finite volume method implemented in ANSYS-CFX CFD code is second order. The in-stantaneous equation of mass, momentum, and energy conservation are solved for a laminar flow and perfect gas. A fixed time step of 7106 s is set, this time step gives a good compro-mise between the numerical dissipation and the solving time of the assumed unsteady laminar compressible flow. The STG is up to 90 K. The temperature of the heat sink (cooler) is taken equal to 293 K. Both ends of resonator are defined as adiabatic walls, thus, the acoustic reflection coefficient is equal to one. Symmetry boundary conditions are prescribed around the computa-tional domain top, bottom, north, and south. Zero velocity is set in the whole tube as an initial
Fig. 2. Hexahedral refined and extended mesh.
Table Constant material properties of Helium and Stainless Steel
Thermal conductivity, Wm1 K–1 Dendity, kgm3 Specific heat Cp, Jkg1K1 Dynamic viscosity, kgm1s1 Helium 1.415104 0.1785 5240 1.86105 Stainless steel 14.9 7854 434
gas is set to 293 K. In these simulations, three STGs are considered: 30 K, 60 K, and 90 K.
Results
The simulation results are dis-cussed in two parts. The first part deals with the effect of STG on the acoustic pressure and the generated acoustic power, and the second part concerns the P-v diagrams of the TA device. Fig-ures 4a, 4b, and 4c show the progress of the acoustic pressure from the onset to the limit cycle. The acoustic pressure is monitored at a point located at the center of the stack. The thermoacoustic effect is successfully observed, and the transi-ent of oscillations from the initial value to the limit cycle is shown. About 120000 iterations are necessary to obtain the limit cycle for the STG of 30 K. This number of iterations decreases to about 97000 and 82000 iterations for the STG of 60 K and 90 K, respectively. Due to the relative high energy potential caused
by the porous stack increasing the STG, the exponential growth of the acoustic pressure in-crease and the time interval required to reach the limit cycle dein-crease. Thus, thermoacoustic instability in the standing wave TA resonator may be generated by a small temperature gradient.
It is shown from Fig. 4a that the amplitude of the acoustic pressure in the limit cycle for the temperature gradient of 30 K equals to 4250 Pa. It exceeds 5000 Pa for the gradient of 60 K as illustrated in Fig. 4b, and it is in the order of 5850 Pa for the STG of 90 K, Fig. 4c. It is ob-served that the increase of acoustic pressure amplitude in the limit cycle is related to the in-crease of STG. The inin-crease in STG contributes to a rise of the heat transfer amount between working gas and walls. The oscillations eigenfrequency which is equal to 65.75Hz is in good agreement with the theoretical value of 66.9 Hz.
The acoustic power Pu is calculated from the ANSYS CFX results for each time step according to the following equation [15]
ac
1
( ).
2
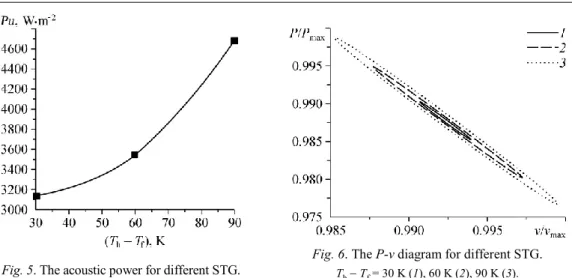
In this equation, the product of the acoustic pressure Pac and the axial velocity u is aver-aged over all time steps during one cycle and integrated at a transversal cross section area lo-cated at the center of the stack. The acoustic power for different STG is presented in Fig. 5. The value of the acoustic power increases from 3100 Wm2 for the STG of 30K to 4700 Wm2 for the STG of 90K. An increase in the acoustic power is observed.
Numerical simulation allows an overview of the important phenomena in the TA device. The thermodynamic cycle of the TA device can be illustrated and observed for different loca-tion of the device. Figure 6 shows the P-v diagram for different STG at a transversal cross sec-tion area located at the center of the stack. It is shown that thermodynamic processes are clear-ly present. The gas is simultaneousclear-ly compressed and moved by the acoustic pressure-wave, its specific volume decrease. Then, heat flows from the solid into the gas warming the gas, in-creasing the pressure and causing thermal expansion. Next, the gas is simultaneously expanded and moved by the pressure-wave. Finally, heat flows from the gas to the solid, cooling the gas, decreasing the pressure and causing thermal contraction of the gas. This brings it back to the start of the cycle. If we consider the pdv work, which represent the area section of the cy-cle, as the useful work, it is clearly shown that the work delivered by the TA device increases with increasing the STG.
Conclusion
A numerical simulation of a simple standing-wave thermoacoustic device is performed. The effect of increasing the STG is studied. This paper clearly shows that the STG generates the TA instability in the standing-wave TA resonator. The acoustic pressure in the limit cycle increase while increasing the STG. This augmentation results in the rise of the amount of heat received and rejected by the working gas. The acoustic power is calculated for different STGs. It is obviously shown that the increase of the STG conducts to an increase of the acoustic pow-er. For different STGs, the thermodynamic cycle and processes of the TA devices are shown. Considering the p·dv work as the useful work, its increase follows the rise of STG.
The CFD model should be validated against experimental data to obtain a design tool for the real thermoacoustic system. The future research work will be focusing on the validation tests which will prove whether the assumed numerical method is able to predict the TA phe-nomenon inside TA resonator or not.
Fig. 5. The acoustic power for different STG.
Fig. 6. The P-v diagram for different STG. Th Tf = 30 K (1), 60 K (2), 90 K (3).
Vol. 127, P. 424451.
7. E. Besnoin and O.M. Knio, Numerical study of thermoacoustic heat exchangers in the thin plate limit, Numer. Heat Transfer, Part A: Applications, 2001, Vol. 40, P. 445471.
8. E. Besnoin, Numerical study of thermoacoustic heat exchangers. PhD thesis, Johns Hopkins University, Baltimore, Maryland, 2001.
9. D. Marx and P. Blanc-Benon, Numerical simulation of stack-heat exchangers coupling in a thermoacoustic refrigera-tor, AIAA J., 2004, Vol. 42, P. 13381347.
10. L.A.J. Nijeholt, M.E.H. Tijani, and S. Spoelstra, Simulation of a traveling wave thermoacoustic engine using computational fluid dynamics, J. Acoust. Soc. Am., 2005, Vol. 118, No. 4, P. 22652270.
11. G. Yu, W. Dai, and E. Luo, CFD simulation of a 300 Hz thermoacoustic standing wave engine, Cryogenics, 2010, Vol. 50, No. 9, P. 615622.
12. F. Zink, J. Vipperman, and L. Schaefer, CFD simulation of a thermoacoustic engine with coiled resonator, Inter. Commun. Heat and Mass Transfer, 2010, Vol. 37, No. 3, P. 226229.
13. F. Zink, J. Vipperman, and L. Schaefer, CFD simulation of thermoacoustic cooling, Inter. J. Heat and Mass Transfer, 2010, Vol. 53, No. 1920, P. 39403946.
14. O. Hireche, C. Weisman, D. Baltean-Carlés, P. Le Quéré, and L. Bauwens, Low mach number analysis of idealized thermoacoustic engines with numerical solution, J. Acoust. Soc. Am., 2010, Vol. 128, No. 6, P. 34383448. 15. G. Swift,Thermoacoustics, Springer Handbook of Acoustics, Springer, New York, 2007, P. 239255.