The
2015
Ageing Report
EUROPEAN ECONOMY 3|2015
Economic and budgetary
projections for the 28 EU
The European Economy series contains important reports and communications from the Commission
to the Council and the Parliament on the economy and economic developments. Unless otherwise indicated the texts are published under the responsibility of the European Commission
Directorate-General for Economic and Financial Affairs Unit Communication
B-1049 Brussels Belgium
E-mail : [email protected]
LEGAL NOTICE
Neither the European Commission nor any person acting on its behalf may be held responsible for the use which may be made of the information contained in this publication, or for any errors which, despite careful preparation and checking, may appear.
This paper exists in English only and can be downloaded from http://ec.europa.eu/economy_finance/publications/.
Europe Direct is a service to help you find answers to your questions about the European Union.
Freephone number (*):
00 800 6 7 8 9 10 11
(*) The information given is free, as are most calls (though some operators, phone boxes or hotels may charge you). More information on the European Union is available on http://europa.eu.
Luxembourg: Publications Office of the European Union, 2015
KC-AR-15-003-EN-N (online) KC-AR-15-003-EN-C (print)
ISBN 978-92-79-44746-4 (online) ISBN 978-92-79-44747-1 (print)
doi:10.2765/877631 (online) doi:10.2765/973401 (print)
© European Union, 2015
The 2015 Ageing Report
Economic and budgetary projections for the 28 EU
Member States (2013-2060)
ACKNOWLEDGEMENTS
This report has been prepared in response to the mandate the Economic and Financial Affairs (ECOFIN) Council gave to the Economic Policy Committee (EPC) in 2012 to update and further deepen its common exercise of age-related expenditure projections by 2015, on the basis of a new population projection by Eurostat.
This is the fifth report with long-term projections of the budgetary impact of population ageing. It covers the 28 EU Member States and Norway over the period 2013–2060. In accordance with its normal practice, the EPC mandated a working group, the Ageing Working Group (AWG) under the chairmanship of Peter Part, to take forward the work needed to discharge this remit.
This report is presented by the EPC and the European Commission services (Directorate General for Economic and Financial Affairs - DG ECFIN) after full discussion on the basis of the AWG’s comprehensive work. The Directorate-General for Economic and Financial Affairs provided the necessary analysis and calculations used in the report. The demographic projections (EUROPOP2013) were carried out by Eurostat.
The report was prepared under the supervision of Lucio Pench (Director in DG ECFIN), Jens Granlund (Chairman of the EPC), Peter Part (Chairman of the AWG), Giuseppe Carone (Head of Unit in DG ECFIN). The main contributors were Santiago Calvo Ramos, Per Eckefeldt, Luigi Giamboni, Veli Laine, Joao Medeiros, Stephanie Pamies, Etienne Sail, Christoph Schwierz and the members of the AWG (see list of Members below). The EPC and the Economic and Financial Affairs DG would like to thank all those concerned.
Comments on the report would be gratefully received at the following addresses:
DG ECFIN - Unit C2
Directorate-General for Economic and Financial Affairs European Commission
Giuseppe Carone Rue de la Loi 200 B-1049 Brussels
E-mail: [email protected]
Secretariat of the Economic Policy Committee
Michael Keenan Rue de la Loi 200 B-1049 Brussels
MEMBERS OF THE AGEING WORKING GROUP CHAIRMAN
Mr. Peter PART Ministry of Finance, Austria BELGIQUE-BELGÏE
Mr. Michel ENGLERT Bureau fédéral du Plan - Federaal Planbureau Mr. Peter WILLEME Bureau fédéral du Plan - Federaal Planbureau
BULGARIA
Ms. Penka TANEVA National Social Security Institute Ms. Rositsa TRANKOVA Ministry of Finance
CZECH REPUBLIC
Mr. Jindrich MARVAL Ministry of Finance
Mr. Zbynek STORK Ministry of Finance
DANMARK
Mr. Jonas BJARKE JENSEN Ministry of Finance Mr. Jørgen SLOTH BJERRE HANSEN Ministry of Finance
BUNDESREPUBLIK DEUTSCHLAND
Mr. Werner EBERT Federal Ministry of Finance
Mr. Thomas SALZMANN Federal Ministry of Labour and Social Affairs
ESTONIA
Mr. Tõnu LILLELAID Ministry of Finance Mr. Tanel STEINBERG Ministry of Finance
ELLAS
Ms. Marianna PAPAMICHAIL National Actuarial Authority Mr. Athanasios C. THANOPOULOS Ministry of Finance
ESPAÑA
Mr. Juan VARELA Ministerio de Hacienda y Administraciones Públicas
FRANCE
Ms. Julia CUVILLIEZ Ministère des Finances et des Comptes publics Mr. Geoffrey LEFEBVRE Ministère des Finances et des Comptes publics
CROATIA
Ms. Ljiljana MARUSIC Croatian Pension Insurance Institute Ms. Josipa MESTROVIC SPOLJAR Croatian Health Insurance Fund
IRELAND
Mr. Ian POWER Department of Finance
Ms. Laura WEYMES Department of Finance
ITALIA
Mr. Rocco APRILE Ministero dell'Economia e delle Finanze Mr. Marco CACCIOTTI Ministero dell'Economia e delle Finanze
CYPRUS
Ms. Maria MATSI Ministry of Finance
Mr. Costas STAVRAKIS Ministry of Labour, Welfare and Social Insurance
LATVIA
Ms. Jūlija KEKĻA Ministry of Finance
Ms. Sandra STABIŅA Ministry of Welfare
LITHUANIA
Ms. Vidija PASTUKIENE Ministry of Social Security and Labour Ms. Rasa SLIOGERIENE Ministry of Finance
LUXEMBOURG
Mr. François PELTIER STATEC
Mr. Raymond WAGENER Inspection Générale de la Securité Sociale
HUNGARY
Mr. Marton SZILI Ministry for National Economy
MALTA
Mr. Melchior VELLA Ministry of Finance Ms. Pauline SALIBA Ministry of Finance
NEDERLAND
Mr. Niels VERMEER Ministry of Finance
Mr. Harry TER RELE Centraal Planbureau
ÖSTERREICH
Mr. Peter GRAFENEDER Bundesministerium für Finanzen Ms Caroline HABERFELLNER Bundesministerium für Finanzen
POLAND
Ms. Joanna STACHURA Ministry of Finance Mr. Pawel STRZELECKI National Bank of Poland
PORTUGAL
Ms. Conceicao NUNES Ministry of Finance Ms. Ariana PAULO Ministry of Finance
ROMANIA
Mr. Daniel VALCU Ministry of Public Finance
Mr. Lucian NOVAK National Commission for Economic Forecasting
SLOVENIA
Mr. Franc KLUZER Ministry of Finance
Ms. Eva ZVER Institute of Macroeconomic Analysis and Development
SLOVAKIA
Mr. Peter HARVAN Ministry of Finance
Mr. Tomáš RIZMAN Ministry of Finance
SUOMI FINLAND
Mr. Mauri KOTAMÄKI Ministry of Finance
SVERIGE
Mr. Jonas NORLIN Ministry of Finance Mr. Olle SUNDBERG Ministry of Finance
UNITED KINGDOM
Mr. Shay BISHNOI HM Treasury
OBSERVERS
Mr. Yngvar DYVI Ministry of Finance, Norway Mr. Per-Mathis KONGSRUD Ministry of Finance, Norway
EUROPEAN CENTRAL BANK
Ms. Carolin NERLICH EUROSTAT Mr. Giampaolo LANZIERI EPC SECRETARIAT Mr. Balazs HORVATH Mr. Michael KEENAN Mr. Fuat VARDAR EUROPEAN COMMISSION Mr. Giuseppe CARONE Mr. Per ECKEFELDT
Part I:
Underlying demographic and macroeconomic
assumptions 13
1. Demographic assumptions 14
1.1. Population projections 14
2. Macroeconomic assumptions 30
2.1. Labour force projections 30
2.2. Labour productivity and gdp 40
2.3. Comparison with the 2012 Ageing Report 45
3. Sensitivity tests 48
3.1. Overview of alternative scenarios 48
3.2. Projection results 48
Part II:
Long-term projections of age-related expenditure and
unemployment benefits
53
1. Pensions 54
1.1. Introduction 54
1.2. Taxonomy of main pension schemes in EU Member States 54
1.3. Coverage of pension projections 55
1.4. Characteristics of pension systems in Europe 56
1.5. Pension expenditure projections 73
1.6. Drivers of pension expenditure 83
1.7. Decomposition of new pensions 95
1.8. Sensitivity tests 99
1.9. Comparison with the 2012 Ageing report 105
1.10. ANNEX – Scope for improvements in the Member States projections 112
2. Health care 113
2.1. Introduction 113
2.2. Determinants of health care expenditure 115
2.3. Demographic structure of the population 115
2.4. Health status 118
2.5. Short overview of the projection methodology 121
2.6. Projection results 126
2.7. AWG reference scenario 134
2.8. Comparison with the 2012 Ageing Report 135
2.9. Conclusions 138
3. Long term care 142
3.1. Introduction 142
3.2. Determinants of long-term care expenditure 143
3.3. Overview of the projection methodology 148
3.4. Projection results 152
3.5. Comparison with the 2012 Ageing Report 160
3.6. Conclusions 162
4.1. Introduction 166
4.2. General characteristics of national education systems 166
4.3. Methodology and results 168
4.4. Sensitivity test: the high enrolment rate scenario 172
5. Unemployment benefits 174
5.1. Introduction 174
5.2. The base period and the dataset 174
5.3. Projections in percentage of gdp 176
A1. Pension projection questionnaire 179
A2. Coverage of pension projections and additional information 183
A3. Detailed overview of indexation rules 185
A4. Input data used to project long-term care expenditure 187
A5. Summary of the methodology used to project LTC expenditure 196
A6. Education statistics 199
A6.1. Methodology 199
A6.2. Data 201
A7. Unemployment benefit expenditure projections: methodology and sources 206
Part III:
Statistical Annex – Cross-Country Tables
209
Part IV:
Statistical Annex – Country Fiches
297
1. Belgium 298
2. Bulgaria 301
3. The Czech Republic 304
4. Denmark 307 5. Germany 310 6. Estonia 313 7. Ireland 316 8. Greece 319 9. Spain 322 10. France 325 11. Croatia 328 12. Italy 331 13. Cyprus 334 14. Latvia 337 15. Lithuania 340 16. Luxembourg 343 17. Hungary 346 18. Malta 349 19. The Netherlands 352 20. Austria 355 21. Poland 358 22. Portugal 361 23. Romania 364 24. Slovenia 367 25. Slovakia 370 26. Finland 373
27. Sweden 376 28. United Kingdom 379 29. Norway 382 30. European Union 385 31. Euro Area 388
Part V:
Resources 391
1. Abbreviations and symbols used 392
2. References 396
LIST OF TABLES
0.1. Overview of the 2015 long-term budgetary projections – Baseline scenario 9
0.2. Overview of the 2015 long-term budgetary projections – TFP risk scenario 10 0.3. Overview of the 2015 long-term budgetary projections – AWG risk scenario 11 I.1.1. Peaks and troughs for the size of the total population and the working-age
population 22
I.2.1. Labour supply projections in the 35
I.2.2. Breakdown of potential GDP growth in percentage (average annual values,
2013-2060) 44
I.3.1. Overview of sensitivity tests 48
I.3.2. Breakdown of potential GDP growth in % by scenario (average annual values,
2013-2060) 50
II.1.1. Taxonomy of main public pension schemes across Member States 54
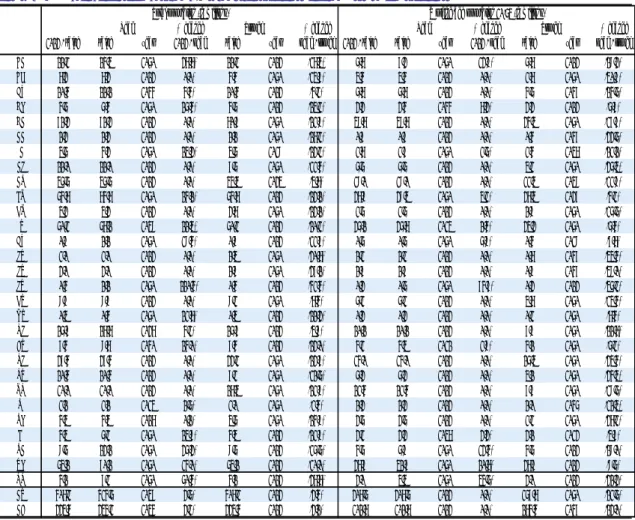
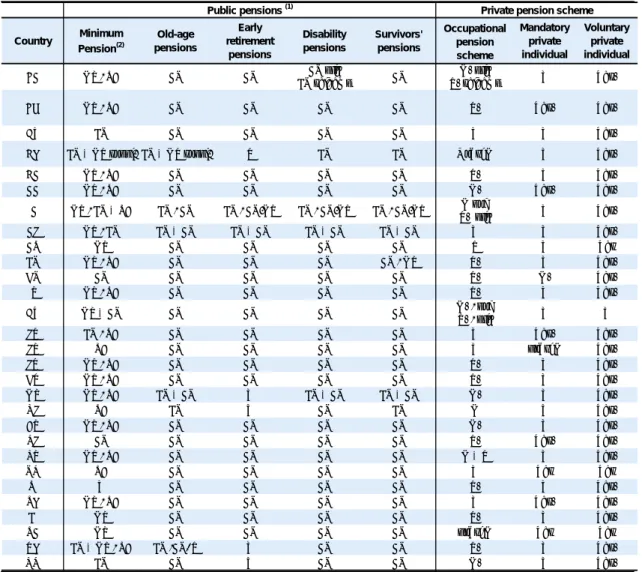
II.1.2. Pension schemes in EU Member States and projection coverage 58
II.1.3. Key parameters of pension system in Europe (old-age pensions) 59
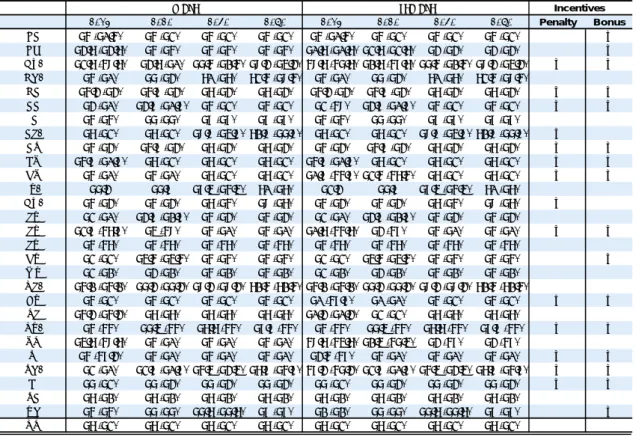
II.1.4. Statutory retirement ages, early retirement (in brackets) and incentives to
postpone retirement 65
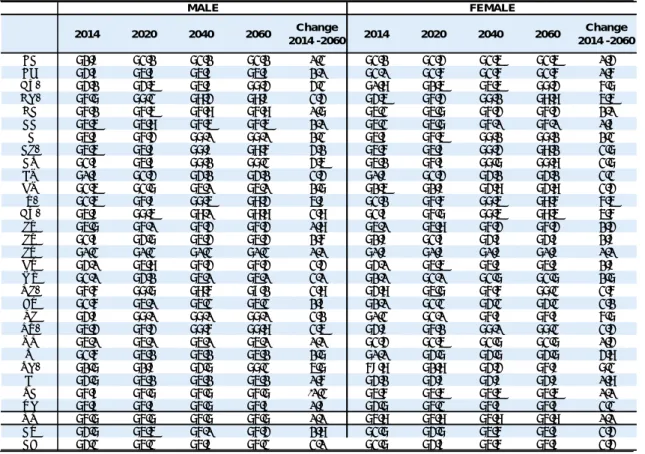
II.1.5. Average effective exit age from the labour market by gender 66
II.1.6. Duration of retirement by gender 67
II.1.7. Duration of retirement over average length of working career by gender 69
II.1.8. Percentage of adult life spent at retirement by gender 70
II.1.9. Contributions to the public pension system in 2013 and 2060 (% of GDP) 71
II.1.10. Contribution rates to public pension system 73
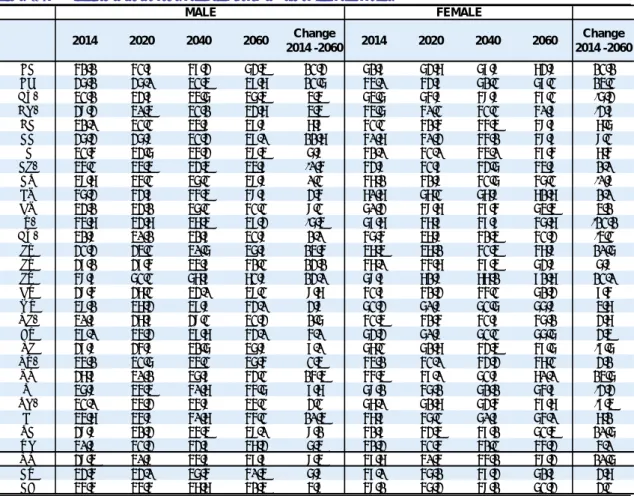
II.1.11. Level and change in gross public pension expenditure over 2013-2060, baseline
scenario (in % and p.p. of GDP) 74
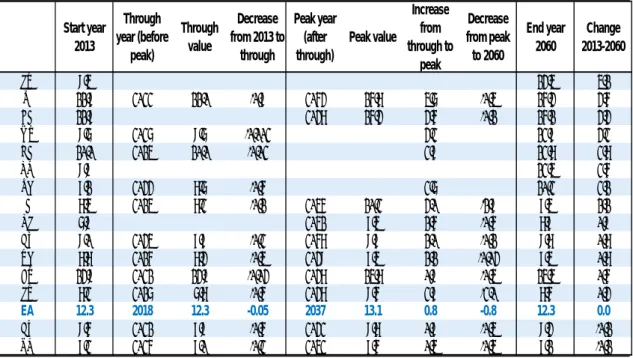
II.1.12. Projected through and peak years and values for gross public pension expenditure (% and p.p. of GDP) - for countries projecting to experience a through in public pension expenditures ratio during the first part of the
projection period 77
II.1.13. Projected peak and through years and values for gross public pension
expenditure (% and p.p. of GDP) - for countries projecting to experience a peak in public pension expenditures ratio during the first part of the projection period 77 II.1.14. Change in gross public pension expenditure over the period 2013-2060 (in p.p.
of GDP) 78
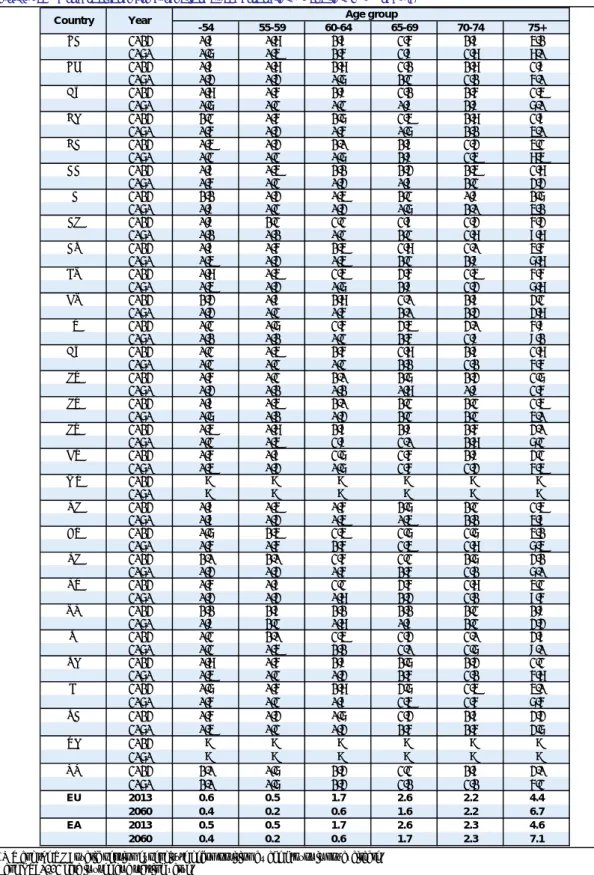
II.1.15. Share of public pensioners in the EU by age groups (as % of total public
pensioners) 79
II.1.17. Private (occupational and individual) pension schemes expenditure in 2013 and
2060 82
II.1.18. Decomposition of gross public pension expenditure change over 2013-2060 87 II.1.19. Contribution of the dependency ratio effect to the change in public pension
expenditure (in p.p. of GDP) 88
II.1.20. Coverage ratio development in 2013-2060 (as % of population aged 65 and
over) 89
II.1.21. Contribution of the coverage ratio effect to the change in public pension
expenditure (in p.p. of GDP) 89
II.1.22. Contribution of the labour market effect to the change in public pension
expenditure (in p.p. of GDP) 90
II.1.23. Contribution of the benefit ratio effect to the change in public pension
expenditure (in p.p. of GDP) 91
II.1.24. Benefit ratio in 2013 and 2060 (in %) 92
II.1.25. Replacement rate in 2013 and 2060 (in %) 93
II.1.26. Minimum pension and indexation 95
II.1.27. Contributory period 97
II.1.28. Average effective accrual rates 98
II.1.29. Overview of sensitivity tests (including policy-change scenario): difference in
assumptions compared with the baseline scenario 99
II.1.30. Summary table: impact of all (unfavourable) sensitivity tests on gross public pension expenditure change over 2013-2060 (deviation from baseline change,
p.p. of GDP) 104
II.1.31. Comparison of gross public pension expenditure levels (2013 and 2060) in the
2012* and 2015 projections rounds (% and p.p. of GDP) 106
II.1.32. Decomposition of the difference in the gross public pension expenditure change over period 2013-2060 between the 2015 and 2012* projection rounds
(in p.p. of GDP) 110
II.1.33. Alternative decomposition of the difference in the gross public expenditure change over 2013-2060 between the 2015 and 2012* projection rounds (in p.p.
of GDP) 111
II.2.1. Public health care expenditures (including long-term nursing care) in EU
Member States, 1970-2012 115
II.2.2. Graph II.2.2:Schematic presentation of the projection methodology 123
II.2.3. Overview of different scenarios used to project health care spending 125 II.2.4. Health care reforms with direct budget impact taken into account in the
projections 128
II.2.5. Demographic scenario - projected increase in public expenditure on health
care over 2013-2060, as % of GDP 128
II.2.6. High life expectancy scenario - projected increase in public expenditure on
health care over 2013-2060, as % of GDP. 129
II.2.7. Constant health scenario - projected increase in public expenditure on health
care over 2013-2060, as % of GDP 129
II.2.8. Death-related costs scenario - projected increase in public expenditure on
health care over 2010-2060, as % of GDP 130
II.2.9. Income elasticity scenario (public spending on health care, as % of GDP) 131 II.2.10. The EU28 cost convergence scenario (public spending on health care, as % of
GDP) 132
II.2.11. Labour intensity scenario (public spending on health care, as % of GDP) 132 II.2.12. Sector-specific composite indexation scenario (public spending on health care,
as % of GDP) 133
II.2.13. Non-demographic drivers scenario - projected increase in public expenditure
II.2.14. AWG reference scenario - projected increase in public expenditure on health
care over 2013-2060, as % of GDP 134
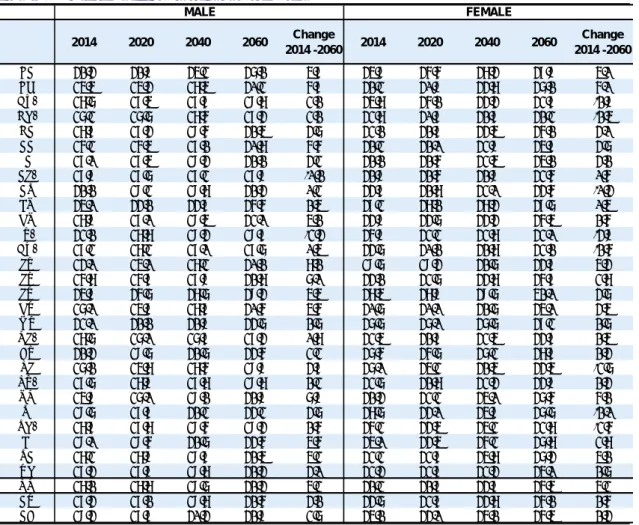
II.2.15. AWG risk scenario - projected increase in public expenditure on health care
over 2013-2060, as % of GDP 135
II.2.16. TFP risk scenario - projected increase in public expenditure on health care over
2013-2060, as % of GDP 135
II.2.17. Decomposing the impact of drivers on differences in spending growth in health care expenditures between the 2015 and 2012 Ageing reports, in pp. of GDP 137 II.2.18. Overview of scenario results - increase in public expenditure on health care
over 2013-2060, as p.p. of GDP 139
II.3.1. Long-term care reforms with direct budget impact taken into account in the
projections 152
II.3.2. Indexation of LTC spending to prices in Germany 154
II.3.3. Demographic scenario, projected public expenditure on long-term care as % of
GDP 155
II.3.4. Base case scenario, projected public expenditure on long-term care as % of
GDP 155
II.3.5. High life expectancy scenario, projected public expenditure on long-term care
as % of GDP 156
II.3.6. Constant disability scenario, projected public expenditure on long-term care as
% of GDP 156
II.3.7. Shift from informal to formal care scenario, projected public expenditure on
long-term care as % of GDP 157
II.3.8. Coverage convergence scenario, projected public expenditure on long-term
care as % of GDP 158
II.3.9. Cost convergence scenario, projected public expenditure on long-term care as
% of GDP 158
II.3.10. Cost and coverage convergence scenario, projected public expenditure on
long-term care as % of GDP 159
II.3.11. AWG reference scenario, projected public expenditure on long-term care as %
of GDP 160
II.3.12. AWG risk scenario, projected public expenditure on long-term care as % of GDP 160 II.3.13. Comparison between public long-term care spending as % of GDP in the 2015
and the 2012 Ageing Reports, in the base year (i.e. 2013) of current projections 162 II.3.14. Decomposing the impact of drivers on differences in spending growth between
the 2015 and the 2012 Ageing Reports- based on the base case scenario, in pp.
of GDP. 163
II.3.15. Overview of results across scenarios – Change in spending as % of GDP
2013-2060 164
II.4.1. Results of the baseline (public expenditure on education as percentage of
GDP; ESA2010 for GDP (a)) 169
II.4.2. Breakdown in the total variation between 2013 and 2060 (ESA2010 for GDP(a)) -
baseline scenario - 170
II.4.3. Breakdown of revisions in expenditure-to-GDP ratio (2015 round minus 2012
round; ESA1995), values for the baseline scenario in 2060 171
II.4.4. Baseline and high enrolment rate scenarios (public expenditure-to-GDP ratio;
ESA2010(a)) 172
II.5.1. Periodic full and partial unemployment benefits in % of GDP (ESSPROS), ESA2010
for GDP(1) 175
II.5.2. Unemployment rate projections 176
II.5.3. Base values for the unemployment rate (UR) and the unemployment
II.5.4. Expenditure projections of unemployment benefits (UB) in % of GDP (ESA2010) -
base period 2013-2011, unless stated otherwise - 178
II.A1.1. Pension projections reporting framework: blocks common to all schemes 179 II.A1.2. Pension projection reporting framework: decomposition of new public pension
expenditure - earnings related for points schemes 181
II.A1.3. Pension projection reporting framework: decomposition of new public pension
expenditure - earnings related for DB schemes 181
II.A1.4. Pension projection reporting framework: decomposition of new public pension
expenditure - earnings related for NDC schemes 181
II.A1.5. Pension projections reporting framework: decomposition of new private pension
expenditure 182
II.A2.1. Coverage of the pension projections 183
II.A2.2. Social contributions to the public pension system in 2013 and in 2060 (% of gross
wage bill) 184
II.A2.3. Gross public pension expenditure average, standard deviation and coefficient
of variation over the period 2013-2060 (% of GDP) 184
II.A3.1. Legal indexation rule in EU Member States 185
II.A3.2. Indexation rules applied in the projections exercise (when different from the
legal rule) 186
II.A4.1. Combinations of data sources for estimating long-term care expenditure 188 II.A4.2. Availability of input data for long-term care expenditure projections 189 II.A4.3. Public expenditure on LTC on the basis of the SHA joint questionnaire with proxy
for HC.R.6 from ESSPROS and cash benefits from ESSPROS as a % of GDP, most
recent SHA data 190
II.A4.4. Coverage rates in the base case scenario 192
II.A4.5. Dependency rates, based on EU-SILC 195
II.A5.1. Overview of scenario assumptions to project long-term care expenditure 198 II.A6.1. Base enrolment rates by country, age and ISCED level (average of years 2010
and 2011) 202
II.A6.2. Expenditure-to-GDP ratios in the base period (average 2010-2011) - breakdown
by component (ESA2010(d)) 203
II.A6.3. Expenditure-to-GDP ratios in the base period (average 2010-2011) - breakdown
by ISCED levels (ESA2010(d)) 203
II.A6.4. Results of the baseline scenario (public education expenditure as % of GDP;
ESA2010(a) for GDP) 204
II.A6.5. Results of the high enrolment rate scenario (public education expenditure as %
of GDP; ESA2010(a) for GDP) 204
II.A6.6. Total expenditure on education-to-GDP ratio - COFOG and UOE - (ESA2010) 205
LIST OF GRAPHS
0.1. Population and employment developments, EU (million) 3
0.2. Strictly and total age-related expenditure in the EU Member States, 2013-60, pp.
of GDP 4
0.3. Components of total age-related expenditure, 2013 and 2060, % of GDP 5
0.4. Public pension benefit ratio, change 2013-2060, pp. change 6
0.5. Total age-related expenditure under different scenarios, 2013-2060, pp. of GDP 7 0.6. Projected change in total age-related and pension expenditure (baseline)
compared, 2012 and 2015 AR, 2013-60, pp. of GDP 8
I.1.1. Projection of total fertility rates in EUROPOP2013 (number of births per woman) 15
I.1.3. Life expectancy at birth, men (in years) 16
I.1.4. Life expectancy at birth, women (in years) 16
I.1.5. Projection of life expectancy at birth in EUROPOP2013, men (in years) 16
I.1.6. Projection of life expectancy at birth in EUROPOP2013, women (in years) 16
I.1.7. Projection of life expectancy at 65 in EUROPOP2013, men (in years) 16
I.1.8. Projection of life expectancy at 65 in EUROPOP2013, women (in years) 16
I.1.9. Net migration flows 1961-2060 17
I.1.10. Projection of net migration flows in EUROPOP2013 over the period 2013-2060
cumulated as a percentage of the population in 2013 19
I.1.11. Population pyramids (in thousands), EU and EA, in 2013 and 2060 20
I.1.12. Projection of the total population (percentage and absolute change for the
period 2013-2060) 21
I.1.13. Projected change of main population groups (in % change over the period
2013-2060) 23
I.1.14. Dependency ratios (in percentage) 24
I.1.15. Projection of changes in the structure of the EU population by main age groups
(in %) 25
I.1.17. Old age dependency ratio (people aged 65 or above relative to the working-age population) by main geographic areas and selected countries (in
percentage), 1950, 2010, 2060, 2100 29
I.2.1. Impact of pension reforms (1) on the average effective retirement age from the
labour force (2) 31
I.2.5. Unemployment rate assumptions (age 15-64, in percentage) (1) 35
I.2.6. Employment rates for the age group 20 to 64 (in percentage) (1) 36
I.2.7. Employment growth rates for the age group 20 to 64 (average annual values)
(1) 37
I.2.8. Employment projections, breakdown by age groups 38
I.2.9. Effective economic old age dependency ratio - inactive population aged 65
and more over employment (20-74) – (1) 39
I.2.10. Total economic dependency ratio - total inactive population over employment
(20-74) – (1) 40
I.2.11. Potential growth rates (annual average growth rates), EU aggregates 40
I.2.12. Potential GDP per capita growth rates (period averages) (1) 41
I.2.13. Labour productivity per hour, annual average growth rates 41
I.2.14. Actual and potential GDP growth, annual average growth rates 2013-2023 (1) 42
I.2.15. Hours worked (average annual growth rate) 15-74 (1) 43
I.2.16. Labour input (total hours worked), annual average growth rates 43
I.2.17. Determinants of labour productivity: total factor productivity and capital
deepening (pp contributions for the annual growth rate in the period 2013-2060) 44 I.2.18. Potential growth rates in the European Union (average annual values,
2013-2060) 44
I.3.1. Potential GDP growth rates (five years centred moving average) - European
Union 49
I.3.2. Potential growth rates in the European Union (average annual values,
2013-2060) 50
I.3.3. Labour input by country grouping (average annual rates, 2013-2060) 51
I.3.4. Labour productivity per hour (annual average growth rates, 2013-2060) 51
II.1.1. Increase in the average effective exit age from the labour market versus shift in
duration of retirement over the period 2013 – 2060 - MEN 68
II.1.2. Increase in the average effective exit age from the labour market versus shift in
duration of retirement over the period 2013 – 2060 - WOMEN 68
II.1.3. Contributions to the public pension system decomposition between 2013 and
II.1.4. Change in gross public pension expenditure between 2013 and 2060 in the
baseline scenario (in p.p. of GDP) 74
II.1.5. Change in gross public pension expenditure over the period 2013-2060 by main
general schemes (in p.p. of GDP) 76
II.1.6. Change in gross public pension expenditure over the period 2013-2060 (in p.p.
of GDP) 78
II.1.7. Gross public pension expenditure over the period 2007-2060 in selected
countries (% of GDP) 79
II.1.8. Evolution of the share of public pensioners for age group -54 between 2013 and
2060 (% of total public pensioners) 80
II.1.9. Evolution of the share of public pensioners for age group 60-64 between 2013
and 2060 (% of total public pensioners) 80
II.1.10. Evolution of the share of public pensioners for age group 70-74 between 2013
and 2060 (% of total public pensioners) 80
II.1.11. Evolution of the share of public pensioners for age group 55-59 between 2013
and 2060 (% of total public pensioners) 80
II.1.12. Evolution of the share of public pensioners for age group 65-69 between 2013
and 2060 (% of total public pensioners) 80
II.1.13. Evolution of the share of public pensioners for age group 75+ between 2013 and
2060 (% of total public pensioners) 80
II.1.14. Gross versus net public pension expenditure in 2013 and 2060 (% of GDP) 82 II.1.15. Expenditure for private occupational and individual pension schemes in 2013
and 2060 (% of GDP) 83
II.1.16. Contributions to private occupational and individual pension schemes in 2013
and 2060 (% of GDP) 83
II.1.17. Decomposition of public pension expenditure to GDP 87
II.1.18. Impact of an increase of life expectancy on gross public pension expenditure
change over 2013-2060 (deviation from baseline change, p.p. of GDP) 100
II.1.19. Impact of lower migration on gross public pension expenditure change over
2013-2060 (deviation from baseline change, p.p. of GDP) 100
II.1.20. Impact of a higher employment rate of older workers on gross public pension expenditure change over 2013-2060 (deviation from baseline change, p.p. of
GDP) 101
II.1.21. Impact of a higher employment rate on gross public pension expenditure
change over 2013-2060 (deviation from baseline change, p.p. of GDP) 101
II.1.22. Impact of higher / lower labour productivity growth on gross public pension expenditure change over 2013-2060 (deviation from baseline change, p.p. of
GDP) 102
II.1.23. Impact of lower TFP growth on gross public pension expenditure change over
2013-2060 (deviation from baseline change, p.p. of GDP) 102
II.1.24. Impact of linking retirement age to life expectancy on gross public pension expenditure change over 2013-2060 (deviation from baseline change, p.p. of
GDP) 103
II.1.25. Benefit ratio and average pensions in the policy scenario compared to the
baseline at the EU aggregate level 103
II.1.26. Benefit ratio in the policy scenario compared to the baseline in 2060 (%) 103 II.1.27. Change in gross public pension expenditure (2013-2060) compared: 2012
Ageing Report* and current projection round (in p.p. of GDP) 105
II.1.28. Revision of the dependency ratio and of the change in gross public pension expenditure ratio (over 2013-2060), between AR 2012 and AR 2015 (in p.p. of
II.1.29. Revision of the benefit ratio and of the change on gross public pension expenditure ratio (over 20163-2060), between AR 2012 and AR 2015 (in p.p. of
GDP) 109
II.2.1. Age-related expenditure profiles of health care provision (spending per capita
as % of GDP per capita) 118
II.2.2. Projected increase in public expenditure on health care due to demographic
change over 2013-2060, as % of GDP 127
II.2.3. Impact of demography and health status - Comparison between scenarios in
EU15 and NMS 131
II.2.4. Age-gender expenditure profiles and population changes in the 2015 and 2012
Ageing Reports 138
II.2.5. Range of results from different scenarios on health care in EU28 140
II.2.6. Range of results from different scenarios on health care in EU15 and NMS 141
II.3.1. Total and public long-term care expenditure in the EU, as % GDP 142
II.3.2. Total (public) expenditure on long-term care in the EU, as a share of total
(public) current health expenditure 142
II.3.3. Age-related coverage of dependent population by type of care provided in
the EU, as % of population. 143
II.3.4. Institutional care: Expenditure per recipient of long-term care services in
institutional care, as % of GDP per capita 143
II.3.5. Home care: Expenditure per recipient of long-term care services in home care,
as % of GDP per capita 144
II.3.6. Cash benefits: Expenditure per recipient of long-term care cash benefits care,
as % of GDP per capita 144
II.3.7. Country-specific coverage rates of long-term care recipients, as % of
dependent population 146
II.3.8. Schematic presentation of the projection methodology 149
II.3.9. Demographic scenario, current and projected levels of public expenditure on
LTC as % of GDP; 2013-2060 153
II.3.10. Impact of LTC reform in the Netherlands on projected levels of LTC spending, in
% of GDP 153
II.3.11. AWG reference scenario: Differences in the projected increase in public expenditure on long-term care over 2013-2060 between the 2015 and 2012
Ageing Report, as pp. of GDP 162
II.3.12. Projected expenditure in different LTC scenarios, for the EU in % of GDP 164 II.3.13. Projected expenditure in LTC AWG reference and risk scenarios, for the EU in %
of GDP 164
II.3.14. Range of results for scenarios with mainly demographic sensitivity analysis (no
policy change scenarios), EU in % of GDP 165
II.3.15. Range of results for scenarios with mainly cost and coverage sensitivity analysis
(policy change scenarios), EU in % of GDP 165
II.4.1. Students-to-teacher ratio across ISCED levels (average values 2010-2011) 167 II.4.2. Average compensation per member of staff as ratio of GDP per worker
(average values of 2010-2011) 168
II.4.3. Structure of public expenditure on education as % of GDP (average values of
2010-2011) 168
II.4.4. Changes in government expenditure by ISCED level between 2013 and 2060;
ESA2010 for GDP(a) - baseline scenario - 170
II.4.5. Demographic structure as the main driver of education expenditure (2060 index
values, 2013=100) 172
II.5.1. Changes in the UB-to-GDP ratio versus changes in the UR (2060-2013) 177
II.A2.1. Impact of lower migration on gross public pension expenditure change
II.A4.1. Expenditure profiles of long-term care services by age and gender in the EU15, spending per recipient as % of GDP per capita and comparing 2015 and 2012
Ageing Reports 191
II.A4.2. Expenditure profiles of long-term care recipients in the New Member States, spending per recipient as % of GDP per capita and comparing 2015 and 2012
Ageing Reports 191
II.A4.3. Country-specific long-term care expenditure profiles by type of care, age and
gender, as % of GDP per capita. 193
II.A4.4. Age-specific long-term care coverage rates (in-kind and cash benefits) by age
groups in % of disabled 194
II.A5.1. Long-term care model structure 197
LIST OF BOXES
I.1.1. Net migration assumptions in the EUROPOP2013 projections 18
II.1.1. Automatic balancing mechanisms, sustainability factors and links to life
expectancy in pension systems 61
II.1.2. Decomposition of pension expenditure to GDP 85
II.1.3. Comparing 2012 AR and 2015 AR projections 107
II.2.1. Public health care expenditure through the last decades 114
II.2.2. Income elasticity of health care demand, a short literature survey 117
long-term budgetary projections by 2015, on the basis of a new population projection by Eurostat (EUROPOP2013).
In light of this mandate, the EPC and the Commission services (Directorate-General for Economic and Financial Affairs - DG ECFIN) agreed on a work programme with broad arrangements to organise the budgetary projections and reach agreement on its assumptions and methodologies.
With this release, the long-run economic and budgetary projections aimed at assessing the impact of ageing population have been published five times; the first report being released in 2001. This projection exercise updates and improves methodologically further the previous exercises so as to enhance overall accuracy, comparability across countries, consistency across expenditure items and the economic basis for the underlying assumptions. On the basis of these underlying demographic and macro-economic assumptions and projections, age-related expenditures covering pensions, health care, long-term care, education and unemployment benefits are projected and analysed.
The projections feed into a variety of policy debates at EU level, (1) including the overarching Europe 2020 strategy for smart, sustainable and inclusive growth. In particular, they are used in the context of the European Semester so as to identify policy challenges, in the annual assessment of the sustainability of public finances carried out as part of the Stability and Growth Pact and in the analysis on the impact of ageing populations on the labour market and potential economic growth.
This report is structured in two parts. The first one describes the underlying assumptions: the population projection, the labour force projection and the macroeconomic assumptions used. The second part presents the long-term budgetary projections on pensions, health care, long-term care, education and unemployment benefits. Statistical annexes give an overview of the projection results by area and by country.
Coverage and overview of the 2015 long-term projection exercise
The economic and budgetary projections have been made by applying commonly agreed assumptions and methodologies uniformly to all Member States, as agreed by the EPC.
The starting point is the EUROPOP2013 population projection for the period 2013 to 2060 (see the Chart below). The EPC agreed upon a common set of assumptions and methodologies in order to make projections on a set of exogenous macroeconomic variables on the basis of proposals prepared by DG ECFIN, covering the labour force (participation, employment and unemployment rates), labour productivity and the real interest rate. These combined set of projections enabled the calculation of GDP for all Member States up to 2060. The macroeconomic assumptions on which this report is based were agreed in the first half of 2014 and published in November 2014; (2) the latest macroeconomic developments may thus not be fully captured.
On the basis of these assumptions, separate budgetary projections were carried out for five government expenditure items. The projections for pensions were run by the Member States using their own national
(1) Ireland has reservations around the population projections driving these figures. Whilst an exception for the basis of population
projections was endorsed by EPC on April 1st for future t+10 projection exercises, the impact of this agreement is not reflected
in AR15 spending projections.
(2) See European Commission and Economic Policy Committee (2014) "2015 Ageing Report: Underlying assumptions and
model(s), reflecting current pension legislation. (3) In this way, the projections benefit from capturing the country-specific circumstances prevailing in the different Member States as a result of different pension legislation, while at the same time consistency is ensured by basing the projections on commonly agreed underlying assumptions. The projections for health care, long-term care, education and unemployment were run by the European Commission (DG ECFIN), on the basis of a common projection model for each expenditure item, taking into account country-specific settings, where appropriate. The results of this set of projections are aggregated to provide an overall projection of age-related public expenditures.
(3) In order to ensure high quality and comparability of the pension projection results, an in-depth peer review was carried out by
the AWG and the Commission at four meetings during September-December 2014. The projections incorporate pension legislation in place at that time. No further reform measures has been legislated in EU Member States by 1 April 2015 (except Portugal, see the Note to Table II.1.4).
The demographic trends projected over the long term reveal that Europe is ‘turning increasingly grey’ in the coming decades. The Commission, as well as the European Council, have already recognised the need to tackle resolutely the impact of ageing populations on the European Social Models.
Having reliable and comparable information on the challenges of the future demographic changes in Europe entails considering the age-structure of the population today, and how it could look like in coming decades. This sheds light on the economic, budgetary and societal challenges that policy makers will have to face in the future. The long-term projections provide an indication of the timing and scale of challenges that would result from an ageing population. They show where, when, and to what extent, ageing pressures will accelerate as the baby-boom generation retires and the average life-span continues to increase. Hence, the projections are helpful in highlighting the immediate and future policy challenges posed for EU countries by demographic trends.
Due to the dynamics in fertility, life expectancy and migration, the age structure of the EU population will change strongly in the coming decades. The overall size of the population is projected to be slightly larger by 2060 but much older than it is now. (4) The EU population is projected to increase (from 507 million in 2013) up to 2050 by almost 5%, when it will peak (at 526 million) and will thereafter decline slowly (to 523 million in 2060). This increase would however not be the case without the projected inward migration flows to the EU. There are wide differences in population trends until 2060 across Member States. While the EU population as a whole would be larger in 2060 compared to 2013, decreases of the total population are projected for about half of the EU Member States (BG, DE, EE, EL, ES, HR, LV, LT, HU, PL, PT, RO, SI and SK). For the other Member States (BE, CZ, DK, IE, FR, IT, CY, LU, MT, NL, AT, FI, SE and UK) an increase is projected.
In terms of drivers of the population changes, total fertility rates are projected to rise for the EU as a whole, though remaining below the natural replacement rate. At the same time, the projections show large and sustained increases in life expectancy at birth. In the EU, life expectancy at birth for males is expected to increase by 7.1 years over the projection period, reaching 84.8 in 2060. For females, it is projected to increase by 6.0 years, reaching 89.1 in 2060. Net migration inflows to the EU are projected to continue; first increasing to 1,364,000 by 2040, and thereafter declining to 1,037,000 people by 2060.
The demographic old-age dependency ratio set to nearly double over the long-term
As a result of these different trends among age-groups, the demographic old-age dependency ratio (people aged 65 or above relative to those aged 15-64) is projected to increase from 27.8% to 50.1% in the EU as a whole over the projection period. This implies that the EU would move from having four working-age people for every person aged over 65 years to about two working-age persons.
Labour force projections: Projected increases in overall participation rates, and in particular for older workers on account of implemented pension reforms…
Based on a cohort simulation model, labour force projections show a rise in overall participation rates, particularly visible for ages 50+, reflecting the combined effect of the rising attachment of younger generations of women to the labour market, together with the expected impact of pension reforms. By large, the biggest increases in participation rates are projected for older workers (around 21 pp. for women and 10 pp. for men) in the EU for the age group 55-64, influenced by enacted pension reforms. (5) Consequently, the gender gap is projected to narrow substantially in the period up to 2060. The total
(4) Eurostat's population projection (EUROPOP2013) was published on 28 March 2014.
European Commission
The 2015 Ageing Report: Economic and budgetary projections for the EU28 Member States (2013-2060)
participation rate (for the age group 20-64) in the EU is projected to increase by 3.5 pp. (from 76.5% in 2013 to 80.1% in 2060). In the same period, women's participation rate is projected to increase by about 6 pp. compared with 1 pp. for men.
… but labour supply will decline because of the projected population trends
Total labour supply in the EU (and in the euro area) is projected to nearly stabilise between 2013 and 2023 (age group 20-64), while it is projected to decline by 8.2% between 2023 and 2060, representing roughly minus 19 million people. In the euro area, the projected fall in labour supply between 2023 and 2060 is 9.2%, equivalent to about 14 million people.
Further rises in employment rates projected…
Given the population projection, the labour force projection and the unemployment rate assumptions, (6) the total employment rate (for persons aged 20 to 64) in the EU is projected to increase from 68.4% in 2013 to 72.2% in 2023 and 75% in 2060. In the euro area, a similar development is expected, with the employment rate attaining 74.7% in 2060.
… but the number of employed would diminish
The projections show that employment (aged 20-64) will peak at 215 million in 2022, and after that fall to 202 million in 2060. This implies a decline of about 9 million workers over the period 2013 to 2060. The negative prospects stemming from the rapid ageing of the population, will only be partly offset by the increase in (female and older workers) participation rates migration inflows and the assumed decline in structural unemployment, leading to a reduction in the number of people employed during the period 2023 to 2060 (13 million).
Demographic developments have a major impact on labour market developments. Three distinct periods can be observed for the EU as a whole (see Graph 1):
• 2007-2011 – demographic developments still supportive of growth: the working-age population is growing, but employment is sluggish as the financial and economic crisis weighs on labour prospects during this period.
• 2012-2022– rising employment rates offset the decline in the age population: the working-age population starts to decline as the baby-boom generation enters retirement. However, the assumed reduction in unemployment rates, the projected increase in the employment rates of women and older workers cushion the impact of demographic change, and the overall number of persons employed would start to increase during this period.
• From 2023 – the population ageing effect dominates: the projected increase in employment rates is slower, as trend increases in female employment and the impact of pension reforms will be less pronounced. Hence, both the working-age population and the number of persons employed start falling over the remainder of the period.
(6) Starting from current historically high levels, a reduction in the EU unemployment rate of around 4 ¼ percentage points is
projected over the long-term (to 6 ½% in 2060). A slightly larger fall of 5 ¼ pp. is projected for the euro area of (to 6 ¾% in 2060).
Graph 1: Population and employment developments, EU (million)
Source: Commission services, EUROPOP 2013, EPC.
Macro-economic assumptions: Potential GDP growth projected to remain quite stable over the long-term
In the EU as a whole, the annual average potential GDP growth rate in the baseline scenario is projected to remain quite stable over the long-term, albeit much lower than in previous decades. The assumption of convergence to a TFP growth rate of 1% entails for most countries that it would rise over the coming decades from the current historically low levels, and this will more than compensate for the declining labour growth from 2023 onwards. As a result, after an average potential growth of 1.1% up to 2020, a slight increase to 1.4-1.5% is projected for the remainder of the projection horizon. Over the whole period 2013-2060, average potential GDP growth rates in the EU is projected to be 1.4%. Developments in the euro area are very close to that of the EU as a whole and the potential growth rate in the euro area (averaging 1.3%) is projected to be slightly lower than for the EU throughout the projection period. The sources of GDP growth will alter dramatically over the projection horizon. Labour will make a positive contribution to growth in both the EU and the euro area up to the 2020s, but turn negative thereafter. For the EU and for the euro area, a slight increase in the size of the total population over the entire projection period and an assumed increase of employment rates make a positive contribution to average potential GDP growth. However, this is more than offset by a decline in the share of the working-age population, which is a negative influence on growth (by an annual averworking-age of -0.2 percentworking-age points). As a result, labour input contributes negatively to output growth on average over the projection period (by 0.1 pp. in the EU and in the euro area). Hence, labour productivity growth, driven by TFP growth, is projected to be the sole source of potential output growth in both the EU and the euro area over the entire projection period. 60 62 64 66 68 70 72 74 76 190 210 230 250 270 290 310 200 7 201 0 201 3 201 6 201 9 202 2 202 5 202 8 203 1 203 4 203 7 204 0 204 3 204 6 204 9 205 2 205 5 205 8
working-age population (20-64) total employment (20-64) employment rate (20-64) until 2011: sluggish employment and slow growth in working-age population 2012-2022: rising employment, declining working-age from 2023 onwards:
both employment and working-age population decline
European Commission
The 2015 Ageing Report: Economic and budgetary projections for the EU28 Member States (2013-2060)
Budgetary projections: population ageing put upward pressure on public spending
The long-term budgetary projections show that population ageing poses a challenge for the public finances in the EU. The fiscal impact of ageing is projected to be high in most Member States, with effects becoming apparent already during the next decade.
The projected change in strictly public age-related expenditure (pensions, (7) health care, long-term care and education) is almost 2 pp. of GDP in the period to 2060 (EU: +1.8 pp., EA: +1.9 pp.) between 2013 and 2060 in the baseline scenario (see Graph 2 and Table 1). (8) Looking at the components of strictly age-related expenditure, the increase between 2013 and 2060 is mostly driven by health care and long-term care spending, which combined is projected to rise by about 2 pp. of GDP (Health care: +0.9 pp., Long-term care: +1.1 pp.). After a projected increase up to 2040 (EU: +0.4 pp., EA: +0.8 pp.), public pension expenditure is projected to return close to its 2013 level (EU: -0.2 pp., EA 0 pp. over the period 2013-2060). However, the projected decline in pension spending is mostly visible in the latter part of the projection horizon. Education expenditure is projected to remain unchanged up to 2060.
The projected change in total age-related expenditure is lower, since unemployment benefit expenditure is projected to fall in the period to 2060 (by 0.4 pp. of GDP in the EU). For the EU as a whole, the projected increase in total age-related expenditure is 1.4 pp. of GDP in the baseline scenario (EA: +1.5 pp. of GDP) (see Graph 3 and Table 1).
Graph 2: Strictly and total age-related expenditure in the EU Member States, 2013-60, pp. of GDP
Source: Commission services, EPC.
There is however considerable variety across EU Member States and also in the profile over time in the long-term spending trends (see Graph 3 and Table 1). According to the projections:
• A fall in total age-related expenditure relative to GDP is projected in eight Member States (HR, EL, LV, FR, DK, CY, IT and ES). In all of these countries, a decline in the pension-to-GDP ratio is projected in the long-term (exceeding 3 pp. of GDP in HR, DK and LV).
• For another set of countries (BG, PT, EE, SE, HU, PL, IE, RO, LT and UK), age-related expenditure ratio is expected to rise moderately (by up to 2.5 pp. of GDP).
• The age-related expenditure ratio increase is projected to be the largest in the remaining ten Member States (FI, AT, CZ, NL, SK, DE, BE, LU, MT and SI), rising by between 2.5 pp. and 6.8 pp. of GDP
(7) Public pension expenditure include all public expenditure on pension and equivalent cash benefits granted for a long period,
including disability benefits and social assistance benefits for older people, see Annex 2 for details on the coverage of the projections of public pension expenditure.
(8) As in previous long-term projection exercises, the baseline scenario focuses on the budgetary impact mostly due to
demographic developments. -4.0 -2.0 0.0 2.0 4.0 6.0 8.0 10.0
Total age-related expenditure Baseline scenario
AWG Risk scenario TFP risk scenario -4.0 -2.0 0.0 2.0 4.0 6.0 8.0 10.0
Strictly age-related expenditure Baseline scenario
AWG Risk scenario TFP risk scenario
and with pension expenditure increasing in all of these countries (exceeding 3 pp. of GDP in BE, LU, MT and SI).
Graph 3: Components of total age-related expenditure, 2013 and 2060, % of GDP
Source: Commission services, EPC.
The large differences between Member States reflect primarily the diversity in public pension arrangements, their degree of maturity and the effects of pension reforms enacted so far. (9) In fact, a reduction of public pension spending as a share of GDP over the long-term is projected in the majority (15) of Member States (HR, DK, LV, FR, IT, EL, SE, EE, ES, PT, PL, BG, RO, CY and HU), mostly as a result of implemented pension reforms. These reform measures, including changes to the retirement age and the pension benefit, have primarily been adopted to address fiscal sustainability concerns of pension systems.
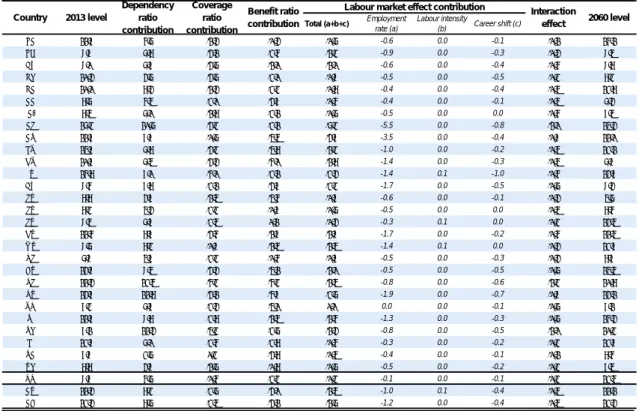
The pension projections rely on unchanged pension legislation, and risks exist. If pensions are being perceived as being 'too low' or the retirement age 'too high', this could eventually result in changes in pension policies, leading to upward pressure on pension spending, and the projections could thus underestimate future government expenditure. For example, the public pension benefit ratio (i.e. average pensions in relation to average wages) is projected to fall in all Member States (except Luxembourg) in the period to 2060, on average by 9 pp. in the EU and in some countries (CY, PT and ES) by up to 20 pp. (see Graph 4). Consequently, the benefit ratio at the end of the forecasting period is generally low. Even including private pensions, the benefit ratio in 2060 settle above 50 percent in only five countries (DK, EL, IT, LU, NL) while it falls below 30 percent in some other cases (BG, EE, HR, LV, PL, RO). Another upward risk is related to the projected decrease of the coverage ratio (i.e. the number of pensioners as percent of population aged 65 or more) in some countries, where a large increase of the legal retirement age is legislated. On the other hand, if countries enact additional expenditure-reducing pension reforms (currently being discussed in some countries), the projected expenditures could be overestimated.
(9) See footnote 3. 0.0 5.0 10.0 15.0 20.0 25.0 30.0 35.0 40.0 20 1 3 20 6 0 20 1 3 20 6 0 20 1 3 20 6 0 20 1 3 20 6 0 20 1 3 20 6 0 20 1 3 20 6 0 20 1 3 20 6 0 20 1 3 20 6 0 20 1 3 20 6 0 20 1 3 20 6 0 20 1 3 20 6 0 20 1 3 20 6 0 20 1 3 20 6 0 20 1 3 20 6 0 20 1 3 20 6 0 20 1 3 20 6 0 20 1 3 20 6 0 20 1 3 20 6 0 20 1 3 20 6 0 20 1 3 20 6 0 20 1 3 20 6 0 20 1 3 20 6 0 20 1 3 20 6 0 20 1 3 20 6 0 20 1 3 20 6 0 20 1 3 20 6 0 20 1 3 20 6 0 20 1 3 20 6 0 20 1 3 20 6 0 20 1 3 20 6 0 20 1 3 20 6 0 LV RO EE BG HR LT CY HU SK CZ PL IE UK ES LU SE EL EU IT PT EA DK NL DE MT FR AT SI BE FI NO Unemployment benefits Education Long-term care Health care Pensions
European Commission
The 2015 Ageing Report: Economic and budgetary projections for the EU28 Member States (2013-2060)
Graph 4: Public pension benefit ratio, change 2013-2060, pp. change
Source: Commission services, EPC.
Risk scenarios
As noted above, there is considerable uncertainty as to future developments of age-related public expenditure. In order to provide a comprehensive assessment of the impact on government expenditure of changing the assumptions, the budgetary projections were also run with alternative scenarios, e.g. the risk scenarios. Two risk scenarios were therefore carried out, defined as follows:
• TFP risk scenario: In light of the trend decline in TFP growth performance over the last decades in the EU, due visibility and prominence should also be given to the risk of lower TFP growth in the future. Thus, a TFP risk scenario is included, with a lower TFP growth rate (0.8%). The TFP risk scenario essentially shows that GDP growth could be much lower in the event that future TFP growth rates developed less dynamically than in the baseline scenario, i.e. more in line with the growth rate (0.8%) observed over the last 20 years. In overall potential GDP terms, it would grow by 1.2% on average up to 2060, as opposed to 1.4% in the baseline scenario. In the euro area, it would be even lower, growing by 1.1% on average. In terms of GDP per capita levels, it would be 10% lower in the TFP risk scenario compared with the baseline by 2060 in the EU.
• AWG risk scenario: Non-demographic driver may exercise an upward push on costs in the health care and long-term care areas. In order to gain further insights into the possible importance of such developments, another set of projections were run which assumes the partial continuation of recently observed trends in health care expenditure due to, e.g. technological progress. Moreover, an upward convergence of coverage and costs to the EU average is assumed to take place in long-term care.
-25.0 -20.0 -15.0 -10.0 -5.0 0.0 5.0 CY PT ES PL SE LV EL RO HR SK FR EE NO EA EU HU FI IT DK DE BG MT AT SI CZ UK LT IE NL BE LU
Pension benefit ratio
Graph 5: Total age-related expenditure under different scenarios, 2013-2060, pp. of GDP
Source: Commission services, EPC.
The TFP risk scenario primarily affects pension expenditure, projected to rise by ½ pp. of GDP more on average (EU and EA) up to 2060 compared with the baseline scenario. This is because pensions in payments are on average projected to rise in line with inflation, i.e. slower than wages (which evolve in line with labour productivity growth, which in turn depends on TFP growth). By contrast, it only has a small impact on health care and long-term care, as unit costs in these areas are closely linked to labour productivity growth and hence with wage growth. The projected increase in total age-related expenditure would be about 1/3 pp. of GDP higher than the baseline scenario up to 2060 in the EU and EA (see Graph 5 and Table 2).
The AWG risk scenario has strong impact on health care and long-term care expenditure. The projected increase in total age-related expenditure would be 2.1 pp. of GDP higher than the baseline scenario up to 2060 for both the EU as a whole and the EA. It would entail an increase over the entire projection horizon of 3.4 pp. in the EU and of 3.5 pp. in the EA. However, in both risk scenarios, the EU aggregates mask conservable variety and the expenditure projections are very different across Member States (see Graph 5 and Table 3).
A lower projected increase in age-related spending in the current projections than in the 2012 Ageing Report
Compared with the projections in the 2012 Ageing Report, (10) total age-related public expenditure according to the baseline scenario is now projected to rise less in all countries except Spain, Latvia and Portugal over the entire projection horizon. This is mostly due to less pronounced increases in pension expenditure over the long-term (see Graph 6). This reflects not only the impact of pension reforms, but also a less pronounced population ageing effect in the EU, according to the EUROPOP2013 demographic projection. (11)
Over the period 2013-2060, the increase in the EU is 1 ½ pp. of GDP and in the EU and EA, compared with a projected increase of 3 ½ pp. of GDP in the 2012 Ageing Report (see Graph 6). The largest
(10) Pension reforms implemented and having been subject to a peer review by the EPC since the 2012 Ageing Report was
published are included in the 2012 AR projections in Graph 6.
(11) A lower increase in the old age dependency ratio (aged 65 or more/aged 20-64) over the period 2013-2060 in the EU as a whole
and in all countries except EL, PT, SK, UK projected in EUROPOP2013 compared with EUROPOP2010. 0.0 2.5 5.0 7.5 10.0 12.5 15.0 17.5 20.0 22.5 25.0 27.5 30.0 32.5 2013 2060 - AWG reference scenario 2060 - TFP risk scenario 2060 - AWG risk scenario 2013 2060 - AWG reference scenario 2060 - TFP risk scenario 2060 - AWG risk scenario
European Union Euro Area
Unemployment benefits Education Long-term care Health care Pensions
+3.4
+1.7 +1.5 +1.9 +3.5
(% of GDP)
European Commission
The 2015 Ageing Report: Economic and budgetary projections for the EU28 Member States (2013-2060)
downward revisions have occurred in Luxembourg, France, Greece, Romania, Denmark, Lithuania and Finland (more than 3 ½ pp. of GDP).
Graph 6: Projected change in total age-related and pension expenditure (baseline) compared, 2012 and 2015 AR, 2013-60, pp. of GDP
Source: Commission services, EPC.
BE BG CZ DK DE EE IE EL ES FR IT CY LV LT LU HU MT NL AT PL PT RO SI SK FI SE UK NO EUEA -4.0 -2.0 0.0 2.0 4.0 6.0 8.0 10.0 12.0 -4.0 -2.0 0.0 2.0 4.0 6.0 8.0 10.0 12.0
Total age-related expenditure
2012 AR
2015 A
R
Higher increase Lower increase
BE BG CZ DK DE EE IE EL ES FR IT CY LV LT LU HU MT NL AT PL PT RO SI SK FI SE UK NO EUEA -6.0 -4.0 -2.0 0.0 2.0 4.0 6.0 8.0 10.0 12.0 -6.0 -4.0 -2.0 0.0 2.0 4.0 6.0 8.0 10.0 12.0
Public pension expenditure
2012 AR
20
15 AR
Tab le 1: Ov ervi ew o f the 20 15 lo ng -term budg et ary pr oject ions – B as eline sc enario (1 ) SK : t he fig ures in th is ta bl e do no t in clud e pub li c exp endi tu re on ar me d for ces pe ns io n. T hey r ep res en te d 0. 4% of GD P i n 2 013, a nd are p ro jec te d to re ma in r oug hl y sta ble un til 20 60 . (2) The hea lth ca re a nd long-ter m care EU avera ge s are we ighte d acc or di ng to G D P. T he le ve l of hea lth ca re an d l ong-ter m care e xpendi tu res in 201 3 i s th e fi rs t y ear of pro jec ted exp endi tu res b ased on th e lat es t avai labl e da ta. H ealt h care ex pend it ure
excludes long-term nur
si ng car e. (3) An in-de pth peer rev ie w wa s car rie d o ut by t he AW G and t he C omm is si on at fo ur mee tin gs d uri ng S ept em ber-Dec emb er 20 14 . T he projec tions inc or porat e pe nsion legis lation in place a t tha t tim e. No fur ther refor m meas ure s h as bee n l egi sl ate d in E U Mem ber Sta te s b y 1 Ap ri l 2 01 5 (e xce pt Por tuga l, see t he No te to T abl e II. 1. 4). S ou rce: C omm issi on s er vi ce s, EPC. 2013 le ve l C H 20 13-40 CH 201 3-60 201 3 l ev el CH 201 3-40 C H 2 013-6 0 2013 le ve l CH 2013-4 0 CH 20 13-60 20 13 le ve l C H 20 13-40 CH 2013 -60 201 3 l ev el CH 2013 -40 C H 2013-6 0 2013 l ev el C H 2013-4 0 CH 20 13-60 20 13 l ev el C H 20 13-40 CH 2013 -60 BE 11.8 3. 4 3.3 6.0 0.1 0. 1 2. 1 0. 9 1. 6 5. 8 0. 2 0.3 25 .7 4.6 5. 3 1. 8 -0. 2 -0.2 27.5 4. 4 5.2 B E B G 9. 9 -1 .5 -0.4 4.0 0.4 0. 4 0. 4 0. 1 0. 2 3. 0 -0 .1 0.4 17. 3 -1.0 0. 5 0. 5 -0. 2 -0.2 17.8 -1 .3 0.3 BG CZ 9. 0 0. 0 0.7 5.7 0.7 1. 0 0. 7 0. 4 0. 7 3. 4 0. 3 0.7 18. 9 1.4 3. 1 0. 2 0. 0 0.0 19.1 1. 4 3.0 C Z D K 10.3 -2 .3 -3.1 8.1 0.8 0. 9 2. 4 1. 4 2. 0 7. 6 -0 .4 -0.7 28. 4 -0.5 -0. 9 1. 4 -0. 5 -0.5 29.8 -1 .0 -1.4 D K D E 10.0 2. 2 2.7 7.6 0.7 0. 6 1. 4 0. 9 1. 5 4. 1 0. 1 0.3 23. 1 3.9 5. 1 0. 8 0. 0 0.0 23.9 3. 9 5.0 D E EE 7. 6 -0 .7 -1.3 4.4 0.6 0. 6 0. 6 0. 4 0. 7 4. 4 0. 1 0.8 17 .0 0.3 0. 6 0. 2 0. 0 0.0 17.1 0. 3 0.6 E E IE 7.4 2.7 1. 1 6. 0 1. 3 1.2 0.7 0.4 0.7 6.0 -0 .7 0. 0 20 .0 3. 6 3.0 2.1 -1 .1 -1 .1 22 .1 2.5 1. 9 IE EL 16.2 -2 .1 -1.9 6.6 0.9 1. 3 0. 5 0. 2 0. 4 4. 1 -1 .4 -1.1 27. 4 -2.4 -1. 4 1. 2 -0. 9 -0.9 28.5 -3 .3 -2.3 E L ES 11.8 0. 1 -0.8 5.9 1.1 1. 1 1. 0 0. 6 1. 4 4. 6 -1 .4 -0.8 23. 2 0.4 0. 8 2. 2 -1. 7 -1.7 25.4 -1 .2 -0.8 E S F R 14.9 -1 .1 -2.8 7.7 0.9 0. 9 2. 0 0. 6 0. 8 5. 0 -0 .1 -0.2 29. 6 0.3 -1. 3 1. 5 -0. 4 -0.4 31.1 -0 .2 -1.7 F R HR 10.8 -3 .0 -3.9 5.7 1.6 1. 7 0. 4 0. 0 0. 1 3. 7 -0 .5 -0.4 20. 7 -1.9 -2. 5 0. 5 -0. 3 -0.3 21.2 -2 .2 -2.8 H R IT 15.7 0. 1 -1.9 6.1 0.6 0. 7 1. 8 0. 4 0. 9 3. 7 -0 .3 -0.2 27. 3 0.8 -0. 5 0. 9 -0. 3 -0.3 28.2 0. 4 -0.9 IT C Y 9. 5 -0 .1 -0.1 3.0 0.3 0. 3 0. 3 0. 2 0. 2 7. 3 -1 .9 -1.2 20. 0 -1.5 -0. 8 0. 8 -0. 6 -0.6 20.9 -2 .1 -1.4 C Y LV 7. 7 -2 .3 -3.1 3.8 0.6 0. 6 0. 6 0. 1 0. 1 3. 8 0. 0 0.8 15. 9 -1.5 -1. 6 0. 3 -0. 2 -0.2 16.2 -1 .7 -1.7 LV LT 7. 2 2. 2 0.3 4.2 0.5 0. 1 1. 4 0. 8 0. 9 3. 9 0. 3 0.9 16. 7 3.8 2. 2 0. 2 -0. 1 -0.1 16.9 3. 7 2.1 LT LU 9. 4 3. 3 4.1 4.6 0.2 0. 5 1. 5 0. 7 1. 7 3. 3 0. 1 0.2 18. 8 4.3 6. 4 0. 7 -0. 2 -0.2 19.5 4. 1 6.2 LU H U 11 .5 -1 .9 -0 .1 4. 7 0. 6 0.8 0.8 0.2 0.4 3.6 -0 .5 -0 .2 20 .5 -1 .6 0.9 0.3 -0 .1 -0 .1 20 .8 -1 .7 0. 8 H U M T 9. 6 0. 2 3.2 5.7 1.8 2. 1 1. 1 0. 9 1. 2 5. 9 -0 .4 0.1 22. 2 2.5 6. 6 0. 3 0. 0 0.0 22.6 2. 5 6.6 M T NL 6. 9 1. 5 0.9 7.2 1.0 1. 0 4. 1 1. 7 3. 0 5. 2 -0 .4 -0.5 23. 4 3.8 4. 4 2. 0 -0. 8 -0.8 25.4 3. 0 3.6 N L AT 13.9 0. 8 0.5 6.9 1.0 1. 3 1. 4 0. 6 1. 3 4. 9 -0 .1 0.0 27. 1 2.4 3. 1 0. 8 -0. 2 -0.2 27.9 2. 2 2.9 A T P L 11 .3 -1 .4 -0 .7 4. 2 0. 8 1.2 0.8 0.5 0.9 4.4 -0 .6 -0 .1 20 .7 -0 .6 1.3 0.2 -0 .1 -0 .1 20 .9 -0 .7 1. 3 PL PT 13.8 1. 0 -0.7 6.0 1.7 2. 5 0. 5 0. 2 0. 4 5. 2 -1 .2 -1.0 25. 5 1.8 1. 3 1. 5 -0. 9 -0.9 27.0 0. 8 0.3 P T RO 8. 2 0. 2 -0.1 3.8 0.8 1. 0 0. 7 0. 5 0. 9 2. 6 0. 2 0.4 15. 3 1.7 2. 1 0. 1 0. 0 0.0 15.5 1. 7 2.1 R O SI 11.8 2. 6 3.5 5.7 1.1 1. 2 1. 4 1. 0 1. 5 5. 3 0. 1 0.8 24 .2 4.7 7. 0 0. 6 -0. 2 -0.2 24.7 4. 5 6.8 S I SK 8. 1 0. 0 2.1 5.7 1.4 2. 0 0. 2 0. 2 0. 4 3. 4 -0 .6 -0.4 17. 4 1.0 4. 1 0. 2 -0. 1 -0.1 17.7 0. 9 4.0 S K FI 12.9 0. 7 0.1 7.8 0.7 0. 7 2. 4 1. 8 2. 1 6. 1 0. 2 0.3 29. 2 3.4 3. 2 1. 9 -0. 4 -0.4 31.2 3. 0 2.7 F I SE 8. 9 -1 .4 -1.4 6.9 0.4 0. 4 3. 6 1. 0 1. 5 5. 7 0. 2 0.2 25 .1 0.2 0. 7 0. 4 -0. 1 -0.1 25.5 0. 0 0.6 S E U K 7. 7 0. 8 0.7 7.8 1.0 1. 3 1. 2 0. 3 0. 4 5. 1 0. 0 0.0 21. 8 2.0 2. 4 0. 3 -0. 1 -0.1 22.1 1. 9 2.3 U K NO 9. 9 1. 5 2.5 7.5 0.6 0. 9 5. 8 2. 0 3. 6 6. 0 0. 0 -0.1 29. 2 4.1 6. 9 0. 4 0. 0 0.0 29.6 4. 1 6.9 N O EU 11.3 0. 4 -0.2 6.9 0.8 0. 9 1. 6 0. 7 1. 1 4. 7 -0 .2 0.0 24. 6 1.6 1. 8 1. 1 -0. 4 -0.4 25.6 1. 2 1.4 E U EA 12.3 0. 8 0.0 7.0 0.8 0. 8 1. 7 0. 7 1. 3 4. 5 -0 .3 -0.1 25. 5 2.0 1. 9 1. 3 -0. 5 -0.4 26.8 1. 6 1.5 E A A g e-related s p end in g , p e rcentage po in ts of G D P, 2013 -2060 A g ein g Re p o rt 2 015 - A W G re ference sce n ar io P e nsio ns Hea lth-car e L on g-ter m car e E du c a ti on S tr ictl y ag e -r e lated item s U n e m p lo y m ent ben e fi ts T o ta l ag e r e la te d i tem s