Automatic grading of Bi-colored apples by multispectral machine vision
Devrim Unaya, Bernard Gosselinb, Olivier Kleynenc, Vincent Leemansc, Marie-France Destainc, Olivier Debeird
a Electrical and Electronics Engineering Dept., Bahcesehir University, Ciragan Cd., 34353 Besiktas, Istanbul, Turkey b TCTS Lab., Faculté Polytechnique de Mons, Belgium
c Mechanics and Construction Dept., Gembloux Agricultural University, Belgium d Information and Decision Systems, Université Libre de Bruxelles, Belgium
ABSTRACT
In this paper we present a novel application work for grading of apple fruits by machine vision. Following precise segmentation of defects by minimal confusion with stem/calyx areas on multispectral images, statistical, textural and geometric features are extracted from the segmented area. Using these features, statistical and syntactical classifiers are trained for two- and multi-category grading of the fruits. Results showed that feature selection provided improved performance by retaining only the important features, and statistical classifiers outperformed their syntactical counterparts. Compared to the state-of-the-art, our two-category grading solution achieved better recognition rates (93.5% overall accuracy). In this work we further provided a more realistic multi-category grading solution, where different classification architectures are evaluated. Our observations showed that the single-classifier architecture is computationally less demanding, while the cascaded one is more accurate.
Keywords : Fruit grading ; Defect detection ; Multispectral images ; Feature extraction ; Feature selection ;
Classification
1. Introduction
Machine vision systems use dedicated hardware and software to perform quality inspection of produced goods such as semiconductor chips (Jiang et al., 2002) and ceramic tiles (Xie and Mirmehdi, 2006). Food industry is among top ten industries that widely uses machine vision (Cubero et al., 2010). In particular, inspection of apple fruits is problematic due to various defect types present as well as natural variability of fruit skin color.
Researchers used different sensing techniques like X-ray imaging (Diener et al., 1970; Shahin et al., 2002), hyperspectral imaging (Lu, 2003; Mehl et al., 2004; ElMasry et al., 2009; Sun, 2010) and spectral reflectance based methods (Upchurch et al., 1991 ; Geoola et al., 1994; Ariana et al., 2006; Peng and Lu, 2008) to grade apple fruit. However, majority of the works for this problem include systems based on visible/near infrared (NIR) imaging, which can be divided into two sub-groups: (1) those employing special equipment and (2) those using ordinary machine vision. In the former sub-group, researchers employed mechanical systems to control orientation of fruits (Davenel et al., 1988; Throop et al., 2005), particular illumination to assist grading (Crowe and Delwiche, 1996) or additional thermal cameras to ease defect segmentation (Cheng et al., 2003). The image acquisition system used in our study is an ordinary one in the sense that no such mechanical, optical or electronic equipment is employed. Therefore, we will not give further details on the works employing special equipment, but focus on those using ordinary machine vision.
From image processing point of view, apple varieties can be grouped into two: those having mono-colored skin (e.g. Golden Delicious, Granny Smith) and those having bi-colored skin (e.g. Jonagold, Fuji). Inspection of the latter group by image processing is more problematic because of color transition areas. Among the works that used ordinary machine vision for inspection of apples, Wen and Tao (1999) introduced a single-spectral system to grade bi-colored apples into two categories by rule-based decision. Their system was confused by stem/calyx areas and performed around 85-90%. Leemans et al. (2002) presented a machine vision system with color camera to grade apples into four categories based on European standards. They employed a quadratic
discriminant classifier (QDC) and a multi-layer perceptron (MLP) for classification, and achieved 78 and 72% classification accuracies for mono and bi-colored apples, respectively. Blasco et al. (2003) proposed a system
with color camera to grade mono-colored apples into three quality categories by thresholding and reached to 86% classification accuracy. Leemans and Destain (2004) graded bi-colored apples into two quality categories and reached to 73% accuracy by QDC. Kavdir and Guyer (2004) presented a single-spectral system with a B&W camera sensitive also at ranges higher than NIR. They performed grading of mono and bi-colored apples into two and five quality categories by Bayesian and nearest neighbor (k-NN) classifiers, a decision tree and a back-propagation neural network. Their system reached perfect grading for the two-category case, whereas accuracies dropped to 84-89% for five categories. Due to the image-level processing employed, this system is incapable of providing decisions relative to defect size. Kleynen et al. (2005) proposed a multispectral machine vision system to grade bi-colored apples into two quality categories by linear discriminant classifier (LDC) and accomplished 90% accuracy. Recently, Xiao-bo et al. (2010) used multiple color cameras to scan the surface of bi-colored apples, employed thresholding to automatically grade the fruits as normal or defective, and reached to 96% accuracy.
State-of-the-art works reviewed for quality grading of apple fruit by machine vision indicate that researchers proposed diverse solutions that differ at imaging technique utilized, particular equipment employed, apple varieties tested, quality categories taken and grading algorithms used. As a result, finding a common and relevant basis to compare and group these works in an appropriate taxonomy was extremely demanding. On the other hand, it is again this diversity that supports the following conclusion: "Quality grading of apple fruit by machine vision is a burdensome task due to the variance of the problem. Thus, the search for a robust, generic and accurate grading system that works for all apple varieties while respecting all norms of standards is still in progress."
In this paper we introduce a fruit grading system that extracts/selects several features from the defective skin (found by the defect segmentation and stem/calyx recognition systems), and classifies apples into corresponding quality categories by statistical and syntactical classifiers. Classification is first performed into two quality grades (healthy or defective), and then a more realistic and innovative classification is achieved by multi-category grading.
2. Methodology
A machine vision-based apple inspection system should first perform precise segmentation of defective skin and then achieve correct grading of apples into corresponding quality categories. Note that, defect segmentation includes accurate discrimination of defects from stem/calyx areas which resemble each other in image space. Such an approach is used in this work. Note that this article gives more emphasis on the fruit grading part of the problem. Hence, defect segmentation and stem/calyx recognition parts will only be briefly explained.
2.1. Image acquisition and the database
Database consists of images of 'Jonagold' apples taken from a diffusely illuminated environment by a high-resolution B&W camera with four interference band-pass filters (centered at 450, 500, 750 and 800 nm with respective bandwidths of 80, 40, 80 and 50 nm).
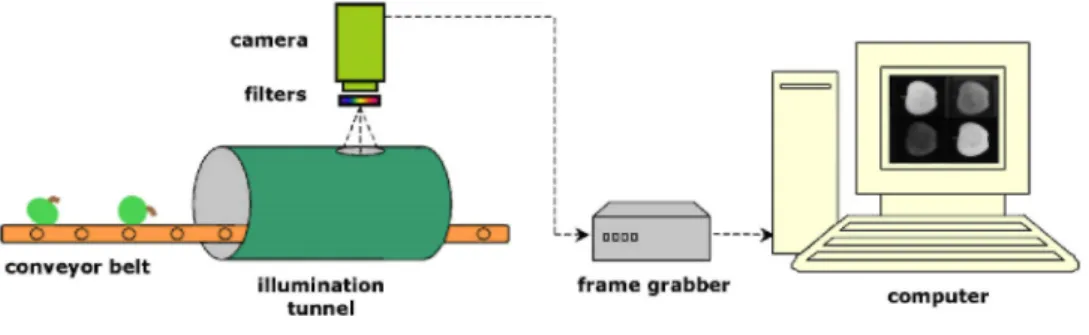
The filters are spatially arranged in a tiled manner, permitting the high-resolution camera to capture four filter images of 430 × 560 pixels at 8 bits-per-pixel resolution in a single image. Details of image acquisition and filter selection are available in Kleynen et al. (2003, 2005). Fig. 1 displays an illustration of the image acquisition system, which is capable of one-view inspection only. 280 of the fruits were healthy, while 246 of them included several skin defects (russet, bruise, rot, scald, hail damage, visible flesh damage, etc.) in varying size and shape. Note that, at image acquisition fruits are presented manually to the camera such that defects are in the center of the view. 'Jonagold' variety is selected instead of mono-colored ones, because it has a bi-colored skin causing more difficulties in defect segmentation due to color transition areas (Kleynen et al., 2005). In order to serve as reference, defective and stem/calyx areas of the apples within the database are manually segmented. Fig. 2 displays some examples from the database with their manual segmentations.
Fig. 1. Illustration of the image acquisition system used.
Fig. 2. Examples of apple images and their manual segmentations. First four columns present images from
different filters, while the last one shows corresponding manual segmentations. Rows display apples damaged by different defect types.
2.2. Automatic defect segmentation and stem/calyx recognition
Marketing standard of European Commission for apples (Anonymous, 2004) defines quality categories that require defect size information. Hence, it is essential to precisely segment defects, which is very problematic because defects highly vary in terms of type, size, color and texture. In this study, automatic segmentation of defects is achieved by sequential application of two previously introduced solutions. First, candidate defect regions are segmented through pixel-wise classification by a MLP-based method (Unay and Gosselin, 2006). Then, these segmentations are refined by excluding stem and calyx regions - natural parts of fruit that show similar spectral characteristics with some defects - found by a support vector machine (SVM) based method (Unay and Gosselin, 2007). More detailed explanations regarding these solutions can be found in Unay and Gosselin (2006, 2007).
2.3. Feature extraction
Segmentation result of a fruit may contain several unconnected objects (with different shape and size) as seen in Fig. 3. In order to provide a decision for the fruit, one can either handle each object separately or process them together. In the former case, it is intricate to reach a global decision about the fruit from individual decisions. Therefore, the latter approach is used here.
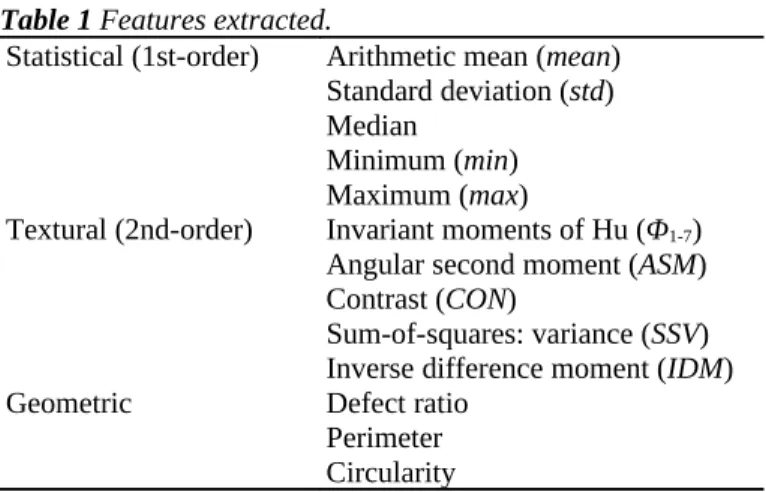
Features extracted from the segmented area of each fruit are summarized in Table 1. Statistical features (first-order spatial statistics) measure the probability of observing a gray-value at a randomly chosen location. These
features are selected to measure statistical characteristics of a distribution: arithmetic mean (mean) and median for central tendency, standard deviation (std) for dispersion (spread of values around central tendency),
minimum (min) and maximum (max) for extremes.
Table 1 Features extracted.
Statistical (1st-order) Arithmetic mean (mean) Standard deviation (std) Median
Minimum (min) Maximum (max)
Textural (2nd-order) Invariant moments of Hu (Φ1-7)
Angular second moment (ASM) Contrast (CON)
Sum-of-squares: variance (SSV) Inverse difference moment (IDM)
Geometric Defect ratio
Perimeter Circularity
Fig. 3. Examples of segmented defects: cropped and zoomed versions.
Statistical measures do not take relative relations of gray values into account (Tuceryan and Jain, 1998), whereas textural features (second-order spatial statistics) consider pixels in pairs and thus capture spatial dependence of gray values that contribute to perception of texture. Geometric moments of Hu (1962) are textural features that are widely used in pattern recognition. Seven invariant moments of Hu are used in this work (Φ1-Φ7), which are
invariant to translation, scale and rotation. Another popular group of textural features includes those of Haralick (1973), which are computed from gray-level co-occurrence matrices (GLCM). GLCM is a square matrix showing number of occurrences for gray-level pairs that are a distance d apart. We compute GLCM as the average of GLCM matrices using d = 1 at four orientations (45, 90, 135, 180°). Please note that we performed several tests by computing GLCM at various other distances and orientations, but the results were not superior than those of the above. Regarding features from GLCM, angular second moment (ASM) and inverse difference
moment (IDM) are related to homogeneity and smoothness, respectively, while contrast (CON) and sum-of-squares: variance (SSV) are estimates of local variations.
In addition, one can also use attributes based on geometry of objects for recognition. However, apple surface defects do not have distinctive, well-defined geometric characteristics. Therefore we employed the following simple geometric features: defect ratio (proportion of defective pixels over all pixels) provides information on relative defect size, perimeter (number of pixels in object perimeter) estimates length of object boundary and
circularity (square of perimeter-area ratio of object) measures degree of elongation of an object, thus it can
provide discrimination between elongated and compact defects.
Statistical and textural features are computed using each filter image, therefore for each fruit we measure 5 × 4 = 20 statistical and 11 × 4 = 44 textural features. Together with 3 geometric measures, feature set of a fruit consists of 67 attributes in total. Prior to grading, feature values are normalized to have a mean of 0 and standard
this specific application).
2.4. Feature selection
A subset of the 67 extracted features has to be selected because: (1) using all available features is computationally infeasible, and (2) irrelevant/redundant features add noise to the system and degrade its performance.
Therefore, we will use Sequential Floating Forward Selection (SFFS) of Pudil et al. (1994), which is a heuristic and greedy1 algorithm that starts with an empty feature subset. At each iteration, SFFS tentatively adds to the
feature subset one feature that is not already selected and tests the accuracy of classifier built on the tentative feature subset. The feature that results in the lowest classification error is definitely added to the subset. After each addition step SFFS removes any previously added feature if its removal decreases error. The process stops after a certain number of iterations provided by the user. Then the user determines the optimum features subset by examining the improvement in classification error with respect to features added at each iteration. Please note that, once the optimum features subset is determined, there is no need to repeat this feature selection step any more, unless a new training database is available or new features will be explored. Hence, this step does not limit automatization of our solution.
2.5. Grading
In order to classify fruits into quality categories, the following statistical and syntactical classifiers are used. • Linear discriminant classifier (LDC): LDC is a statistical classifier, which assumes that data is linearly separable and tries to find a linear decision boundary separating the data.
• Nearest neighbor classifier (k-NN): k-NN is a statistical classifier that focuses on similarity (proximity) of samples measured by a distance metric. It assigns data to the most represented category within its closest k neighbors.
• Fuzzy nearest neighbor classifier (fuzzy k-NN): While assigning a new sample, k-NN gives equal importance to the k nearest samples by assuming that they are equidistant from the new sample. Fuzzy k-NN (statistical classifier) rejects this assumption and benefits also from distance information of neighbors.
• Support vector machines (SVM): Another statistical classifier is SVM, which first nonlinearly maps data to a high-dimensional space by kernels and then tries to find the hyperplane that separates data with maximum
margin in that new space (Burges, 1998; Vapnik, 1998). Originally proposed for 2-class problems, SVM can be
easily extended to multi-class problems by one-against-one or one-against-all strategies, where the latter is used in this work.
• C4.5: Syntactical classifiers use a hierarchical perspective where patterns are assumed to be formed by simpler sub-patterns. Decision trees are typical examples of syntactical classifiers. Quinlan's C4.5 (Quinlan, 1993) is a decision tree classifier that builds a classification tree by hierarchically splitting data.
We selected the above classifiers based on architectural complexity, mainly. LDC is the simplest classifier of all, which performs linear discrimination of the samples. k-NN is a popular classifier that bases its decision on similarity of the samples using a distance metric. Fuzzy k-NN is a more complex version of k-NN where distance information of samples is also used. SVM is a very popular classifier that has proven its capability in various classification problems. It is a linear classifier like LDC, but maps inputs vectors to a higher dimensional space before classification. Finally, C4.5 provides transparency in classification in the sense that the user can analyze the underlying reasons of the classification process, which is not trivial in artificial neural network for example. In this study Matlab built-in library (The MathWorks Inc.), LIB-SVM (Chang and Lin, 2001) and an adaptation of Quinlan's (1993) work are employed for LDC, SVM and C4.5 classifiers, respectively, whereas the rest are implemented by the authors. After several trials, optimum parameters for each classifier were found as: k = 5 for
k-NN and fuzzy k-NN; gaussian RBF kernel with γ = 10 and C = 80 for SVM; and finally minimumsplitsize = 2
and CF = 0.25 for C4.5.
2.6. Evaluation
Evaluation of classification process is measured by k-fold (k = 5) cross-validation method. In this method the database is partitioned into k complementary subsets, of which a single subset is assigned as validation set while
the remaining k-1 subsets are used for training. This cross-validation process is repeated k times, with each subset used exactly once for validation. Final estimate is then computed as the average of the k validation results. Besides, samples are randomly ordered before being introduced to the classifier, to prevent recognition biased to sample order.
The following measures are used to estimate the prediction performances of the classifiers tested in this study: overall accuracy, producer's accuracy, user's accuracy, Cohen's Kappa statistic (Cohen, 1960) and actual error. Producer's accuracy measures how well we are able to represent the actual classification and it is computed as the number of correctly classified elements divided by the reference elements for that category, whereas user's accuracy measures how likely the user is to encounter correct information while using the system and it is computed as the number of correctly classified elements in each category divided by the total elements that were classified in that category (Stehman, 1997). Cohen's Kappa statistic (Cohen, 1960) is a measure of inter-rater reliability, which estimates the agreement between two raters and is generally thought to be a more robust measure than overall accuracy. Kappa statistic falls in the range of [0,1], where higher values depict more agreement among raters. Kleynen et al. (2005) stated that in a raw batch of apples about 90% of the fruits are healthy. Considering this fact, we can compute actual error from both producer's and user's point of view using the following equation:
where e refers to error and α = 0.9. Please note that individual defective categories are merged into a single category in this formula, because we do not have the corresponding a priori probability information.
Moreover, statistical significance of the classification results are measured by McNemar's test (Everitt, 1977), a non-parametric statistical method to estimate significance of two systems (A and B) (Dietterich, 1998). It is computed by
where n01 and n10 refer to the number of samples misclassified by system A but not by B and by system B but not
by A, respectively. If McNemar's value is greater than 3.8415 (critical value for 5% significance level), then the two systems are said to be different with 0.05 level of significance. McNemar statistic considers marginal homogeneity of two-categories at one time, therefore it is not suitable for multi-category cases for which we employed the non-parametric Stuart-Maxwell statistic (Stuart, 1955; Maxwell, 1970; Everitt, 1977) that measures marginal homogeneity for all categories simultaneously.
3. Experimental results
3.1. Two-category grading
The marketing standard of European Commission (Anonymous, 2004) defines three acceptable and one reject quality categories for apple fruit. However, half of the literature consists of works with two-category
(acceptable/reject, healthy/defective or bruised/non-bruised) grading, which is most likely due to the difficulty of database collection and grading processes. Therefore, we will first introduce two-category grading results in order to permit comparison with the literature.
First we have to state that, after numerous tests we observed that for two-category grading Haralick's features from GLCM matrices either degraded recognition rates (when all features are used) or were not even selected by feature selection. Therefore, we present results with only invariant moments of Hu used as textural features. Notice that, excluding Haralick's four features leads to a feature set of 51 attributes in total.
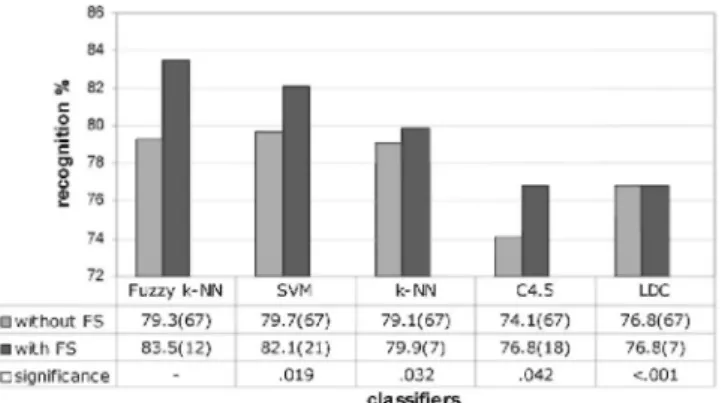
We performed fruit grading with each classifier first using all features together and then benefiting from feature selection. Fig. 4 displays the best recognition rates achieved for this test. As observed, when we use all features together highest recognition rate achieved is 86.5% by SVM. As soon as feature selection is applied recognition accuracies of each classifier distinctly increase. Feature selection not only increases accuracies of classifiers, but also removes irrelevant or redundant features by shrinking size of feature set from 51 down to 11-14. Note that, feature sets selected with each classifier largely overlap with each other, and thus the selected features for only the best performing classifier - SVM -are presented (see Table 2). Statistically speaking SVM result with feature
selection (93.5%) was significantly different from the others.
Fig. 4. Fruit grading results into two quality categories with and without feature selection (FS). Each cell in the
first two rows of the data table refers to recognition accuracy (%) of a classifier and the number of features (in parenthesis) used with it, while those in the last row show statistical significance levels of each classifiers' result (with feature selection) with that of SVM.
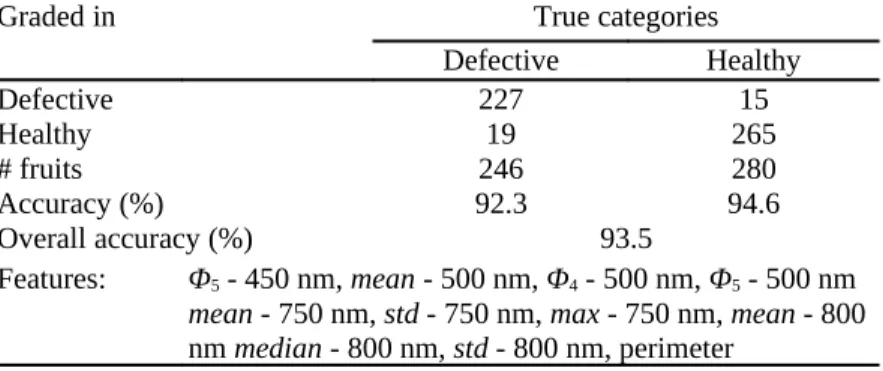
Table 2 Confusion matrix of the best two-category grading (SVM with feature selection). Selected features are
displayed below.
Graded in True categories
Defective Healthy Defective 227 15 Healthy 19 265 # fruits 246 280 Accuracy (%) 92.3 94.6 Overall accuracy (%) 93.5 Features: Φ5 - 450 nm, mean - 500 nm, Φ4 - 500 nm, Φ5 - 500 nm
mean - 750 nm, std - 750 nm, max - 750 nm, mean - 800
nm median - 800 nm, std - 800 nm, perimeter
In Table 2 we observe the confusion matrix of SVM together with the selected features. Recognition accuracy on healthy fruits is 94.6%, while on defective fruits it is slightly lower (92.3%). Features selected are mostly from the statistical group.
Among several works introduced in the literature for two-category fruit grading, that of Kleynen et al. (2005) gains our attention, because image acquisition system and fruit database they used were the same as ours. In their work, a LDC with statistical features classified 94.3% of healthy and 84.6% of defective fruits correctly. Hence, our approach provides improved recognition (especially for defective fruits) with a similar number of features and a more sophisticated classifier.
3.2. Multi-category grading
A realistic fruit grading system should not just sort fruits as defective or healthy, but provide a more detailed classification. In order to permit such a multi-category grading, we manually classified the defective fruits into four quality categories, which are defined taking severity of defects and the marketing standard of European Commission into account (Anonymous, 2004). Table 3 displays the details of this manual classification. 'Bruised fruits' are considered a separate category due to the significant amount of literature works focusing only this kind of defect.
Table 3 Manual classification of the defective fruits in our database.
Category Explanation # of fruits
d1 Defect leading to rejection of fruit (e.g. rot) 60
d2 Bruised fruit 55
d3 Seriously defective fruit (e.g. scar tissue) 55 d4 Slightly defective fruit (e.g. small russet) 76
Overall 246
3.2.1. Direct approach for multi-category grading
These four categories are related to the defects. With the inclusion of an additional category for healthy fruits, we can perform multi-category (5 grades) grading using a single classifier (direct approach).
In Fig. 5 we observe results of each classifier in direct approach with and without feature selection step. Like in the two-category results, feature selection removes unnecessary features and improves recognition accuracy for all classifiers. Highest recognition rate is achieved by fuzzy k-NN this time with 83.5% and 12 features out of possible 67. Significance analysis of the results with feature selection reveals that this fuzzy k-NN result is significantly different from others.
Fig. 5. Multi-category fruit grading results by direct approach with and without feature selection (FS). Each cell
in the first two rows of the data table refers to recognition accuracy (%) of a classifier and the number of features (in parenthesis) used with it, while those in the last row show statistical significance levels of each classifiers' result (with feature selection) with that of fuzzy k-NN.
Table 4 displays confusion matrix of the fuzzy k-NN result and the selected features. The classifier performs relatively well for healthy, d1 and d2 categories. On the other hand, accuracies for slightly (d4) and seriously (d3) defective fruits are quite low. Confusions are generally between adjacent categories (e.g. most misclassified fruits of d4 category are assigned to either d3 or healthy). This observation is coherent with that of Kleynen et al. (2005). Regarding selected features, unlike the two-category case, textural features are favored over the others (7 of 12 selected features are textural).
Table 4 Confusion matrix of the best multi-category fruit grading result by fuzzy k-NN with direct approach.
Selected features are displayed below.
Graded in True categories
d1 d2 d3 d4 Healthy
d1 50 1 10 2 1
d2 2 48 3 1 0
d3 4 1 28 9 4
Healthy 1 2 6 18 267 # fruits 60 55 55 76 280 Accuracy (%) 83.3 87.3 50.9 60.5 95.4 Overall accuracy (%) 83.5 (p = 0.002) Features: Φ4 - 450 nm, Φ5 - 450 nm, Φ7 - 450 nm, median - 500 nm, std - 500 nm, Φ1 - 500 nm, Φ6 - 500 nm, Φ7 - 500 nm, mean - 750 nm,
SSV - 800 nm, defect ratio, circularity
3.2.2. Cascaded approach for multi-category grading
Instead of using a direct approach and leaving all decisions to one single classifier, we can benefit from a cascaded approach and divide decision process into simpler tasks using serial classifiers (Duda et al., 2001 ). Cascaded systems generally perform better than single classifiers with the expense of increased computational load. We tested two cascaded architectures for multi-category fruit grading as in Fig. 6. In both architectures the first classifier (classifier-1 ) learns to discriminate healthy and defective fruits, while the second (classifier-2) trains on the defective output of the first and then classifies defective fruits further into quality categories. Their difference lies in the outputs of the second classifiers: The 5c architecture, with an additional healthy output, can further correct the results of the first classifier (if a healthy fruit is classified as defective by the first classifier, the second one can re-assign it back to healthy category).
Fig. 6. Architectures of the cascaded multi-category fruit grading approach. Four-category (4c) scheme on the
left, five-category (5c) scheme on the right.
Fig. 7. Multi-category fruit grading results by 4c and 5c cascaded architectures with feature selection. Each cell
in the first two rows of the data table refers to recognition accuracy (%) of a classifier and the number of features (in parenthesis) used with it, while those in the last row show statistical significance levels of each classifiers' result (5c) with that of fuzzy k-NN.
Table 5 Confusion matrix of the best multi-category grading (SVM with 5c cascaded approach). Selected
features are displayed below.
Graded in True categories
d1 d2 d3 d4 Healthy d1 45 1 3 1 1 d2 1 50 1 2 0 d3 11 1 36 3 4 d4 3 2 15 52 8 Healthy 0 1 0 18 267 # fruits 60 55 55 76 280 Accuracy (%) 75.0 90.9 65.5 68.4 95.4 Overall accuracy (%) 85.6 (p = 0.07)
Features: min - 450 nm, Φ3 - 450 nm, ASM - 450 nm, CON - 450
nm, IDM - 450 nm, mean - 500 nm, min - 500 nm, Φ3 - 500 nm, Φ4 - 500 nm, Φ5 - 500 nm Φ7
- 500 nm, ASM - 500 nm, std - 750 nm, Φ4 - 750 nm, ASM - 750 nm, IDM - 750 nm, SSV -
800 nm, IDM - 800 nm, defect ratio, circularity
First classifier of each architecture performs a two-category grading actually. Therefore, the best performer of the two-category grading tests (SVM with 93.5% recognition) is used as the first classifier in both architectures. On the other hand, several classifiers are tested with feature selection in place for classifier-2. Fig. 7 displays recognition accuracies of each classifier for both architectures. As observed, for most classifiers highest
performance is achieved by 5c architecture with the exception of C4.5, which maybe due to the feature selection method that is known to find sub-optimal solutions. Best performer is SVM with 85.6% followed by fuzzy k-NN and the results are significant with level of 0.07. Note that, these recognition rates are about 2% higher than the best recognition achieved by the direct approach.
Table 5 displays the confusion matrix for the grading result obtained by SVM and 5c cascaded architecture. Coherent with the results of the direct approach, SVM performs relatively good for healthy and bruised (d2) categories and confusions are mostly between adjacent categories. Comparative observations with the results of best direct approach (fuzzy k-NN) show that this SVM-based cascaded solution has better generalization capability for our classification problem (Smoother accuracies for defect categories. For example, lowest accuracy is observed in seriously defective (d3) fruits with 66%, which was 51% for direct approach.). Concerning selected features, SVM highly favors textural features by 14 out of 20.
3.2.3. Ensemble approach
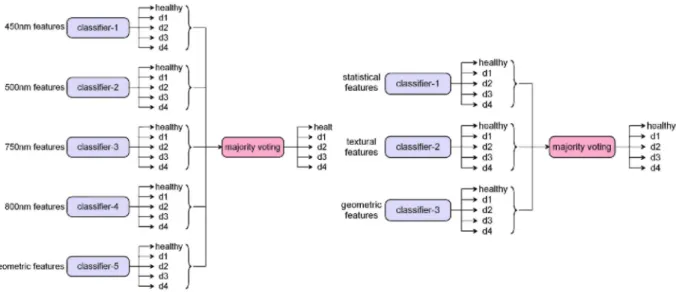
Ensemble systems take decisions based on the outputs of their component classifiers (experts). Such systems are particularly efficient if each expert is trained in a different region of the feature space (Duda et al., 2001) and if errors of each expert are different. Taking this information into account, we propose to construct two ensemble systems as in Fig. 8. Each expert is trained with features coming from different filter images (ensemble-01, on the left) and feature types (ensemble-02, on the right). Note that, geometric features do not depend on filter image, hence they are used separately in ensemble-01. Final decision is taken by majority voting on outputs of experts.
We can observe recognition accuracies of the ensemble systems with different classifiers used as experts and feature selection applied in Fig. 9. In general, ensemble-01 outperforms ensemble-02 by both accuracy and number of features selected. Highest recognition rate accomplished is 80.6%, which is not satisfactory when compared to the best rates observed by direct (83.5%) or cascaded (85.6%) approaches. The reason for this degradation is most probably due to the errors of experts that are highly inter-correlated. Furthermore, combination of several features (from different filters and types) is necessary to tackle the problem efficiently. Therefore, the proposed ensemble architectures are not advantageous for multi-category apple grading.
Fig. 8. Architectures of the ensemble systems for the multi-category fruit grading. The filter image-specific
(ensemble-01) scheme on the left and the feature type-specific (ensemble-02) scheme on the right.
Fig. 9. Multi-category fruit grading results by ensemble systems with feature selection. Each cell of the data
table refers to recognition accuracy (%) of a classifier and the number of features (in parenthesis) used with it.
Table 6 Comparison of the proposed multi-category grading methods.
Method A B
Approach Direct Cascaded (5c)
Classifiers Fuzzy k-NN SVM + SVM # features 12 11 + 15 Category Producer's accuracy User's accuracy Producer's accuracy User's accuracy d1 83.3 78.1 75.0 88.2 d2 87.3 88.9 90.9 92.6 d3 50.9 60.9 65.5 65.5 d4 60.5 67.7 68.4 65.0 Healthy 95.4 90.8 95.4 93.4 Actual error (α = 0.9) 7.19 10.85 6.74 8.35 Overall accuracy 83.5 85.6 Kappa 0.7456 0.7797
3.2.4. Comparison of the proposed methods
The multi-category grading results until now showed that we can reach to high recognition accuracies by direct and cascaded approaches. But, when should we prefer one over the other?
Table 6 displays a detailed comparison of these two methods. We observe that method B (cascaded approach) mostly outperforms method A (direct approach) in terms of producer's and user's accuracies of each category as well as overall accuracy and actual errors. Note that Kappa statistic, higher the value better the method, is also coherent with this observation.
Marketing standard for apples (Anonymous, 2004) defines three acceptable quality categories: Extra, Class I and Class II with respective tolerances of 5, 10 and 10%. Observations on user's accuracy values reveal that neither of the methods totally fit in these tolerance ranges due to the following reasons: (1) Our database considers bruised fruits as a separate category leading to a more troublesome classification process (five-category grading instead of four). (2) Tolerance definitions of the standard take only up-graded fruits into account and ignore down-graded ones, whereas user's accuracy considers both.
Concerning the computational complexities, method A is relatively simpler with single classifier and 12 features. On the other hand, method B, with two cascaded classifiers, requires two separate training-testing stages (instead of one for system A) and more features.
In conclusion, method A is computationally less demanding, while method B is more accurate. Therefore, the decision between method A or B depends on how powerful the user wants his/her machine vision-based apple inspection system. If computational resources are limited the user should prefer method A, but if accuracy is more decisive then method B is a better choice.
3.3. Practical Implementation
A fruit inspection system has to process at least 10 apples/s in order to cope with the industry. Moreover, multiple views of an apple must be obtained to inspect the whole fruit surface. The proposed method requires a computation time in the order of 3 s/view on an Intel Pentium IV Processor (1.5 GHz) with 256 M memory. However, the computation time can be considerably reduced using dedicated hardware, optimized software and parallel systems (the latter is a common trick in the industry to speed-up the process by using several inspection systems in parallel). Currently, the bottleneck in the proposed method is at the feature extraction step due to the textural features that are known to be computationally expensive. Hence, employing other textural features that are computationally more feasible (e.g. local binary patterns) can also be tested in terms of computational cost as well as inspection accuracy.
Even though experimental evaluation in this work is carried out on images of single-view, the proposed method can be easily extended to simultaneous processing of multiple-views, as required by the industry, provided that common regions in multiple views are canceled out.
4. Conclusion
In this paper we introduced a fully automatic grading work for bi-colored apples by multispectral machine vision. In the proposed solution we first segment defective skin in a pixel-wise manner, then we extract several image features from the resulting segments, and assign the fruits to the corresponding quality categories using statistical and syntactical classifiers.
Grading is executed into two and multi-categories, where the former is consistent with the literature while the latter is more realistic. Results of both gradings unveiled the importance of feature selection, which removed unnecessary features and improved classification accuracy. Moreover, we observed that highest performances are achieved by statistical classifiers and the results are significantly different.
Two-category grading results showed that our solution achieved improved accuracy relative to the state-of-the-art. Concerning multi-category grading, different architectural approaches are proposed. Results showed that combination of several features from different spectral filters and feature types is essential for the classifiers to perform well. Finally, our experimental validations support the following observations: if computational resources are limited one should prefer the single classifier architecture and realize adequate recognition, otherwise improved recognition rates can be achieved with cascaded classifiers.
As future work, the proposed solution should be installed in a real-life sorting environment and tested by multiple apple varieties in order to assess its accuracy, robustness, and generality.
Acknowledgements
This work is funded by the General Directorate of Technology, Research and Energy of the Walloon Region of Belgium with Convention No. 9813783. The authors wish to express their gratitude to the anonymous reviewers for their invaluable comments.
References
Anonymous, 2004. Commission regulation (ec) no 85/2004 of 15 January 2004 on marketing standards for apples. Off. J. Eur. Union L 13, 3-18.
Ariana, D., Guyer, D.E., Shrestha, B., 2006. Integrating multispectral reflectance and fluorescence imaging for defect detection on apples. Comp. Electron. Agric. 50 (2), 148-161.
Blasco, J., Aleixos, N., Molto, E., 2003. Machine vision system for automatic quality grading of fruit. Biosyst. Eng. 85, 415-423. Burges, C.J.C., 1998. A tutorial on support vector machines for pattern recognition. Data Min. Knowl. Disc. 2, 121-127. Chang, C.C., Lin, C.J., 2001. Libsvm: A Library for Support Vector Machines, via http ://www.csie.ntu.edu.tw/cj lin/libsvm.
Cheng, X., Tao, Y., Chen, Y.R., Luo, Y., 2003. NIR/MIR dual-sensor machine vision system for online apple stem-end/calyx recognition. Trans. ASAE 46, 551-558.
Cohen, J., 1960. A coefficient of agreement for nominal scales. Educ. Psychol. Meas. 20, 37-46.
Crowe, T.G., Delwiche, M.J., 1996. Real-time defect detection in fruit - Part I: Design concepts and development of protoype hardware. Trans. ASAE 39, 2299-2308.
Cubero, S., Aleixos, N., Molt, E., Gmez-Sanchis, J., Blasco, J., 2010. Advances in machine vision applications for automatic inspection and quality evaluation of fruits and vegetables. Food Bioprocess Technol., 1-18.
Davenel, A., Guizard, C, Labarre, T., Sevila, F., 1988. Automatic detection of surface defects on fruit by using a vision system. J. Agric. Eng. Res. 41, 1-9.
Diener, R.G., Mitchell, J.P., Rhoten, M.L., 1970. Using an X-ray image scan to sort bruised apples. Agric. Eng. 51, 356-361.
Dietterich, T.G., 1998. Approximate statistical tests for comparing supervised classification learning algorithms. Neural Comput. 10, 1895-1923.
Duda, R.O., Hart, P.E., Stork, D.G., 2001. Pattern Classification, 2nd edition. Wiley, New York.
ElMasry, G., Wang, N., Vigneault, C, 2009. Detecting chilling injury in red delicious apple using hyperspectral imaging and neural networks. Postharv. Biol. Technol. 52(1), 1-8.
Everitt, B., 1977. The Analysis of Contingency Tables. Chapman & Hall, London.
Geoola, F., Geoola, F., Peiper, U.M., 1994. Aspectrophotometric method for detecting surface bruises on 'golden delicious' apples. J. Agric. Eng. Res. 58, 47-51.
Haralick, R.M., 1973. Textural features for image classification. IEEE Trans. Syst. Man Cyber smc-3 6, 610-621. Hu, M.K., 1962. Visual pattern recognition by moment invariants. IRE Trans. Inform. Theory IT-8, 179-187.
Jiang, B.C., Szu-Lang, T., Chein-Chih, W., 2002. Machine vision-based gray relational theory applied to IC marking inspection. IEEE Trans. Semicond. Mater. 15, 531-539.
Kavdir, I., Guyer, D.E., 2004. Comparison of artificial neural networks and statistical classifiers in apple sorting using textural features. Biosyst. Eng. 89, 331-344.
Kleynen, O., Leemans, V., Destain, M.F., 2003. Selection of the most efficient wavelength bands for 'Jonagold' apple sorting. Postharv. Biol. Technol. 30, 221-232.
Eng. 69, 41-49.
Leemans, V., Destain, M.F., 2004. A real-time grading method of apples based on features extracted from defects. J. Food Eng. 61, 83-89. Leemans, V., Magein, H., Destain, M.F., 2002. On-line fruit grading according to their external quality using machine vision. Biosyst. Eng. 83, 397-404.
Lu, R., 2003. Detection of bruises on apples using near-infrared hyperspectral imaging. Trans. ASAE 46, 523-530.
Maxwell, A.E., 1970. Comparing the classification of subjects by two independent judges. Br. J. Psychiatry 116 (535), 651-655. Mehl, P.M., Chen, Y.R., Kim, M.S., Chen, D.E., 2004. Development of hyperspectral imaging technique forthe detection of apple surface defects and contaminations. J. Food Eng. 61, 67-81.
Peng, Y., Lu, R., 2008. Analysis of spatially resolved hyperspectral scattering images for assessing apple fruit firmness and soluble solids content. Postharv. Biol. Technol. 48(1), 52-62.
Pudil, P., Ferri, F.J., Novovicova, J., Kittler, J., 1994. Floating search methods for feature selection with nonmonotonic criterion functions. Proc. ICPR, 279-283.
Quinlan, J.R., 1993. C4.5: Programs for Machine Learning. Morgan Kaufmann, San Francisco.
Shahin, M.A., Tollner, E.W., McClendon, R.W., Arabnia, H.R., 2002. Apple classification based on surface bruises using image processing and neural networks. Trans. ASAE 45, 1619-1627.
Stehman, S.V., 1997. Selecting and interpreting measures of thematic classification accuracy. Remote Sens. Environ. 62, 77-89. Stuart, A., 1955. A test for homogeneity of the marginal distributions in a two-way classification. Biometrika 42 (3-4), 412-416. Sun, D.-W., 2010. Hyperspectral Imaging for Food Quality Analysis and Control. Elsevier Science, London.
Throop, J.A., Aneshansley, D.J., Anger, W.C., Peterson, D.L., 2005. Quality evaluation of apples based on surface defects: development of an automated inspection system. Postharv. Biol. Technol. 36, 281-290.
Tuceryan, M., Jain, A., 1998. Texture analysis. In: Chen, C.H., Wang, P.S.P. (Eds.), The Handbook of Pattern Recognition and Computer Vision. World Scientific Publishing Co., pp. 207-248.
Unay, D., Gosselin, B., 2006. Automatic defect detection of 'Jonagold' apples on multi-spectral images: A comparative study. Postharv. Biol. Technol. 42, 271-279.
Unay, D., Gosselin, B., 2007. Stem and calyx recognition on 'Jonagold' apples by pattern recognition. J. Food Eng. 78, 597-605. Upchurch, B.L., Affeldt, H.A., Hruschka, W.R., Throop, J.A., 1991. Optical detection of bruises and early frost damage on apples. Trans. ASAE 34, 1004-1009.
Vapnik, V.N., 1998. Statistical Learning Theory. John Wiley & Sons Inc., New York.
Wen, Z.,Tao, Y., 1999. Building a rule-based machine-vision system for defect inspection on apple sorting and packing lines. Expert Syst. Appl. 16, 307-313.
Xiao-bo, Z., Jie-wen, Z., Yanxiao, L., Holmes, M., 2010. In-line detection of apple defects using three color cameras system. Comp. Electron. Agric. 70( 1 ), 129-134.